
Abstract
Objective: The literature on testosterone (T) in men reports diverse correlates of T, some with minimal empirical support and most with little indication of how they change with advancing age. We test eight putative correlations across age.
Method: Correlations were tested on a large sample of British men.
Results: Seven of eight correlations replicated. Most change across men's life courses. The diurnal cycle of T is considerably weaker among older than younger men. Single men have higher T than married men of the same age; however, this difference lessens as men get older. Elevated T among smokers is less pronounced as men age. The inverse relationship between obesity and T is sustained across the adult age range. The lessening of T with age is well established, however there is disagreement about the course of decline. We find T having a steep decline around age 30, with possibly a rebound around age 50, after which levels remain roughly constant. Correlations involving health become stronger among older men. After age 30 or 40, the inverse relationships between T and HbA1c, diabetes, and metabolic syndrome all become increasingly significant, though not necessarily strong in magnitude.
Conclusion: Most putative correlates of T are replicated. There is a basis here for the generalization that among older men, those healthy have higher T than those who are not, but not a lot higher.
Introduction
Testosterone (T) plays a dynamic role in men’s lives [Citation1]. Empirical correlations that have been reported include diurnal decline in T from morning to afternoon, decline in T with obesity, declining T with advancing age, and associations with morbidity and mortality. These (and other) findings are sometimes based on modest samples, especially for the oldest men, leaving in doubt their validity across ages, e.g. [Citation2]. Possibly the dynamics of T lessen in older men. “Endocrine function undergoes major changes during aging… Specifically, alterations in hormonal networks and concomitant hormonal deficits/excess, augmented by poor sensitivity of tissues to their action, take place” [Citation3].
Here, we present eight putative correlates of T, derived from various studies, some well-grounded, others less so. The literature is sometimes sparse and not entirely consistent. Discrepant reports may invalidate generalizations, or they may simply be due to inadequate sampling, whether serum or saliva was assayed, and the method of assay. Especially suspect is enzyme immunoassay of T in saliva, compared to the “gold standard,” liquid chromatography-tandem mass spectrometry (LCTMS) [Citation4,Citation5]. Thus, the robustness of our generalizations is variable. Most have not adequately been tested, and their application to elderly men is especially dubious. Here we test proposed correlations on the large United Kingdom Household Longitudinal Study (UKHLS), a general-purpose longitudinal dataset of the UK population that collects a range of socioeconomic and health information, little exploited for this purpose [Citation6]. Between 2010 and 2012, a one-off nurse visit involved the collection of additional health and biomarker information that we use for this analysis (see) [Citation7]. We give special attention to the effects of aging.
Relatively low female T makes measurement difficult so we exclude females from the analysis. Also of note, only a small portion of total T is biologically active as free T, a quantity not included in the dataset, so we do not address free T. All results are for total serum T. The time of nurse’s visit approximates the time of blood drawing.
Putative correlates of male T
Our enumeration of propositions is pragmatic, focusing on those explicit in the literature and testable with the large dataset at hand. Potential associations of T with male sexuality or prostate cancer, for example, are well known but cannot be tested for lack of relevant data in this dataset. We address these eight:
1. Male T has a diurnal rhythm, high in the morning, lower as the day goes on (e.g.) [Citation8,Citation9]. However Bremner et al. [Citation10] reported a loss of circadian rhythm with aging.
2. Low T is associated with obesity as measured by body mass index (BMI) [Citation11–14].
3. In industrialized societies, men past the age of thirty on average show declining T [Citation15–22]. It is uncertain whether this decline is gradual and continuous into old age or occurs mainly in middle age with little further reduction [Citation18,Citation23,Citation24]. Of related interest are studies of subsistence societies, suggesting that male T is normally lower than in industrial societies and has little or none of the age-related decline found in industrial societies [Citation25–27].
4. Married men have lower levels of T than single men [Citation28,Citation29]. In one longitudinal study with four waves over 10 years, T declined when a marriage occurred but rose in the years around a divorce [Citation4].
5. Cigarette smoking raises T [Citation30].
6. T has been associated with diverse risk-taking behaviors [Citation31–33]. Some affirmative studies depended on the ratio of the second-to-fourth finger as a proxy for T in utero, however, that association is questionable [Citation34–36], measuring salivary T using LCTMS, found no consistent relationship between T and economic risk-taking, and a review of earlier work raised doubts about the association [Citation37].
Low T is associated with morbidity and mortality [Citation38–41]. The popularity of testosterone replacement therapy (TRT) in the twenty-first century has pushed this concern to the fore, with reports of both beneficial and adverse effects on cardiovascular disease (CVD) and type 2 diabetes [Citation42–46]. Therefore, we address two health-related correlations:
7. Low T is associated with Type 2 diabetes and high levels of hemoglobin A1c (HbA1c), which measures the average level of blood glucose in the past two to three months [Citation47–50] (Willert et al. 2021[AQCitation5]).
8. Low T is associated with metabolic syndrome, a predictor of CVD [Citation46,Citation51–53]. However, Bhasin et al. [Citation54] found no independent relationship, and Blaya et al. [Citation55] assert that central obesity is the primary factor of metabolic syndrome that is related to T.
Methods
Our analysis is restricted to men aged 16–90 years old from the UKHLS [Citation56]. These are publicly available data from the UK Data Service and require no ethics review for secondary analysis. The age range is collapsed into 23 age groups, their maximum sample sizes shown in .
Table 1. Number of observations per age group.
In the years 2010–2012 (Waves 2 and 3), T was assayed in blood drawn from adults during home visits by a nurse [Citation57]. T was measured once per subject and not measured in later waves. Nurse visits occurred throughout the day, providing an opportunity to replicate the diurnal effect on T. The mean time of day when nurses visited men over sixty years of age was about two hours earlier than the mean time of visits to younger men, so raw T values were adjusted as if all blood had been drawn at 10 am. Hereafter, “T” refers to T adjusted to 10 am.
Blood drawn by the nurse was measured for total T by electrochemiluminescent immunoassay on the Roche Modular E170 analyzer, with the lowest detectable T > 1 nmol/L. Few men had undetectable T, but the majority of women did. An undetectable T value was scored as a missing value. Intra- and inter-assay coefficients of variation were less than 4% [Citation7]. We follow the UKHLS biomarker user guide (see) [Citation7], which states the normal range of T in men is 9–25 nmol/L.
Metabolic syndrome (MS) is a measure of risk for CVD, typically diagnosed by the presence of three or more medical conditions: abdominal obesity, high blood pressure (multiple readings), high blood sugar, high triglycerides, and low high-density lipids. Details of measurement vary among medical organizations (see Wikipedia’s entry for MS), and we use a modified definition here, taking HbA1c to measure high blood sugar because fasting glucose test results are not available. We exclude high blood pressure because our dataset did not include multiple readings, replacing this with another risk factor for CVD, C-reactive protein, discussed as a supplemental indicator of MS (e.g.) [Citation58].
Typically, abdominal obesity is measured by waist size, but the International Diabetes Federation takes BMI ≥ 30 kg/m2 as implying central obesity. In the UKHLS data, high BMI and high waist size are redundant measures, 96% consistent across men. Analytic results are nearly identical no matter which one is used. Our dummy for MS is scored 1 if at least three of the following risk factors are present, 0 otherwise.
Triglycerides ≥ 1.7 mmol/L
High density lipids < 1.04 nmol/L
BMI ≥ 30
C-reactive protein > 3 mg/L
HbA1c ≥ 48 mmol/mol (≥ 6.5%).
For each putative correlation, we display a plot (or plots) of mean adjusted T against age. For tests of the early propositions, we instead plot standardized regression coefficient (beta) against age.
Each correlation is further tested with regression models, usually for a restricted age range, using a suite of control variables that may explain away the putative correlation. Standard control variables are BMI, ethnicity, marital status, employment status, education level, socioeconomic class of job (separate category for retired), and whether or not the respondent is a smoker. These data are measured at the nurse visit or the most recent main-stage survey wave prior to the nurse visit.
Results
The UKHLS sample is broadly representative of the UK adult population in 2009–2010. Mean T for 5940 men = 15.7 nmol/L (sd = 5.8) with few missing values. Assays were conducted for 7333 women, producing usable values (i.e. > 1 nmol/L) for only 1787 women, whose mean T = 1.89 nmol/L (sd = 2.1). The ratio of male to female T is 8.3, however, if values had been available for the majority of women with undetectable T (i.e. < 1 nmol/L), that ratio would have been correspondingly higher.
Diurnal variation in T decreases with age
Nurse visits were scattered throughout the day, allowing a test of diurnal change by regressing (unadjusted) T against the time-of-day blood was drawn. A negative beta, or standardized regression coefficient, indicates that T is lower the later in the day that blood was drawn. Separate regressions were run for each age group. plots beta across age groups. (Vertical lines show 95% confidence intervals for each beta.) We see that beta is negative at each age; however, this effect is the strongest in young men, greatly diminishing in middle age and the elderly.
Figure 1. Testosterone decreases during the day at all ages, less so after age 25. Data were taken from Understanding Society: Waves 2 and 3 Nurse Health Assessment, 2010–2012. The blue dots refer to the age-group-specific beta coefficients of the time-of-day blood were drawn, and the vertical lines show the 95% confidence intervals.
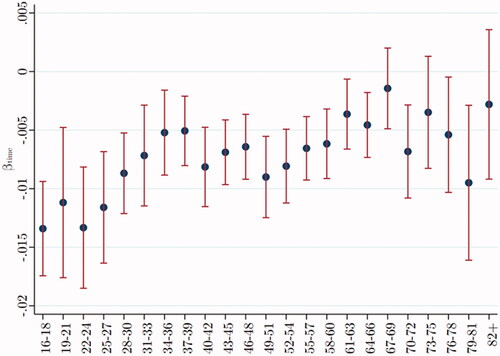
As a simple indication of the diurnal effect, consider that if men aged 22–24 years had blood drawn at 4 pm, the assay would show their mean T to be 17.83 nmol/L, but if the same men had blood drawn at 10 am, their mean T would have been 23.16 nmol/L, a difference of 5.33 nmol/L. If men aged between 58 and 60 had blood drawn at 4 pm, the assay would show their mean T to be 14.94 nmol/L, but if the same men had blood drawn at 10 am, their mean T would have been 17.52 nmol/L, a difference of only 2.57 nmol/L.
To evaluate the effect of possibly confounding variables, we estimate two regression models. The first only considers the time of nurse visit (approximating time of blood draw) on unadjusted T. In this case, for a 1-minute increase in the time of the nurse visit (past 10 am), unadjusted T declines by −0.015*** nmol/L for men aged between 22 and 24. In the second regression, including the suite of covariates (listed under Methods), for a one-minute increase in the nurse visit, unadjusted T declines to −0.013*** nmol/L. Thus, the inclusion of controls barely changes the association of T with the time of the nurse’s visit.Footnote1
The remainder of the analysis uses “adjusted T,” statistically adjusting the time of nurse visit as if it were 10 am.
Obesity is associated with lower T
Adjusted T was regressed on BMI for each age group (after dropping extreme values of BMI < 15 and BMI > 35, less than 1% of the sample). plots beta across age groups, showing the inverse relationship between T and BMI at each age. This inverse correlation becomes more negative after age 30, then remaining relatively constant across as men age.
Figure 2. Testosterone varies inversely with BMI, especially after age 30. Data were taken from Understanding Society: Waves 2 and 3 Nurse Health Assessment, 2010–2012. The blue dots refer to the age-group-specific beta coefficients of the BMI index on the adjusted T level, and the vertical lines show the 95% confidence intervals.
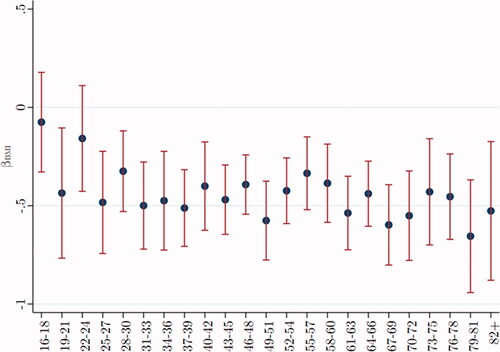
To evaluate the effect of control variables on the association of BMI with adjusted T, as before, we estimate two regression analyses. The first considers the effect of BMI alone on adjusted T, showing if BMI increases by one unit (on the standard scale), average adjusted T declines by −0.17 nmol/L for men aged between 22 and 24. In the second regression, including our suite of control variables, the effect of BMI on T becomes increasingly negative, to −0.38* nmol/L. Thus, for young men, the inclusion of control variables makes the inverse association of BMI with T stronger. For older men, the inverse correlation (beta ca. −0.5) is sizable regardless of controls.
T decreases with age, especially for males in their thirties
In , we plot mean adjusted T across age groups, separately for men with normal BMI (18.5–<25) and for men who are obese (BMI = 30–40). T declines steeply among men during their 30 s, with possibly a “bounce back” for men in their forties, then staying more or less level, independently of BMI. BMI does not explain this age trend.
Figure 3. Testosterone declines steeply after age 30, independently of BMI. Data were taken from Understanding Society: Waves 2 and 3 Nurse Health Assessment, 2010–2012. The blue (red) dots refer to the age-group-specific adjusted T level for men with a BMI of 30–40 (18.5–<25), and the vertical lines show the 95% confidence intervals. *, **, and *** signify statistical significance at the 10, 5, and 1% levels, respectively.
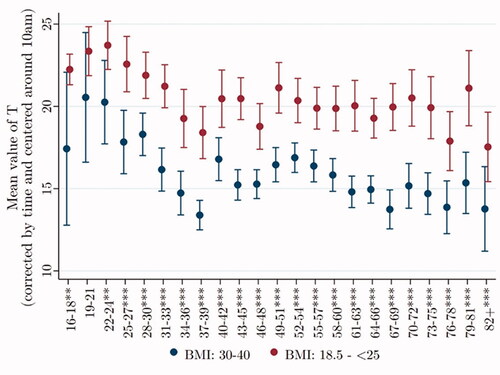
To evaluate the influence of control variables on the relationship of age to T, we again estimate two regressions. The first, including only the effect of age on T, shows that if age increases by five years, from 50 to 55, average T declines by 1.50** nmol/L. Adding our suite of control variables shows that if age increases from 50 to 55, average T decreases by 2.65*** nmol/L. Thus, the inclusion of control variables strengthens the inverse relationship between age and T.
Married men have lower T, especially among young men
In , age groups have been collapsed to ensure adequate samples of single men, the smallest group now being men over age 60 (N = 110). For individuals in their twenties (N = 342), the mean T of single men is far higher than that of married men. This difference remains significant in later ages but diminishes in magnitude, perhaps reflecting the independent decline in T with age.
Figure 4. Testosterone of single men is higher than that of married men at all ages. Data were taken from Understanding Society: Waves 2 and 3 Nurse Health Assessment, 2010–2012. The blue (red) dots refer to the age-group-specific adjusted T level for single (married) men, and the vertical lines show the 95% confidence intervals. *, **, and *** signify statistical significance at the 10, 5, and 1% levels, respectively.
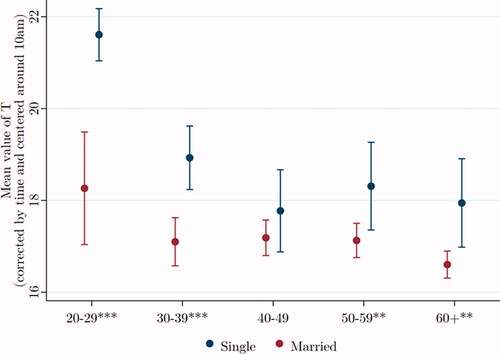
We again estimate two regressions to evaluate the effect of marital status on T. The first, with only marital status as independent variable, shows that among men aged between 30 and 39, those married have average T that is 1.96*** nmol/L lower than single men. The second, including our suite of control variables, again for men aged 30–39, shows those married have average T that is 1.34** nmol/L lower than single men. Thus, the qualitative nature of the correlation remains significant, but its magnitude declines by 30% in the presence of controls.
Smokers have high T
replicates the previously reported finding that smokers have higher T than non-smokers. We see the difference persisting into old age, even as T generally decreases.
Figure 5. Testosterone of smokers is higher than that of non-smokers at all ages. Data were taken from Understanding Society: Waves 2 and 3 Nurse Health Assessment, 2010–2012. The blue (red) dots refer to the age-group-specific adjusted T level for smoking (not smoking) men, and the vertical lines show the 95% confidence intervals. *, **, and *** signify statistical significance at the 10, 5, and 1% levels, respectively.
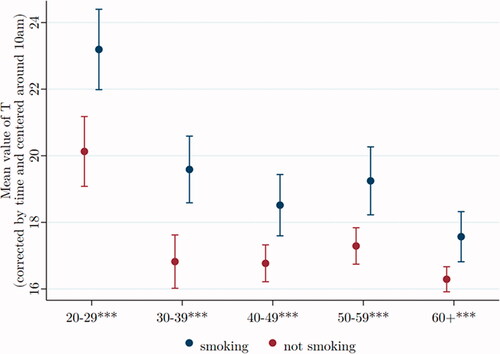
As before, we evaluate the effect of control variables by comparing two regressions, the first including only smoking as an independent variable, showing smokers with average T to be 2.50*** nmol/L higher than non-smokers of the same age. If we include our set of covariates, the excess T among smokers is a bit less, on average T = 2.33*** nmol/L over non-smokers. Thus, the qualitative nature of the correlation remains unchanged, though the magnitude of the coefficient decreases by around 7%.
T is not significantly related to risk-taking
To test the association of T with risk-taking behavior, we use a particular question in the UKHLS asked at wave 1: “Are you generally a person who is fully prepared to take risks or do you try to avoid taking risks?” Answers are scaled from 0 to 10, where 0 = avoid taking risks and 10 = fully prepared to take risks.
We plotted mean T by age group, comparing men who are risk tolerant with men who are risk averse. At no age is T significantly higher for the risk tolerant than for the risk averse. Furthermore, there is no consistent or significant pattern across all ages that show T relatively higher among risk tolerant men.
The effect of covariates is rather small in the case of risk assessment. Without control variables, for men aged 60–69, increasing the 0–10 risk scale by one unit, average adjusted T increases by 0.20. Including all covariates the effect attenuates slightly to 0.17.
Low T is related to high HbA1c and type 2 diabetes
High levels of HbA1c (>42 mmol/mole) are diagnostic of prediabetes. Men over age 50 with high HbA1c have significantly lower T than their age mates with normal HbA1c ().
Figure 6. Over the age of 50, testosterone is significantly lower for men with high HbA1c. Data were taken from Understanding Society: Waves 2 and 3 Nurse Health Assessment, 2010–2012. The blue (red) dots refer to the age-group-specific adjusted T level for men with an HbA1c level > 42 nmol/mol (≤ 42 nmol/mol), and the vertical lines show the 95% confidence intervals. *, **, and *** signify statistical significance at the 10, 5, and 1% levels, respectively.
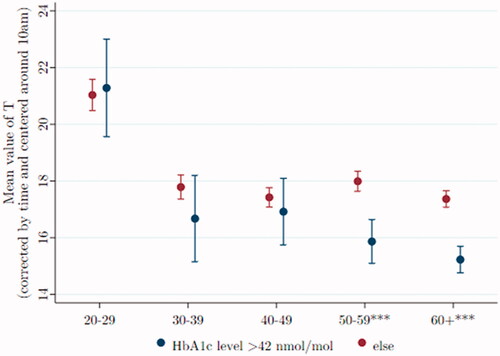
However, even positing that raising T would lower HbA1c, the estimated differences are not especially large. For example, among men aged 50–59, if we statistically raise the T level of those diabetic and prediabetic from their mean level of 15.1–17.6 mmol/mol, the average T for non-diabetic men of that age, the diabetic men’s Hba1c would be reduced from 39.2 to 38.6.
We again estimate two regression models to test the influence of control variables on the relationship. In the first regression, with HbA1c the sole independent variable, diabetic and prediabetic men of ages 50–59 have an average T that is 2.40*** nmol/L lower than the T of normal men of the same age. The suite of covariates is added in the second regression, reducing the deficit in average T to 1.51*** nmol/L, still highly significant.
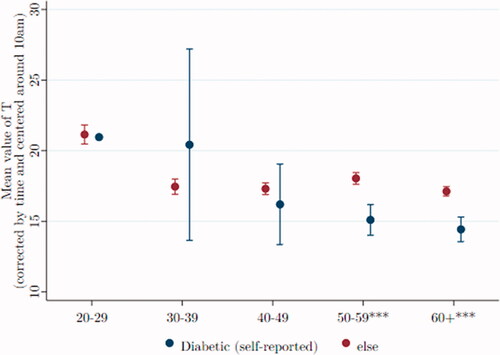
Type 2 diabetes, infrequent among young men, is usually diagnosed after age 40. compares T (by age) of 357 men who self-reported being diabetic, compared to T of 3201 men who did not report the disease.
Figure 7. Among older men, T is lower among those reporting they have diabetes. Data were taken from Understanding Society: Waves 2 and 3 Nurse Health Assessment, 2010– 2012. The blue (red) dots refer to the age-group-specific adjusted T level for men self-reporting being diabetic (not being diabetic), and the vertical lines show the 95% confidence intervals. *, **, and *** signify statistical significance at the 10, 5, and 1% levels, respectively.
Metabolic syndrome is associated with low T
MS (here modified, as explained under Methods), is an aggregate risk factor for heart disease and stroke. Men with and without metabolic syndrome are shown separately in , where mean T is plotted across age groups. After age 50, T levels are significantly and sizably lower for men with metabolic syndrome than for those without that risk.Footnote2
Figure 8. After age 50, T is relatively low in men with metabolic syndrome. Data were taken from Understanding Society: Waves 2 and 3 Nurse Health Assessment, 2010–2012. The blue (red) dots refer to the age-group-specific adjusted T level for men with metabolic syndrome (without metabolic syndrome), and the vertical lines show the 95% confidence intervals. *, **, and *** signify statistical significance at the 10, 5, and 1% levels, respectively.
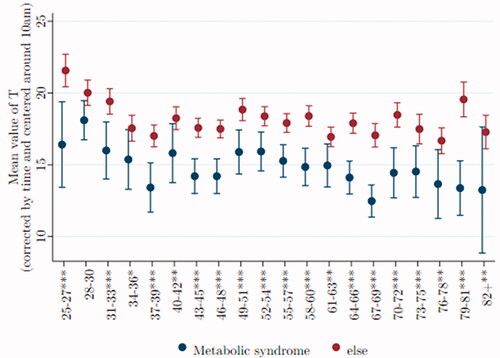
As before, we estimate two regression models. The first considers only the effect of metabolic syndrome on T, showing that for men of ages 58–60, those with the syndrome have an average T that is 3.95*** nmol/L lower than those without metabolic syndrome. Including our suite of covariates (except BMI) increases this deficit in T to 3.44*** nmol/L.
Discussion
Using the UKHLS, a representative large-scale survey of UK households, we replicated for men all putative correlates of T, except its putative relationship to risk-taking (see summary ). These correlations are robust after controlling for pertinent covariates. Furthermore, these successful replications effectively validate electrochemiluminescent immunoassay as a trustworthy method for measuring T in blood. A question remaining is whether these correlates apply to women with their much lower levels of T.
Table 2. List of propositions.
Most of the examined correlations change across men’s life course, sometimes but not always attenuating. One novel finding is the attenuation of the diurnal cycle of male T, which is considerably weaker among older than younger men (). An implication is that the medical practice of morning blood draws to assess T is not crucial for older patients. Another instance of “aging attenuation” is the lessening difference in T between married and single men, a direct result of single men’s T falling more quickly with age (). Also, elevated T among smokers is less so as men age (). These examples of diminishing effect may follow from the general diminution of T with age. On the other hand, the inverse relationship between BMI and T is sustained across the adult age range ().
Of particular interest is the lessening of T with age. Though well established in the literature, at least for industrial societies, there is disagreement about the course of the decline. A common view is that after the prime adult years, there is a continual decline with age. Empirically, we find evidence to the contrary, that after a steep decline around age 30, and a possible “bounce back” for men in their forties, T remains roughly level during the remaining years ().
Furthermore, we see the same shape of decline in comparing plots for men of normal weight and those obese. Obesity is clearly associated with lower T, but it does not explain the general decline with age.
Apparently, T of young men is remarkably high in industrial society, far higher than in subsistence societies. Perhaps the steep post-age 30 decline is simply a “correction” from abnormal heights during men’s twenties.
Unlike the correlations just noted, those involving health become stronger among older men. After age 30 or 40, the inverse relationships between T and HbA1c (), and diabetes (), and metabolic syndrome become increasingly significant, though not necessarily strong in magnitude. There is some basis here for the generalization that among older men, healthy men have higher T than those who are not, however not a lot higher.
Correlations become truly interesting when they display causal links, an issue beyond the scope of this article. We have begun to see randomized, double-blind, placebo-controlled, preregistered studies with sizable samples, aimed at therapeutic applications of T (e.g.) [Citation59]. This is an active area of inquiry that requires robust correlations as the first step that must be taken.
Acknowledgments
The authors thank Peter Eibich, Amanda Hughes, Bob Josephs, and Oliver Schulteiss for constructive comments on a preliminary version of the article, as well as anonymous reviewers for later comments.
Disclosure statement
Authors report no conflicting interests.
Additional information
Funding
Notes
1 We check whether the diurnal change in T is sensitive to functional form and alternative specifications that use dummies to identify time of interview. All variations are consistent with those presented here.
2 Corona et al. [52] report that T drops with the number of MS components, which we confirm. Results available on request.
References
- Bribiescas R. 2016. How men age. Princeton (NJ): Princeton NJ Press.
- Uchida A, Bribiescas RG, Ellison PT, et al. Age related variation of salivary testosterone values in healthy Japanese males. Aging Male. 2006;9(4):207–213.
- Diamanti-Kandaraks E, Dattilo M, Macut D, et al. Aging and anti-aging: a comboendocrinology overview. Eur J Endocrinol. 2017;176:R283–R308.
- Mazur A, Michalek J. Marriage, divorce, and male testosterone. Social Forces. 1998;77(1):315–330.
- Welker K, Lassetter B, Brandes C, et al. A comparison of salivary testosterone measurement using immunoassays and tandem mass spectrometry. Psychoneuroendocrinology. 2016;71:180–188.
- Hughes A, Kumari M. Testosterone, risk, and socioeconomic position in British men: exploring causal directionalty. Soc Sci Med. 2019;220:129–140.
- Benzeval M, Davillas A, Kumari M, et al. 2014. Understanding society: the UK household longitudinal study, biomarker user guide and glossary. Colchester Essex: Institute for Social and Economic Research, University of Essex.
- Dabbs J. Salivary testosterone measurements: reliability across hours, days, and weeks. Physiol Behav. 1990;48(1):83–86.
- Brambilla DJ, Matsumoto AM, Araujo AB, et al. The effect of diurnal variation on clinical measurement of serum testosterone and other sex hormone levels in men. J Clin Endocrinol Metab. 2009;94(3):907–913.
- Bremner WJ, Vitiello MV, Prinz PN. Loss of circadian rhythmicity in blood testosterone levels with aging in normal men. J Clin Endocrinol Metab. 1983;56(6):1278–1281.
- Camacho EM, Huhtaniemi IT, O’Neill TW, et al. Age-associated changes in hypothalamic-pituitary-testicular function in Middle-aged and older men are modified by weight change and lifestyle factors: longitudinal results from the European Male Ageing Study. Eur J Endocrinol. 2013;168(3):445–455.
- Derby CA, Zilber S, Brambilla D, et al. Body mass index, waist circumference and waist to hip ratio and change in sex steroid hormones: the Massachusetts Male Ageing Study. Clin Endocrinol (Oxf). 2006;65(1):125–131.
- Kaplan SA, Lee JY, O’Neill EA, et al. Prevalence of low testosterone and its relationship to body mass index in older men with lower urinary tract symptoms associated with benign prostatic hyperplasia. Aging Male. 2013;16(4):169–172.
- Niskanen L, Laaksonen DE, Punnonen K, et al. Changes in sex hormone-binding globulin and testosterone during weight loss and weight maintenance in abdominally obese men with the metabolic syndrome. Diabetes Obes Metab. 2004;6(3):208–215.
- Banica T, Verroken C, Reyns T, et al. Early decline of androgen levels in healthy adult men. J Clin Endocrin Metab. 2021;106:1074–1083.
- Bann D, Wu F, Keevil B, et al. Changes in testosterone related to body composition in late midlife: findings from the 1946 British birth cohort study. Obesity (Silver Spring)). 2015;23(7):1486–1492.
- Clifton S, Macdowall W, Copas AJ, et al. Salivary testosterone levels and health status in men and women in the British general population: findings from the Third National Survey of Sexual Attitudes and Lifestyles (Natsal-3). J Clin Endocrinol Metab. 2016;101(11):3939–3951.
- Feldman HA, Longcope C, Derby CA, et al. Age trends in the level of serum testosterone and other hormones in middle-aged men: longitudinal results from the Massachusetts male aging study. J Clin Endocrinol Metab. 2002;87(2):589–598.
- Gray A, Feldman HA, McKinlay JB, et al. Age, disease, and changing sex hormone levels in middle-aged men: results of the Massachusetts male aging study. J Clin Endocrinol Metab. 1991;73(5):1016–1025.
- Kim YS, Hong D, Lee DJ, et al. Total testosterone may not decline with ageing in Korean men aged 40 years or older. Clin Endocrinol (Oxf). 2012;77(2):296–301.
- Vermeulen A, Goemaere S, Kaufman J. Testosterone, body composition and aging. J Endocrinol Invest. 1999;22(5):110–116.
- Yassin A, Nettleship JE, Talib RA, et al. Effects of testosterone replacement therapy withdrawal and re-treatment in hypogonadal elderly men upon obesity, voiding function and prostate safety parameters. Aging Male. 2016;19(1):64–69.
- Keevil BG, Clifton S, Tanton C, et al. Distribution of salivary testosterone in men and women in a British general Population-Based sample: the third national survey of sexual attitudes and lifestyles (natsal-3). J Endocrine Soc. 2017;1(1):14–25. | | 14–25
- Mazur A. The age-testosterone relationship in black, white, and Mexican-American men, and reasons for ethnic differences. Aging Male. 2009;12(2–3):66–76.
- Alvarado LC, Valeggia CR, Ellison PT, et al. A comparison of men’s life history, aging, and testosterone levels among datoga pastoralists, hadza foragers, and qom transitional foragers. Adapt Hum Behav Physiol. 2019;5(3):251–273.
- Ellison PT, Bribiescas RG, Bentley GR, et al. Population variation in age-related decline in male salivary testosterone. Hum Reprod. 2002;17(12):3251–3253.
- Trumble BC, Cummings D, von Rueden C, et al. 2012. Physical competition increases testosterone among Amazonian forager-horticulturalists: a test of the ‘challenge hypothesis Proceedings of the Royal Society B: Biological Sciences 279, 2907–2912.
- Booth A, Dabbs J. Jr. Testosterone and men’s marriages. Social Forces. 1993;72(2):463–477.
- Gettler LT, Sarma MS, Gengo RG, et al. Adiposity, CVD risk factors and testosterone: variation by partnering status and residence with children in US men. Evol Med Public Health. 2017;2017(1):67–80.
- Wang W, Yang X, Liang J, et al. Cigarette smoking has a positive and independent effect on testosterone levels. Hormones (Athens). 2013;12(4):567–577.
- Apicella C, Carré J, Dreber A. Testosterone and economic risk taking: a review. Adapt Hum Behav Physiol. 2015;1(3):358–385.
- Mehta P, Welker K, Zilioli S, et al. Testosterone and cortisol jointly modulate risk-taking. Psychoneuroendocrinology. 2015;56:88–99.
- Vermeersch H, T’Sjoen G, Kaufman JM, et al. The role of testosterone in aggression and non-aggressive risk-taking in adolescent boys. Hormon Behav. 2008;53(3):463–471.
- Hönekopp J, Bartholdt L, Beier L, et al. Second to fourth digit length ratio (2D:4D) and adult sex hormone levels: new data and a meta-analytic review. Psychoneuroendocrinology. 2007;32(4):313–321.
- Leslie M. The mismeasure of hands? Science. 2019;364(6444):923–925.
- Stanton S, Welker K, Bonin P, et al. The effect of testosterone on economic risk-taking: a multi-study, multi-method investigation. Horm Behav. 2021;134:105014.
- Kurath J, Mata R. Individual differences in risk taking and endogeneous levels of testosterone, estradiol, and cortisol: a systematic literature search and three independent Meta-analyses. Neurosci Biobehav Rev. 2018;90:428–446.
- Laughlin GA, Barrett-Connor E, Bergstrom J. Low serum testosterone and mortality in older men. J Clin Endocrinol Metab. 2008;93(1):68–75.
- Morgentaler A, Miner MM, Caliber M, et al. Testosterone therapy and cardiovascular risk: advances and controversies. Mayo Clinic proceedings. Vol. 90. Amsterdam, Netherlands: Elsevier; 2015. p. 224–251.
- Shores MM, Matsumoto AM, Sloan KL, Kivlahan DR. Low serum testosterone and mortality in male veterans. Arch Intern Med. 2006;166(15):1660–1665.
- Shores MM, Smith NL, Forsberg CW, et al. Testosterone treatment and mortality in men with low testosterone levels. J Clin Endocrinol Metab. 2012;97(6):2050–2058.
- Finkle WD, Greenland S, Ridgeway GK, et al. Increased risk of Non-Fatal myocardial infarction following testosterone therapy prescription in men. PLoS One. 2014;9(1):e85805.
- Groti Antonič K, Antonič B, Žuran I, et al. Testosterone treatment longer than 1 year shows more effects on functional hypogonadism and related metabolic, vascular, diabetic and obesity parameters (results of the 2-year clinical trial). Aging Male. 2020;23(5):1442–1454.
- Morgunov LY, Denisova IA, Rozhkova TI, et al. Hypogonadism and its treatment following ischaemic stroke in men with type 2 diabetes mellitus. Aging Male. 2020;23(1):71–80.
- Vigen R, O’Donnell CI, Barón AE, et al. Association of testosterone therapy with mortality, myocardial infarction, and stroke in men with low testosterone levels. JAMA. 2013;310(17):1829–1836.
- Zhang X, Huang K, Saad F, et al. Testosterone therapy reduces cardiovascular risk among hypogonadal men. Androgen Clin Res Ther. 2021;2(1):64–71.
- Haider KS, Haider A, Saad F, et al. Remission of type 2 diabetes following long-term treatment with injectable testosterone undecanoate in patients with hypogonadism and type 2 diabetes: 11-year data from a real-world registry study. Diabetes Obes Metab. 2020;22(11):2055–2068.
- Kumari N, Khan A, Shaikh U, et al. Comparison of testosterone levels in patients with and without type 2 diabetes. Cureus. 2021;13(7):e16288.
- Leutner M, Matzhold C, Bellach L, et al. Increase in testosterone levels is related to a lower risk of conversion of prediabetes to manifest diabetes in prediabetic males. Wien Klin Wochenschr. 2021.
- Yao QM, Wang B, An XF, et al. Testosterone level and risk of type 2 diabetes in men: a systematic review and Meta-analysis. Endocr Connect. 2018;7(1):220–231.
- Antonio L, Wu FCW, O’Neill TW, et al. Associations between sex steroids and the development of metabolic syndrome: a longitudinal study in European men. J Clin Endocinol Metab. 2015;100(4):1396–1404.
- Corona G, Forti G, Maggi M. Why can patients with erectile dysfunction be considered lucky? The association with testosterone deficiency and metabolic syndrome. Aging Male. 2008;11(4):193–199.
- Yassin A, Haider A, Haider KS, et al. Testosterone therapy in men with hypogonadism prevents progression from prediabetes to type 2 diabetes: eight-year data from a registry study. Diabetes Care. 2019;42(6):1104–1111.
- Bhasin S, Jasjua GK, Pencina M, et al. Sex hormone-binding globulin, but not testosterone, is associated prospectively and independently with incident metabolic syndrome in men: the Framingham heart study. Diabetes Care. 2011;34(11):2464–2470.
- Blaya R, Blaya P, Rhoden L, et al. Low testosterone levels and metabolic syndrome in aging male. Curr Pharm Des. 2017;28:4470–4474.
- University of Essex, Institute for Social and Economic Research, Nat Cen Social Research, Kantar Public. Understanding society: waves 1–10, 2009–2019 and Harmonised BHPS: Waves 1–18, 1991–2009. [data collection]. 13th ed. University of Essex, Colchester: UK Data Service; 2020. SN: 6614,
- McFall SJ, Petersen O, Kaminska P, et al. 2014. Understanding society: the UK household longitudinal study; waves 2 and 3 nurse health assessment, 2010–2012, guide to nurse health assessment. Colchester Essex: Institute for Social and Economic Research, University of Essex.
- Devaraj S, Valleggi S, Siegel D, et al. Role of C-reactive protein in contributing to increased cardiovascular risk in metabolic syndrome. Curr Atheroscler Rep. 2010;12(2):110–118.
- Wittert G, Bracken K, Robledo KP, et al. Testosterone treatment to prevent or revert type 2 diabetes in men enrolled in a lifestyle programme (T4DM): a randomized, double-blind, placebo-controlled, 2-year, phase 3b trial. Lancet Diabet Endocrinol. 2021;9(1):32–45.