
Abstract
Osteoporosis is often accompanied by bone loss with fat accumulation of the red marrow. A novel technique for quantification of iron and fat content by MRI IDEAL-IQ can visualize hematopoietic areas and fatty deposits in bone marrow; however, the relationship between these indices and total hip bone mineral density (BMD) remains unclear. In this study, the proximal femur of 104 men who underwent pelvic MRI and bone densitometry prior to treatment for non-metastatic prostate cancer was retrospectively examined to investigate the R2* value to quantify iron and proton density fat fraction (PDFF) to assess bone marrow fat content. R2* was significantly positively correlated with BMD (r = 0.6017, p < 0.0001), and PDFF was not correlated with BMD (r = −0.1302, p = 0.0512). Patients with BMD T-score ≤ −2.5 had significantly lower R2* than patients with BMD T-score > −2.5; however, there was no significant difference in PDFF. In the ROC analysis, which examined the predictive ability of R2* with BMD T-score ≤ −2.5 as an outcome, the cut-off value of R2* was 50.7 s−1 (AUC 0.817). These results show R2* correlated with BMD. R2* may be a non-invasive surrogate marker for diagnosing male osteoporosis.
Introduction
Prostate cancer is the second most prevalent cancer in men worldwide, and the incidence is expected to increase as the population ages [Citation1,Citation2]. Androgen deprivation therapy (ADT), a core component of prostate cancer treatment, affects bone remodeling and leads to cancer treatment-induced bone loss (CTIBL) as a serious complication leading to decreased quality of life (QOL) in elderly men [Citation3,Citation4]. CTIBL not only increases fracture frequency but also shortens overall survival [Citation4]. Conventional tools for assessing bone health include bone densitometry using dual-energy X-ray absorptiometry (DXA) and blood tests to measure bone metabolism markers. However, the proportion of prostate cancer patients receiving ADT who are screened for bone health is inadequate, and many patients who require treatment for CTIBL are often left undiagnosed and untreated, resulting in preventable fractures [Citation5,Citation6].
In recent years, iterative decomposition of water and fat with echo asymmetry and least-squares estimation (IDEAL-IQ) has been attracting attention as a technique for performing quantitative analysis of iron and fat accumulation in organs using MRI. The evaluation of iron and fat accumulation in the liver measured by IDEAL-IQ sequence has been used for non-invasive clinical diagnosis of hemochromatosis and fatty liver [Citation7,Citation8]. In bone assessment by IDEAL-IQ sequence, R2* values for iron accumulation reflect hematopoietic areas in the bone marrow, and proton density fat fraction (PDFF) reflects bone marrow fat [Citation9,Citation10].
The R2* and PDFF measured by IDEAL-IQ sequence may be used for the diagnosis of osteopenia and osteoporosis, because bone loss with bone marrow reconversion is a characteristic condition of senile and postmenopausal osteoporosis [Citation3]. However, there are no previous reports on the relationship between total hip bone mineral density (BMD) measured by DXA, R2*, and PDFF. This study investigated whether R2* and PDFF measured by IDEAL-IQ sequence from pelvic MRI of non-metastatic prostate cancer patients are associated with total hip BMD.
Materials and methods
Ethical approval
The retrospective protocol of this study was conducted according to the guidelines of the Declaration of Helsinki and approved by the Ethics Committee of Koto Hospital (No. 202221, approved on 18 February 2022). In this retrospective study, the need for written informed consent was waived.
Patient demographics
From September 2019 to March 2021, 141 patients diagnosed with prostate cancer by transrectal prostate biopsy at our institution were extracted from a database of electronic medical record systems. The exclusion criteria were bone metastasis (12 cases), DXA not performed (22 cases), and MRI not performed (3 cases). A total of 104 patients enrolled in this study had hormone-naïve prostate cancer. Age, body height, body weight, and body mass index (BMI) were retrospectively investigated. None of the patients in this cohort had a history of osteoporosis treatment or a history of femoral fractures.
Bone densitometry and MRI examination
The total hip BMD of the left proximal femur was evaluated by DXA using Lunar Prodigy (GE Lunar Corp., Madison, WI). All MRI examinations were performed on a 1.5 T MRI system (SIGNA Voyager 1.5 T version 26; GE Healthcare, Chicago, IL) using a 16-channel phased-array surface coil. After a conventional 3-plane localizer, axial and coronal T2-weighted (repetition time [TR] = 2515 ms, TE = 100 ms, field of view [FOV] = 220 mm × 220 mm, slice thickness = 3 mm, matrix = 320 × 224, excitation number [NEX] = 2) and T1-weighted (TR = 470 ms, TE = 18 ms, FOV = 220 mm × 220 mm, slice thickness = 3 mm, matrix = 320 × 192, NEX = 2) images were acquired using a fast spin-echo sequence. Then, axial DWI (TR = 6912, TE = 73.1, FOV = 320 mm × 320 mm, slice thickness = 3 mm, matrix = 96 × 96, NEX = 8, b value = 1500) was acquired. Finally, IDEAL-IQ imaging was performed in the coronal direction with the following scan parameters: TR = 13.1 ms, TE = 5.1 ms, FOV = 400 mm × 400 mm, slice thickness = 8 mm, flip angle = 7°, echo train length = 6, matrix = 160 × 160, and NEX = 1. The IDEAL-IQ scanning time was 34 s.
Assessment of R2* and PDFF
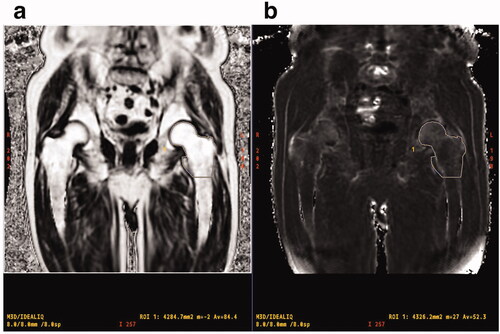
IDEAL-IQ imaging was processed using the software installed in the MRI system to create water, fat, in-phase, out of phase, R2 *, and fat fraction maps. To quantify R2 * and PDFF in the proximal femur, the regions of interest (ROIs) including the left femoral head, neck, greater trochanter, and proximal metaphysis (up to the lower end of the lesser trochanter) were manually traced (). Two independent observers (reader 1, N.K., orthopaedic radiologist with 21 years of experience; reader 2, T.N., orthopaedic radiologist with 13 years of experience) evaluated the MR images. The reproducibility between readers was statistically verified.
Figure 1. MR images show PDFF (a) and R2* (b) of proximal femur measured in a 76-year-old man with prostate cancer. ROI is manually traced from the femoral head to the horizontal line of the lower end of the lesser trochanter to calculate R2* value and PDFF. PDFF: proton density fat fraction; ROI: region of interest.
Statistical analysis
All statistical analyses were performed using the JMP® pro version 16 software (SAS Institute Inc., Cary, NC). The median was used for the aggregation of continuous variables, and the number of subjects and percentages were used to aggregate the categorical variables. The Wilcoxon rank sum test was used to compare the continuous variables between the two groups. Spearman’s rank correlation analysis was used to examine the relationships between continuous variables. A receiver operating characteristic (ROC) analysis was used to examine the predictive power of continuous variables with a BMD T score ≤ −2.5 as an outcome. Male patients in this cohort were over 50 years old (range 60–92 years). In January 2021, the Asia Pacific Consortium on Osteoporosis (APCO) proposed clinical standards for benchmarking the provision of appropriate osteoporosis treatment in the Asia Pacific region [Citation11]. According to the recommendation of the APCO, we implemented a T-score of −2.5 or less as a cut-off value for therapeutic intervention. p Values of < 0.05 were considered to indicate statistical significance.
Results
Patient characteristics
The characteristics of the patients included in this study are shown in . The median age (range) of the 104 patients was 76.6 years (60–92 years). Of the 104 patients, 14 patients (13.5%) had a BMD T-score ≤ −2.5. Patients with a BMD T-score ≤ −2.5 were significantly older (79.0 and 75.9 years, p = 0.0336, respectively) with significantly lower BMI (22.5 and 23.6 kg/m2, p = 0.0379, respectively) than patients with a BMD T-score > −2.5.
Table 1. Clinical characteristics of study population.
Relationship between BMD and bone assessment by IDEAL-IQ sequence
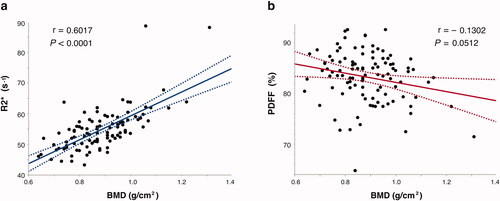
In the reproducibility verification between the readers, the measurement of R2 * in the proximal femur showed a good interobserver agreement (r = 0.8607, p < 0.0001), and the measurement of PDFF also showed a good interobserver agreement (r = 0.8327, p < 0.0001). Patients with a BMD T-score ≤ −2.5 had significantly lower R2* than patients with a BMD T-score > −2.5 (48.8 s−1 and 54.9 s−1, p = 0.0001, respectively), but no significant difference was found in PDFF (84.7 and 83.6, p = 0.3913, respectively) (). BMD (g/cm2) showed a significant positive correlation with R2* (r = 0.6017, p < 0.0001) and no significant correlation with PDFF (r = −0.1302, p = 0.0512) ().
Figure 2. Spearman’s rank correlation coefficient between BMD (g/cm2), MRI-based R2* value (a) and PDFF (b) in proximal femur. R2* values were significantly correlated with BMD compared with PDFF in prostate cancer patients. BMD: bone mineral density; PDFF: proton density fat fraction.
ROC curve analysis
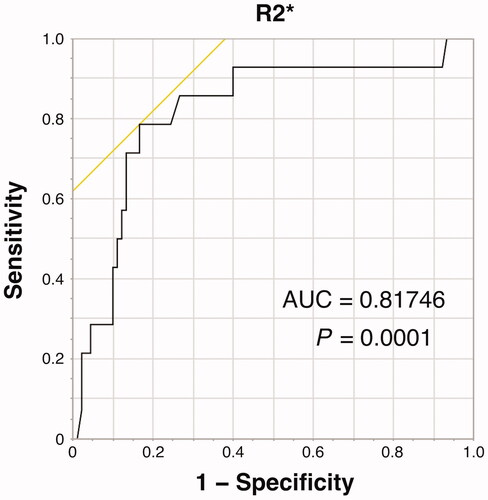
Using ROC analysis, the area under the curve value of R2* for distinguishing BMD-T score ≤ −2.5 and > −2.5 was estimated to be 0.817 with a sensitivity of 0.786, specificity of 0.833, and cut-off value of 50.7 s−1 ().
Figure 3. AUC of R2* for distinguishing BMD-T score ≤ −2.5 and > −2.5 was estimated to be 0.817, with cut-off values of 50.7 s−1. AUC: area under the curve; BMD: bone mineral density.
Discussion
In this study, R2* and PDFF of the proximal femur were measured using the IDEAL-IQ sequence. To our knowledge, this is the first study to examine the correlation of R2* and PDFF of the proximal femur with total hip BMD. Patients with a BMD T-score ≤ −2.5 were defined as having osteoporosis and exhibited significantly lower R2* than patients with a BMD T-score > −2.5; however, there was no significant difference in PDFF. BMD (g/cm2) was found to have a significant positive correlation with R2*, but not with PDFF. The ROC analysis showed a relatively high predictive ability of R2* with a BMD T-score ≤ −2.5 as an outcome. These results indicate that measurement of R2* in the proximal femur, which reflects iron content, may be a potential alternative to measurement of total hip BMD.
Osteoporosis is often thought of as a disease that affects women, but it is also a major disease associated with geriatric fractures that affect QOL in men [Citation12]. It has been widely recognized that aging is associated with bone loss and osteoporotic fractures in men [Citation13]. Load is an important factor in increasing femoral BMD, and BMI is consistently positively correlated with proximal femoral BMD [Citation14]. The prostate cancer patients of our study demonstrated comparable results as previous reports, showing that male patients with a BMD T-score ≤ −2.5 were significantly older (p = 0.0336) and had a significantly lower BMI (p = 0.0379) than patients with a BMD T-score > −2.5. Moreover, most cross-sectional studies reported to date have shown an inverse correlation between adipose tissue in bone marrow and BMD [Citation15,Citation16]. Recent studies have investigated the mechanism for controlling the equilibrium of bone-to-fat ratio in bone marrow, and abnormal lineage specification of skeletal stem cells has also been found to be associated with bone loss and increased bone marrow adipose tissue [Citation17]. However, contrary to our expectation, PDFF was not found to be suggestive of marrow adipose tissue, while R2* was significantly correlated with BMD (r = 0.6017, p < 0.0001). This result suggests that an increase in marrow adipose tissue has little effect on bone loss in the proximal femur. A previous study has examined the relationship between BMD at the hip and vertebral fat accumulation in older men. In the AGES-Reykjavik cohort study in Iceland, there was no significant association between vertebral marrow fat content measured by MR spectroscopy and trabecular or cortical volumetric BMD at the hip in older men [Citation18]. In our study, the areal BMD at the hip was used, and a detailed assessment is difficult due to the lack of distinction between cortical and trabecular bone. However, in older men, it does suggest that quantification of fat accumulation in the femur may not be a superior method for estimating bone density.
In general, the lumbar spine is another target area for bone densitometry. Since the lumbar spine is often affected by the increase of adipose tissue in the bone marrow with aging [Citation19], a correlation between PDFF measured by IDEAL-IQ sequence and BMD may be found. In fact, a Hydrogen 1 MR spectroscopy-based study of the third lumbar spine (L3) vertebral level in 82 men with an average age of 73 years showed a negative correlation between BMD measured by DXA and marrow fat content [Citation20]. Among 118 men in the AGES-Reykjavik cohort study, there was also a negative trend, although not significant, between vertebral marrow fat content and vertebral compressive strength derived from QCT and trabecular spine volumetric BMD [Citation18]. In the future, it may be worthwhile to analyze MRI of the vertebral regions in a large cohort with the IDEAL-IQ sequence.
ADT for prostate cancer decreases BMD and bone quality, and overall decreases bone strength in the proximal femur [Citation21]. Clinically, ADT often lasts for more than one year, and CTIBL is a serious complication leading to decreased QOL for cancer survivors. However, the proportion of patients undergoing ADT who have received bone densitometry is inadequate, which may be attributable to the lack of interest in bone densitometry during cancer treatment. It has become a problem that many patients who need treatment for osteoporosis are undertreated or remain untreated [Citation5,Citation6]. Needle biopsy is a necessary test for the definitive diagnosis of prostate cancer. MRI prior to biopsy is considered useful as it provides a criterion for determining the need for biopsy and improves the detection rate of clinically significant prostate cancer [Citation22]. Therefore, in almost all cases, pelvic MRI is performed prior to prostate biopsy. The advantages of the IDEAL-IQ sequence in this study are: the pelvic MRI that almost all prostate cancer patients undergo can be used; the prostate and proximal femur have a common imaging range, allowing for cancer localization and bone assessment in a single session; and the MRI IDEAL-IQ can be measured in less than 35 s, reducing the burden on the clinic schedule and the patients themselves. MRI IDEAL-IQ may be a useful non-invasive test in the absence of bone densitometry services.
There were several limitations of this study. First, a notable limitation stems from the absence of some potentially relevant information due to the retrospective nature of this study. Although we were able to retrieve medical records for all cases that met the inclusion criteria, important information regarding several aspects of bone health was unobtainable, such as the prevalence of hypogonadism and comorbidities known to be secondary causes of osteoporosis. While the limited patient characterization may affect the generalizability of our results, we believe that this study takes an important step toward elucidating the relationship between R2* and BMD. Second, this was a retrospective study that was limited to the Japanese population, and the number of enrolled prostate cancer patients was relatively small. Third, this was a cross-sectional study, and MRI evaluation after ADT was not available. It would be clinically meaningful to evaluate the relationship between IDEAL-IQ imaging and BMD at baseline and after ADT, and to investigate the usefulness of R2* in predicting CTIBL progression. Finally, due to the small sample size of this study, we were not able to exclude confounding factors that may affect BMD, such as frequency of alcohol consumption and physical activity. The use of the same DXA and MRI equipment at a single institution may reduce measurement error.
Conclusions
R2* measured by IDEAL-IQ sequence correlated with BMD and was moderately diagnostic of osteoporosis in elderly men with prostate cancer. Pelvic MRI with IDEAL-IQ sequence can be used for the non-invasive assessment of bone in order to compensate the lack of bone densitometry in urological practice. The method may serve as a useful measure to assess male osteoporosis.
Disclosure statement
Takahiro Kimura is a paid consultant/advisor of Astellas, Bayer, Janssen, and Sanofi. The other authors declare no conflict of interest.
Additional information
Funding
References
- Ferlay J, Soerjomataram I, Dikshit R, et al. Cancer incidence and mortality worldwide: sources, methods and major patterns in GLOBOCAN 2012. Int J Cancer. 2015;136(5):E359–386.
- Pakzad R, Mohammadian-Hafshejani A, Ghoncheh M, et al. The incidence and mortality of prostate cancer and its relationship with development in Asia. Prostate Int. 2015;3(4):135–140.
- Manolagas SC, O'Brien CA, Almeida M. The role of estrogen and androgen receptors in bone health and disease. Nat Rev Endocrinol. 2013;9(12):699–712.
- Bliuc D, Nguyen ND, Milch VE, et al. Mortality risk associated with low-trauma osteoporotic fracture and subsequent fracture in men and women. JAMA. 2009;301(5):513–521.
- Tanvetyanon T. Physician practices of bone density testing and drug prescribing to prevent or treat osteoporosis during androgen deprivation therapy. Cancer. 2005;103(2):237–241.
- Alibhai SM, Yun L, Cheung AM, et al. Screening for osteoporosis in men receiving androgen deprivation therapy. JAMA. 2012;307(3):255–256.
- Imajo K, Kessoku T, Honda Y, et al. MRI-Based quantitative R2(*) mapping at 3 tesla reflects hepatic iron overload and pathogenesis in nonalcoholic fatty liver disease patients. Magnetic Resonance Imaging. 2022;55(1):111–125.
- Eskreis-Winkler S, Corrias G, Monti S, et al. IDEAL-IQ in an oncologic population: meeting the challenge of concomitant liver fat and liver iron. Cancer Imaging. 2018;18(1):51.
- Ma Q, Cheng X, Hou X, et al. Bone marrow fat measured by a chemical Shift-Encoded sequence (IDEAL-IQ) in patients with and without metabolic syndrome. J Magn Reson Imaging. 2021;54(1):146–153.
- Zeng Z, Ma X, Guo Y, et al. Quantifying bone marrow fat fraction and iron by MRI for distinguishing aplastic anemia from myelodysplastic syndromes. J Magn Reson Imaging. 2021;54(6):1754–1760.
- Chandran M, Mitchell PJ, Amphansap T, et al. Development of the Asia pacific consortium on osteoporosis (APCO) framework: clinical standards of care for the screening, diagnosis, and management of osteoporosis in the Asia-Pacific region. Osteoporos Int. 2021;32(7):1249–1275.
- Johnell O, Kanis JA. An estimate of the worldwide prevalence and disability associated with osteoporotic fractures. Osteoporos Int. 2006;17(12):1726–1733.
- Walsh JS, Eastell R. Osteoporosis in men. Nat Rev Endocrinol. 2013;9(11):637–645.
- Nielson CM, Marshall LM, Adams AL, et al. BMI and fracture risk in older men: the osteoporotic fractures in men study (MrOS). J Bone Miner Res. 2011;26(3):496–502.
- Fazeli PK, Horowitz MC, MacDougald OA, et al. Marrow fat and bone-new perspectives. J Clin Endocrinol Metab. 2013;98(3):935–945.
- Schwartz AV. Marrow fat and bone: review of clinical findings. Front Endocrinol (Lausanne). 2015;6:40.
- Yu B, Huo L, Liu Y, et al. PGC-1alpha controls skeletal stem cell fate and Bone-Fat balance in osteoporosis and skeletal aging by inducing TAZ. Cell Stem Cell. 2018;23(4):615–623.
- Schwartz AV, Sigurdsson S, Hue TF, et al. Vertebral bone marrow fat associated with lower trabecular BMD and prevalent vertebral fracture in older adults. J Clin Endocrinol Metab. 2013;98(6):2294–2300.
- Wocial K, Feldman BA, Mruk B, et al. Imaging features of the aging spine. Pol J Radiol. 2021;86:e380–e386.
- Griffith JF, Yeung DK, Antonio GE, et al. Vertebral bone mineral density, marrow perfusion, and fat content in healthy men and men with osteoporosis: dynamic contrast-enhanced MR imaging and MR spectroscopy. Radiology. 2005;236(3):945–951.
- Watanabe D, Kimura T, Yamashita A, et al. The influence of androgen deprivation therapy on hip geometric properties and bone mineral density in Japanese men with prostate cancer and its relationship with the visceral fat accumulation. Aging Male. 2020;23(5):1158–1164.
- Futterer JJ, Briganti A, De Visschere P, et al. Can clinically significant prostate cancer be detected with multiparametric magnetic resonance imaging? A systematic review of the literature. Eur Urol. 2015;68(6):1045–1053.