
 ?Mathematical formulae have been encoded as MathML and are displayed in this HTML version using MathJax in order to improve their display. Uncheck the box to turn MathJax off. This feature requires Javascript. Click on a formula to zoom.
Abstract
Objective
To investigate the practical value of the transrectal two-dimensional shear-wave elastography (SWE) in benign prostatic hyperplasia (BPH).
Methods
Consecutive male participants with and without BPH constituted the BPH and control group respectively were enrolled prospectively between March and December 2022. Transrectal conventional ultrasound and SWE examinations for the prostate were performed on these participants. Data of quantitative stiffness of the transitional zone (TZ) and peripheral zone (PZ) of prostate, volume of prostate (VP) and volume of TZ (VTZ) and prostate specific androgen (PSA), etc., were collected. Linear regression analyses were used to investigate the associations between quantitative stiffness data and other clinical parameters.
Results
There were 200 participants evaluated, including 100 healthy participants and 100 BPH patients. For every one-year increment in age, it was correlated with 0.50 kPa increasement of TZ stiffness. VP and VTZ were correlated with TZ stiffness. Higher TZ stiffness was associated with higher free prostate specific antigen (PSA) and total PSA.
Conclusions
The prostate is stiffer and larger in BPH group compared to control group. Quantitative stiffness of the TZ was related with age, VP, VTZ and PSA.
Introduction
Benign prostatic hyperplasia (BPH) is a histological diagnosis, which refers to the hyperplasia of glandular epithelium, smooth muscle and connective tissue in the transitional zone (TZ) of the prostate, which can cause increased prostate stiffness [Citation1]. BPH is very prevalent in older men. The worldwide incidence of BPH at autopsy increases from 40–45 years old, to 60% by age 60 and 80% by age 80 [Citation2]. BPH can be asymptomatic and no treatment is required for this group of patients. However, BPH can lead to benign prostatic enlargement (BPE) which can block the bladder neck and cause lower urinary tract symptoms (LUTS), and is the main concern for aging males [Citation3].
Histopathological diagnosis is still the gold standard for BPH. Surgery or biopsy was needed in order to acquire specimens. Ultrasound was introduced in the evaluation of BPH for decades, and it has been utilized commonly. Transrectal ultrasound elastography is an imaging technology sensitive to tissue stiffness that was first described in the 1990s and is widely used in the clinical practice of multiple diseases including depicting prostate cancer and guiding prostate biopsy [Citation4–8]. However, most of these studies used quasi-static (strain) elastography that is limited by its lack of standardization and operator dependency and by the fact that it cannot provide quantitative elasticity data.
Shear-wave elastography (SWE) is a new technique that employs a dynamic stress to generate shear waves in the parallel or perpendicular dimensions [Citation9–11]. The finding of the stiffness of prostate in BPH patients measured by SWE has not previously been well established in the literature [Citation5, Citation6, Citation12–15]. This may be associated with the age, prostate volume, and prostate specific antigen (PSA) levels. The purpose of this prospective study was to investigate the practical value of the transrectal SWE in BPH, which may aid in determining the optimal treatment strategy for the BPH patient.
Materials and methods
Study participants
Between March 2022 and December 2022, consecutive male participants were included, who constituted the BPH and control group respectively. Inclusion criteria of BPH group in our analysis were (a) about to undergo PSA measurement, (b) scheduled for partial prostatectomy, (c) older than 18 years old. Inclusion criteria of control group in our analysis were (a) about to undergo PSA measurement, (b) without related urinary system diseases, (c) older than 18 years old. Exclusion criteria of BPH group in our analysis were (a) diagnosed with prostate cancer, (b) with the history of partial prostatectomy, (c) inapplicability for SWE examination because of archostenosis, (d) unreliable measurement results of SWE. Exclusion criteria of control group in our analysis were (a) diagnosed with BPH, (b) with the history of partial prostatectomy, (c) inapplicability for SWE examination because of archostenosis, (d) unreliable measurement results of SWE. This prospective study was implemented after receiving Ethics Committee approval. All the participants gave written informed consent before inclusion in this prospective institutional review board-approved monocentric study.
Image acquisition
All the participants underwent transrectal conventional ultrasound and SWE examinations. Examinations were performed with an Aixplorer scanner (SuperSonic Imagine, Aix-en-Provence, France) using a SE12-3 transrectal transducer by two sonographers (X.H.Z., with 10 years of conventional ultrasound experience, and D.M.C., with 20 years of SWE experience).
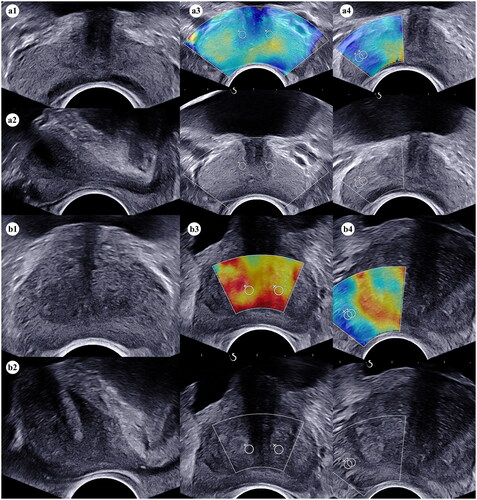
The participants were examined in the left decubitus position. Grey-scale and Dopper’s images were obtained in the axial and sagittal planes and SWE images were acquired in the axial plane (). Optimized settings (maximized penetration, elasticity scale set to 70 kPa) were used as recommended by the manufacturer. The sampling diameter was set to 3.00 mm and the sampling depth was set to 1.5 cm for each examination in SWE. The regions of interest (ROIs) were placed in the transitional zone (TZ) and peripheral zone (PZ) of the medium prostate gland respectively. Measurements were made near the urethra excluded calcified areas. During the SWE examination, the sonographer was asked to keep the probe in a steady-state position for a few seconds until stabilization of the color map and to put as minimal pressure as possible on the prostate through the transducer, to avoid creating artificial areas of increased stiffness in the gland.
Figure 1. The process of volume and stiffness measurements of the prostate for the BPH and control group. (a1) The transverse diameter and anteroposterior diameter of the prostate and the TZ were measured respectively in the axial plane by grey-scale ultrasound in the control group; (a2) the cephalocaudal diameter of the prostate and the TZ were measured respectively in the sagittal plane by grey-scale ultrasound in the control group; (a3) Quantitative stiffness data of the TZ in the middle part of prostate near the urethra were measured twice in the axial plane by SWE in the control group; (a4) Quantitative stiffness data of the PZ in the right lobe of prostate were measured twice in the axial plane by SWE in the control group; (b1) The transverse diameter and anteroposterior diameter of the prostate and the TZ were measured respectively in the axial plane by grey-scale ultrasound in the BPH group; (b2) the cephalocaudal diameter of the prostate and the TZ were measured respectively in the sagittal plane by grey-scale ultrasound in the BPH group; (b3) Quantitative stiffness data of the TZ in the middle part of prostate near the urethra were measured twice in the axial plane by SWE in the BPH group; (b4) Quantitative stiffness data of the PZ in the right lobe of prostate were measured twice in the axial plane by SWE in the BPH group. Abbreviations: BPH, benign prostatic hyperplasia; TZ, transitional zone; PZ, peripheral zone; SWE, shear-wave elastography.
Volume measurement
Volume of the prostate (VP) and volume of the TZ (VTZ) were measured by means of gray-scale ultrasound. In the axial plane, the transverse diameter and anteroposterior diameter of the prostate and the TZ were measured respectively, and in the sagittal plane, the cephalocaudal diameter of the prostate and the TZ were measured respectively (). VP and VTZ were calculated using the following formula: × (transverse diameter × anteroposterior diameter × cephalocaudal diameter) [Citation16].
Stiffness measurement
The ROI placed on grey-scale image was automatically reported on the corresponding elastogram by the ultrasound system software. The scanner measured the velocity (c) of shear waves and calculated Young’s modulus (E) using the equation where the density of tissue was assumed to be
[Citation9, Citation10]. The average Young’s modulus was calculated within each ROI and displayed on the screen. Quantitative stiffness data of the TZ and PZ were measured in the left and right lobe of the prostate respectively (). Each value was measured twice and the mean was used in the study.
Statistical analysis
EmpowerStats (version 4.0, Wuhan Yi’er Technology Co. Ltd, Wuhan, Hubei, China) and GraphPad Prism (version 8.0, GraphPad Software, San Diego, CA, USA) were used for the statistical analysis. We assessed the distribution of baseline characteristics with a two-sample t-test and a chi‐square test to compare continuous and categorical variables, respectively. Continuous variables of non-normal distributions were presented as median (IQR: Q1-Q3). The relation between the parameters was analyzed with the identity activation function, and a trend test was used to analyze the linearity of effects. A two-sided p <.05 was set as the significance threshold and all interval estimations given in this paper were 95% confidence intervals (CI).
Results
Participant characteristics
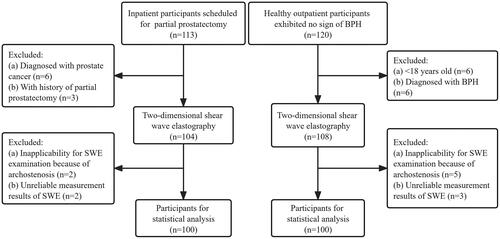
The study flowchart is presented in . Between March 2022 and December 2022, 113 consecutive inpatient participants who received transurethral laser vaporization of prostate or transurethral holmium laser enucleation of prostate and constituted the BPH group, and 120 consecutive healthy outpatient participants who exhibited no sign of BPH and constituted the control group, were enrolled in this study. Among the BPH group, 6 participants were excluded because of prostate cancer, 3 participants were excluded because of the history of partial prostatectomy, and 2 participants were excluded from SWE examination because of archostenosis. Among the control group, 6 participants were excluded from the statistics due to age (<18 years old), 6 participants were excluded due to BPH, and 5 participants were excluded from SWE examination due to archostenosis. SWE measurement results were collected in all participants, but 5 were excluded from the statistical analysis due to unreliable values. Ultimately, 200 participants were selected for the final analysis. There were 100 participants confirmed to be BPH by histopathology and 100 healthy participants without BPH.
Figure 2. Flowchart illustrates the study participants selection process. Abbreviations: BPH, benign prostatic hyperplasia; SWE, shear-wave elastography.
The baseline features of these participants are presented in . The median age is 68.50 (54.00–94.00) and 36.00 (21.00–58.00) in BPH and control group respectively (p <.01). TZ stiffness of BPH group is higher than that of control group [TZ1 stiffnessmean 42.25 (21.30–121.70) vs 24.55 (4.80–48.60) and TZ2 stiffnessmean 40.95 (17.80–127.80) vs 26.35 (3.90–41.00), both p <.001] (). VP and VTZ in BPH group were both higher than control group [VP 80.90 (5.66–204.91) vs 19.82 (10.18–32.41) and VTZ 43.27 (1.83–151.87) vs 2.85 (0.51–8.52), both p <.001]. Other baseline data are tabulated in .
Figure 3. Difference of elastosonographic appearance under SWE for the BPH and control group. (a) Comparison of elastosonographic appearance in the transitional zone of prostate (P <.001); (b) Comparison of elastosonographic appearance in the peripheral zone of prostate (P =.728). Abbreviations: SWE, shear-wave elastography; BPH, benign prostatic hyperplasia.
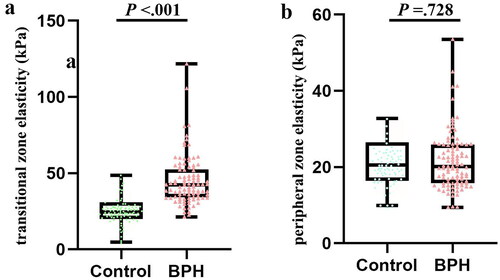
Table 1. Characteristics of participants enrolled.
Relationships between age, VP, VTZ, PSA and TZ stiffness
We tried to reveal the potent correlations between TZ stiffness and other parameters. Firstly, we found that for every one-year increment in age, it was correlated with 0.50 (95% CI: 0.31–0.69) kPa increasement of TZ stiffness (p <.001). After a linear examination, the relationship was proved to be linear (Pfor linearity <.01) ().
Table 2. Association between transitional zone stiffness and age.
Next, we wanted to detect the association between VP and the change of TZ stiffness. According to the results of the regression models, larger prostate (higher VP) was correlated with increased TZ stiffness (β: 0.14, 95% CI: 0.07–0.21, p <.001) and larger VTZ was also correlated with similar change of TZ stiffness (β: 0.13, 95% CI: 0.04–0.23, p <.01). The effect between VP and TZ stiffness was proved to be of linearity in the curve fitting and trend test (Pfor linearity <.01). In the study of the correlation between the VTZ and TZ stiffness, there was a breakpoint (VTZ = 12.62 ml) in the curve fitting. When VTZ < 12.62 ml, there was a significant positive correlation (β: 1.76, 95% CI: 0.81–2.72, p <.001). However, when VTZ > 12.62 ml, there was no significant difference statistically in this relationship (β: 0.03, 95% CI: −0.08–0.14, p >.05) ().
Table 3. Association between transitional zone stiffness and VP/VTZ.
Then, we analyzed the association between PSA and TZ stiffness. With the increment of TZ stiffness, the value of free prostate specific antigen (fPSA) (β: 0.02, 95% CI: 0.01–0.04, p <.01) and total prostate specific antigen (TPSA) (β: 0.16, 95% CI: 0.06–0.27, p <.01) raised as well. However, there was no correlation between the ratio of free to total PSA (f/T) and TZ stiffness (p >.05). In curve fitting, significant linear positive correlations between TZ stiffness and both TPSA and fPSA were found, which were confirmed by trend tests (both Pfor linearity <.05) ().
Table 4. Association between transitional zone stiffness and fPSA/TPSA.
Discussion
As multiple forces including tension, compression, and shear force existed in tissues of all species, these forces could be summarized as tissue stiffness and was further modified in disease procedures like fibrosis, calcification and cancers, etc. [Citation17, Citation18]. Conventional ultrasound is an inexpensive, noninvasive and versatile clinical imaging modality [Citation4]. Transrectal ultrasound elastography provided us with a noninvasive approach to learn the stiffness of tissues since its first appearance in clinical practice in 1990s [Citation4, Citation19]. The utilization of elastography presented us with the changed stiffness of tissues under diverse pathological circumstances [Citation10]. Ultrasound elastography included strain imaging and shear wave imaging, etc., which was used widely such as the assessment of the degree of liver fibrosis, the benign or malignant nodules of breast and thyroid. In our study, the stiffness in the transitional zone was associated with age (p <.001), volume of prostate (p <.001) and volume of transitional zone (p = .008), free prostate specific antigen (p = .002) and total prostate specific antigen (p = .003) in patients with BPH.
The practical value of SWE in the detection and treatment procedure of prostate cancers has been reported in a large number of studies. Several previous studies had demonstrated high sensitivity and specificity in the biopsy of prostate and indicated great difference between malignant sites and benign tissues [Citation5, Citation6, Citation13, Citation20–23]. Besides, Porsch et al. [Citation24] also reported a strong correlation between prostate stiffness and Gleason Score of prostate cancer, which indicated a potent predictive value of SWE. Based on the high sensitivity and specificity of SWE in the detection of prostate cancer, histotripsy was introduced into the therapy of prostate cancer [Citation25].
Although widely used in the diagnosis of prostate cancer, utilization of SWE was limited in BPH. As shown in previous studies, the stiffness value of prostate cancer sites was higher than benign sites, and as acknowledged to all, BPH coexisted with most prostate cancer patients [Citation6]. Based on these findings, we tried to investigate a similar trend in the comparison of BPH and normal prostate. We compared the stiffness of prostate between BPH patients and volunteers of normal prostate and found significant higher TZ stiffness in the BPH group than control group for the first time. This finding may guide our future clinical and laboratory research to another dimension. In a previous study conducted by Zhang et al. [Citation26] in 2013, 55 BPH patients were enrolled in their investigation, and they found that prostate stiffness was related with severity of bladder outlet obstruction for these patients. However, they failed to compare the difference with male without BPH.
We found aging was related with a gradual increase in TZ stiffness. BPH was promoted by aging and androgen, it occurs along with the rise of age [Citation27]. According to the theory described previously, tissue stiffness elevated in pathological situations, it also took a long time for a normal prostate to become BPH and this process was gradual [Citation17, Citation18, Citation28]. Symptoms of BPH may not occur in every elder male, but pathological BPH and enlarged prostate could be confirmed in almost all of them. We firstly found this changing trend in our study; however, due to the limitation of the group size, this proposal should be further proved in a larger cohort study consisted of participants of more comprehensive age group.
We found enlarged size of prostate was also related with higher stiffness of prostate. Some previous studies reported similar or related findings, they found different elastosonographic features in patients with normal prostate, enlarged prostate, BPH and prostate cancer [Citation29]. Significant stiffer elasticity could be observed in larger prostate than those of normal size in their reports. We not only revealed this phenomenon but quantified this difference and proved a linear association between prostate volume and TZ stiffness. Other than that, we further investigate more detailed parameter–TZ volume, found that it also had a strong linear relationship with TZ stiffness.
PSA is a classical widely used prostate cancer screening biomarker. Its value was affected by various prostatic diseases like inflammation and cancers, etc. In our research, we observed linear positive correlations between TZ stiffness and serum PSA value (both fPSA and TPSA). As previously proposed by other studies, prostate tissue stiffness was related with prostate cancer and some cancer-related parameters (PSA value and Gleason Score, etc.). Combination of tissue stiffness and PSA may be a potent monitoring method for the prostate diseases.
Although our study proposed several opinions on the clinical practice of SWE in BPH, some limitations still exist. First, the cohort size is still limited, we are continuing this study and expand the cohort to address this problem. Second, the detection zone was restricted as a result of the nature of SWE technique, we may acquire more regions of interest to reflect the stiffness of prostate better. Third, the underlying mechanism of tissue stiffness changes of BPH is still unclear, further laboratorial and pathological experiments were ongoing to make this clear.
Conclusions
This study firstly compared the elastosonographic characteristics of BPH patients and healthy volunteers, the prostate is stiffer and larger in patients with BPH compared to healthy volunteers. We further found that the increasement of TZ stiffness was correlated with age, prostate size as well as TZ volume, and serum fPSA and TPSA value. All these results indicated transrectal SWE processes the practical value in the clinical practice of BPH. For example, SWE measurements can be used to distinguish between healthy men and BPH patients who require surgery. In the future, based on the research results, a grading standard for the severity of prostate enlargement condition could be established, with the aim of guiding the treatment options (surgical or medical) for BPH patients. The conclusion needs to be verified in further studies with prospective, multicenter designs and larger numbers of participants.
Ethical approval
The study was initiated after obtaining approval from the local ethics committee (West China Hospital, Sichuan University, number and date: 1811/20.01.2022). All procedures performed in studies involving human participants were in accordance with the ethical standards of the institutional and national research committee and with the 1964 Helsinki declaration and its later amendments or comparable ethical standards. All the participants gave written informed consent before inclusion in this prospective institutional review board-approved monocentric study.
Authors’ contributions
XHZ participated in the design of the trial, acquired the data, drafted and revised the manuscript. ZYC designed the study, interpreted and analyzed the data, and drafted the manuscript. JY conducted the data acquisition and contributed to the study materials. QL and LRL pointed out deficiencies and ameliorated the manuscript. DMC participated in the design of the trial, guided the directions, and revised the manuscript. All authors read and approved the final manuscript.
Disclosure statement
No potential conflict of interest was reported by the authors.
Data availability statement
The data that support the findings of this study are available from the corresponding author upon reasonable request.
Additional information
Funding
References
- Auffenberg GB, Helfand BT, McVary KT. Established medical therapy for benign prostatic hyperplasia. Urol Clin North Am. 2009;36(4):443–459. doi: 10.1016/j.ucl.2009.07.004.
- Wei JT, Calhoun E, Jacobsen SJ. Urologic diseases in America project: benign prostatic hyperplasia. J Urol. 2005;173(4):1256–1261. doi: 10.1097/01.ju.0000155709.37840.fe.
- Abrams P, Chapple C, Khoury S, et al. Evaluation and treatment of lower urinary tract symptoms in older men. J Urol. 2013;189(1 Suppl):S93–S101. doi: 10.1016/j.juro.2012.11.021.
- Sigrist RMS, Liau J, Kaffas AE, et al. Ultrasound elastography: review of techniques and clinical applications. Theranostics. 2017;7(5):1303–1329. doi: 10.7150/thno.18650.
- Correas J-M, Tissier A-M, Khairoune A, et al. Prostate cancer: diagnostic performance of real-time shear-wave elastography. Radiology. 2015;275(1):280–289. doi: 10.1148/radiol.14140567.
- Ahmad S, Cao R, Varghese T, et al. Transrectal quantitative shear wave elastography in the detection and characterisation of prostate cancer. Surg Endosc. 2013;27(9):3280–3287. doi: 10.1007/s00464-013-2906-7.
- van Hove A, Savoie P-H, Maurin C, et al. Comparison of image-guided targeted biopsies versus systematic randomized biopsies in the detection of prostate cancer: a systematic literature review of well-designed studies. World J Urol. 2014;32(4):847–858. doi: 10.1007/s00345-014-1332-3.
- Postema A, Mischi M, De La Rosette J, et al. Multiparametric ultrasound in the detection of prostate cancer: a systematic review. World J Urol. 2015;33(11):1651–1659. doi: 10.1007/s00345-015-1523-6.
- Bercoff J, Tanter M, Fink M. Supersonic shear imaging: a new technique for soft tissue elasticity mapping. IEEE Trans Ultrason Ferroelectr Freq Control. 2004;67(7):1492–1494. doi: 10.1109/tuffc.2004.1295425.
- Shiina T, Nightingale KR, Palmeri ML, et al. WFUMB guidelines and recommendations for clinical use of ultrasound elastography: part 1: basic principles and terminology. Ultrasound Med Biol. 2015;41(5):1126–1147. doi: 10.1016/j.ultrasmedbio.2015.03.009.
- Franchi-Abella S, Elie C, Correas JM. Ultrasound elastography: advantages, limitations and artefacts of the different techniques from a study on a phantom. Diagn Interv Imaging. 2013;94(5):497–501. doi: 10.1016/j.diii.2013.01.024.
- Zheng, XZ, Ji, P, Mao, HW, et al. A novel approach to assessing changes in prostate stiffness with age using virtual touch tissue quantification. J Ultrasound Med. 2011;30(3):387–390. doi: 10.7863/jum.2011.30.3.387.
- Barr RG, Memo R, Schaub CR. Shear wave ultrasound elastography of the prostate: initial results. Ultrasound Q. 2012;28(1):13–20. doi: 10.1097/RUQ.0b013e318249f594.
- Woo S, Kim SY, Cho JY, et al. Shear wave elastography for detection of prostate cancer: a preliminary study. Korean J Radiol. 2014;15(3):346–355. doi: 10.3348/kjr.2014.15.3.346.
- Woo S, Kim SY, Lee MS, et al. Shear wave elastography assessment in the prostate: an intraobserver reproducibility study. Clin Imaging. 2015;39(3):484–487. doi: 10.1016/j.clinimag.2014.11.013.
- Wolff JM, Boeckmann W, Mattelaer P, et al. Determination of prostate gland volume by transrectal ultrasound: correlation with radical prostatectomy specimens. Eur Urol. 1995;28(1):10–12. doi: 10.1159/000475012.
- Chakraborty M, Chu K, Shrestha A, et al. Mechanical stiffness controls dendritic cell metabolism and function. Cell Rep. 2021;34(2):108609. doi: 10.1016/j.celrep.2020.108609.
- Cox TR, Erler JT. Remodeling and homeostasis of the extracellular matrix: implications for fibrotic diseases and cancer. Dis Model Mech. 2011;4(2):165–178. doi: 10.1242/dmm.004077.
- Gennisson JL, Deffieux T, Fink M, et al. Ultrasound elastography: principles and techniques. Diagn Interv Imaging. 2013;94(5):487–495. doi: 10.1016/j.diii.2013.01.022.
- Correas J-M, Halpern EJ, Barr RG, et al. Advanced ultrasound in the diagnosis of prostate cancer. World J Urol. 2020;39(3):661–676. doi: 10.1007/s00345-020-03193-0.
- Boehm K, Salomon G, Beyer B, et al. Shear wave elastography for localization of prostate cancer lesions and assessment of elasticity thresholds: implications for targeted biopsies and active surveillance protocols. J Urol. 2015;194(4):1167–1800. doi: 10.1016/j.juro.2014.09.100.
- Sang L, Wang XM, Xu DY, et al. Accuracy of shear wave elastography for the diagnosis of prostate cancer: a meta-analysis. Sci Rep. 2017;7(1):1949. doi: 10.1038/s41598-017-02187-0.
- Gandhi J, Zaidi S, Shah J, et al. The evolving role of shear wave elastography in the diagnosis and treatment of prostate cancer. Ultrasound Q. 2018;34(4):245–249. doi: 10.1097/RUQ.0000000000000385.
- Porsch M, Wendler JJ, Liehr U-B, et al. New aspects in shear-wave elastography of prostate cancer. J Ultrason. 2015;15(60):5–14. doi: 10.15557/JoU.2015.0001.
- Wang TY, Hall TL, Xu Z, et al. Imaging feedback of histotripsy treatments using ultrasound shear wave elastography. IEEE Trans Ultrason Ferroelectr Freq Control. 2012;59(6):1167–1181. doi: 10.1109/tuffc.2012.2307.
- Zhang M, Fu S, Zhang Y, et al. Elastic modulus of the prostate: a new non-invasive feature to diagnose bladder outlet obstruction in patients with benign prostatic hyperplasia. Ultrasound Med Biol. 2014;40(7):1408–1413. doi: 10.1016/j.ultrasmedbio.2013.10.012.
- Dornbier R, Pahouja G, Branch J, et al. The new American urological association benign prostatic hyperplasia clinical guidelines: 2019 update. Curr Urol Rep. 2020;21(9):32. doi: 10.1007/s11934-020-00985-0.
- Bonnans C, Chou J, Werb Z. Remodelling the extracellular matrix in development and disease. Nat Rev Mol Cell Biol. 2014;15(12):786–801. doi: 10.1038/nrm3904.
- Dudea SM, Giurgiu CR, Dumitriu D, et al. Value of ultrasound elastography in the diagnosis and management of prostate carcinoma. Med Ultrason. 2011;13(1):45–53.