
ABSTRACT
Rapidly expanding mobile network coverage in developing countries offers new ways to reach poor farmers in isolated places. This article explores the potential for Information and Communication Technology to provide agricultural information and extension services to smallholder farmers, and links this to empirical insights of an intervention in Uganda, where community knowledge workers rely on mobile devices to deliver context- and time-sensitive data to farmers. Consistent with theoretical insights related to information inefficiencies, we find that the intervention leads farmers to move away from low-risk low-return crops toward more commercially oriented commodities. Our analysis also suggests that, for the case of maize, the intervention causes farmers to sell less on the market, but at significantly higher prices.
Introduction
The use of Information and Communication Technology (ICT) for development has attracted considerable attention in development policy and research (Aker & Mbiti, Citation2010; Jensen, Citation2010). There are different reasons as to why expectations are high. Mobile phone networks, and with it mobile phone-based services such as mobile money, are expanding extremely fast in developing countries. Large transaction costs due to, for example, poor road infrastructure give mobile-based technology a competitive edge. Portable devices are also well adapted to situations where power supply is erratic. Increasingly, both private and public initiatives start to use this infrastructure to provide services to their clients.
Within this context, the Grameen Foundation, a global nonprofit organization, initiated an innovative project to deliver agricultural extension and marketing information to smallholder farmers in Uganda. They equipped locally recruited villagers (referred to as community knowledge workers (CKWs)) with an Android smartphone, pre-loaded with an in-house developed mobile application. CKWs can use this ‘app’ to search for up-to-date and location-sensitive information related to farming and commodity marketing. In this way, the Grameen Foundation aims to build a scalable network of resident rural information providers who use smartphones to help close critical information gaps faced by smallholder farmers.
In this article, we explain how ICT-based initiatives such as the CKW project impact upon the livelihoods of small-scale farmers in developing countries. To do so, we first describe the particular challenges smallholder farmers face by drawing on the theory of information inefficiencies, and explain how ICTs can address some of the issues. We then present an empirical assessment of the causal impact of the CKW intervention, which was designed to mitigate some of the information inefficiencies among smallholder farmers in Uganda. Consistent with the theory, our findings suggest that the CKW initiative led to a change in the crops that farmers grow, shifting to more risky but rewarding crops. Our analysis also suggests that equipping farmers with actionable marketing information is associated with an average increase in the price at which farmers sell maize of about 12%. The analysis also suggests important spillover effects. We do not find an effect on maize productivity.
The article is organized as follows. The next section presents the theory in which the CKW model is grounded, and reviews the literature on the impact of other ICT-based interventions that use a similar rationale. We then present the CKW model, explain the identification strategy and describe the project area and data used. Next, we present the results and discuss them in the light of our theoretical framework. A final section concludes.
The potential of ICTs to remove information inefficiencies
On the face of it, much of the observed behavior of smallholder farmers in developing countries is difficult to comprehend using standard economic theory. For instance, textbook economics would predict that farmers specialize in the crops in which they have a comparative advantage, which is at odds with the observation that most smallholders have similar, yet diversified crop portfolios. In addition, it has been noted that farmers often respond to price signals in ways that differ from those predicted using standard micro-economic demand and supply analysis (de Janvry, Fafchamps, & Sadoulet, Citation1991). Despite low levels of agricultural productivity, many studies find a reluctance in the adoption of profitable productivity-enhancing technologies. However, Schultz (Citation1964) notes that, given the constraints these farmers face and the environment in which these farmers operate, farmers are surprisingly efficient. Subsequent work on agricultural household models that explicitly accounts for the dual role of farm households as both producers and consumers of often the same consumables and production factors has led to a substantial literature that is able to explain smallholder behavior as a rational response to missing, incomplete or inefficient markets (Singh, Squire, & Strauss, Citation1986).
We focus on four stylized characteristics of smallholder farming behavior that are important constraints to more general economic development: crop portfolios that are skewed to low-risk low-return crops, low prices accepted by farmers for their produce, under-adoption of improved agricultural technologies and low levels of market participation. In this section, we will discuss each of these factors in turn, explaining the theory pertaining to the causes and consequences of this behavior, reflecting on how ICTs may affect these causes and consequences, and reviewing the evidence so far on the effectiveness of ICTs to change this behavior.
Crop choice, risk and ICT
Smallholder farmers engage in activities of an inherently risky nature. Income derived from agriculture is dependent on climatic events. In addition, in many developing countries farmers have to cope with policy shocks (Dercon, Citation2002). Farmers also tend to live in disease-prone environments, affecting both labor and livestock. Smallholder farmers also face considerable price uncertainty, exacerbated by shallow markets and high seasonality (Van Campenhout, Lecoutere, & D’Exelle, Citation2015). With formal insurance lacking, farmers have to rely on informal ways to protect themselves against downside risk. Risk sharing is difficult due to the covariance of risk in agricultural societies and so most farmers rely on self-insurance.
One such self-insurance risk management strategy is through the composition of the crop portfolio. Dercon (Citation2002) notes that a common strategy for households is to alter the income risk they face through diversifying their income sources. Since agriculture is the main source of income for smallholder farmers, this behavior is replicated at the crop choice level. In addition, there is generally a positive relationship between returns to a crop and its riskiness, resulting in some degree of income skewing among the poorest, where poor farmers specialize in low-risk low-return activities (Dar, de Janvry, Emerick, Raitzer, & Sadoulet, Citation2013). For instance, Dercon (Citation1996) finds poor Tanzanian households grow proportionally more sweet potatoes, a typical low-return low-risk crop.
However, crop choice cannot be viewed independently from other risk management or risk-coping activities. For example, if a household has built up sufficient liquid assets to cope with the consequences of risk ex-post, households may be able to take on more risky activities with a higher expected return. The intricate relationship between different risk management strategies means that changes in the crop portfolio will depend on other options available to farmers to better manage ex-ante risk. This suggests a range of solutions to pull poor farmers out of their low-risk low-return cropping patterns.
Offering formal insurance, such as index-based weather insurance, is likely to encourage farmers to shift into more risky activities (Karlan Osei, Osei-Akoto, & Udry, Citation2014). Credit is also assumed to be an important risk management strategy, increasing households’ ability to shift into riskier forms of agriculture (Eswaran & Kotwal, Citation1989; Udry, Citation1990). Precautionary savings have also been found to have a direct effect on crop choice as a risk management strategy (Dercon, Citation1996). Income diversification into activities in which returns are uncorrelated with returns to agricultural activities also influences a household’s ability to deal with risk. Investments in risk-reducing technology and infrastructure, both at the individual and at the more aggregate level, are likely to affect optimal crop allocation. Examples are better storage technologies at the farm level (Ricker-Gilbert & Jones, Citation2015), or better feeder roads at the more aggregate level (Dorosh, Wang, You, & Schmidt, Citation2012).
One can think of various ways in which ICTs can alter the above ex-ante risk management strategies available to households. ICTs may facilitate access to agricultural knowledge and best practice through call centers or information presented online. Foster and Rosenzweig (Citation2010) model technology adoption through extension, and show how learning can reduce uncertainty about the profitability of a new technology. Access to price information in other markets, as well as contact information of traders and agro-processors, is likely to substantially reduce price risk. Weather forecasts will also affect the (perceived) riskiness of crops. ICTs may also make risk coping through sale of assets more effective. When common shocks occur, many households may decide to sell off assets at the same time, leading to a collapse of the market. This negative correlation between food prices and asset prices greatly reduces the effectiveness of savings as a risk management strategy (Dercon, Citation2002). Providing information of markets in regions not affected by the shock may prompt arbitrage, attenuating the price movements and correlation (Van Campenhout, Citation2007).
Prices, bargaining power and ICT
Farmers located in rural areas often receive very low prices for the crops they sell (Stifel & Minten, Citation2008). This is partly because these farmers are often poorly informed about prevailing market prices of the crops they produce (Fafchamps & Hill, Citation2008). In fact, most of the trading involves a bilateral bargaining process, which may result in prices that differ significantly from prevailing market prices. Furthermore, rural markets, where most of the production happens, are often only weakly integrated with urban consumption markets, and high transaction costs of moving crops from supply areas to consumer centers mean prices in towns are often substantially higher.
ICTs provide a suitable platform to disseminate location- and time-specific price information. Such information would enable farmers to engage in spatial arbitrage. The reduction in search costs means that farmers can now choose among a larger set of markets and sell their product in the market where demand is highest and supply lowest, resulting in a better price (net of additional transaction costs incurred) than the one he or she would obtain if he or she would just sell in the nearest market. Jensen (Citation2010) notes that such a process of arbitrage has welfare effects beyond those farmers that engage in arbitrage, generating higher prices for producers and lower prices for consumers.
Price information may also affect the distribution of welfare among agents. In most cases, farmers do not sell directly to consumers. Agricultural commodity value chains typically include assembly traders, brokers, wholesalers, retailers and agro-processors. Along this chain, it is likely that barriers to entry exist, leading to localized monopsonies. This may result in lower prices for farmers. The ability of ICTs to reduce search costs effectively increases the amount of competition between actors along the value chain. In addition, empowering the farmer with price information at different points along the value chain increases the bargaining power of the farmer. Often, the mere threat of doing so will be sufficient to make middlemen increase their reservation price.
There are a number of studies that investigate the effect of ICT on overall market efficiency and arbitrage. Jensen (Citation2007) finds that the introduction of cell phones in Indian fishing communities reduces price dispersion between markets and eliminates waste, consistent with increased spatial arbitrage. Aker (Citation2010) finds that the introduction of mobile phones increases grain market integration in Niger, while Aker and Fafchamps (Citation2015) find that producer price dispersion decreases after the introduction of mobile phones, but only for perishable crops. There are also quite a number of studies on the effect of ICT use for price information provision on surplus sharing. Svensson and Yanagizawa (Citation2009) find large effects of price information delivered through radio, resulting in a 15% increase in the price farmers receive. Goyal (Citation2010) looks at the provision of price information using Internet kiosks in the context of Indian soybean growers who sell to traders in wholesale markets. She finds that price information translates to a 1–3% increase in farmer prices. Fafchamps and Minten (Citation2012) investigate the impact of an SMS-based price dissemination service in India and find no effect on the price reportedly received. Courtois and Subervie (Citation2015) find that price information disseminated though the well-known eSoko project resulted in a 10% increase in the price of maize and 8% increase in the price of groundnuts in Northern Ghana. Futch and McIntosh (Citation2009) do not find price effects resulting from the introduction of mobile phones in Rwanda.
Technology adoption, knowledge gaps and ICT
Another characteristic of smallholder farmers is the under-adoption of yield-increasing investments amid low and stagnating agricultural yields, despite the fact that these investments seem to be highly profitable (Duflo, Kremer, & Robinson, Citation2008). Experts believe a lack of knowledge about (improved) crops and farming techniques is an important constraint. It is argued that if this knowledge gap can be narrowed through agricultural extension, this may lead to significant improvements in rural welfare.
We see different areas where ICTs may outperform traditional extension services. One of the main threats to sustainability of agricultural extension services is high recurrent costs (Quizon, Feder, & Murgai, Citation2001), and mobile technology provides a cost-effective way to transfer information to remote locations (Nakasone, Torero, & Minten, Citation2014). Anderson and Feder (Citation2004) mention that timeliness of information is also key to the success of extension systems. Again, ICTs may be particularly suited to disseminate reminders at particular points in time through, for example, SMSs. But also access to consumer markets is important for the sustainability of improved technology adopted through agricultural extension, as in better integrated markets, returns to increased output diminish less rapidly than in locally segmented markets characterized by more price inelastic demand (Gabre-Madhin, Barrett, & Dorosh, Citation2002). The use of ICTs to obtain price information mentioned above may thus also affect technology adoption.
There appears to be relatively less ICT-based initiatives that provide information on agricultural practices and inputs, compared to those that disseminate information on prices, weather forecasts, or buyer and seller information. Aker (Citation2011) suggests this may be because such information is more nuanced and difficult to convey. To our knowledge, there are no studies as yet that investigate the effect of extension information delivered through ICTs on agricultural knowledge, practices and outcomes.
Market participation, transaction costs and ICT
Finally, high levels of production for subsistence, or low levels of market participation, are also a hallmark of smallholder farmers in the developing world. This feature can be explained by appreciating the particular nature of farm household models and the context in which they operate. Farm households both produce and consume commodities. Production decisions are made on the basis of profit maximization given available technology, and consumption decisions are made on the basis of utility maximization subject to a budget constraint. If a full set of markets exists, all production factors and consumption items can be traded at a marginal cost, which results in a clear separation between consumption and production. Renkow, Hallstrom, and Karanja (Citation1986) show that, when markets fail, separability breaks down, and consumption decisions may constrain decisions on the production side.Footnote1 de Janvry et al. (Citation1991) explain how transaction costs drive a wedge between prices at which farmers sell and buy, effectively making markets selectively fail for certain products and certain households. The above leads to particular market participation patterns, where some households self-select out of markets (Key, Sadoulet, & de Janvry, Citation2000; Renkow et al., Citation2004).
ICTs can have a substantial impact on market participation patterns by reducing transaction costs. By reducing the price bands, the likeliness that markets fail for particular goods and households reduces. Price information in spatially distinct markets also dramatically reduces search costs as farmers do not have to physically go to other markets to discover the price. Transportation costs are likely to be lower when one can choose between many more transport service providers.
To our knowledge, there is currently only one study that directly looks at the effect of ICTs on market participation. Muto and Yamano (Citation2009) use panel data to investigate if the introduction of cell phone coverage in Uganda increases market participation. They find that after the expansion of coverage, sales of banana in remote communities increased, but not for maize. From this, they conclude that mobile phone coverage expansion seems to induce market participation of farmers in remote areas who produce perishable crops.
The Grameen Foundation’s CKW project in Uganda
The CKW initiative was designed to improve the lives of smallholder farmers by improving access to agriculture-related information and extension, delivered through resident community members. In facilitated sessions, villagers are asked to choose an individual from their community, who they deem suitable to take up the role of a CKW. This person is then screened by Grameen, provided with an Android smartphone and trained on how to use it. The smartphone is preloaded the CKW Search app, which allows CKWs to look up information requested by farmers about farming and crop marketing. These questions range from local weather information over market prices to crop and livestock management.
The CKW Search application was developed in Uganda at Grameen’s Applab and provides information that can broadly be classified into four categories. First, up-to-date prices for different crops in different locations can be requested. Second, three-day weather forecasts, along with seasonal forecasts, can be retrieved. Third, there is an extensive knowledge base on farmer best practices. Finally, the Uganda National Agro-Inputs Dealers’ Association provides information of farm input suppliers across the country that includes their locations down to sub-counties and contact information. There is also an extensive directory of traders, brokers, transporters and agro-processors that can be accessed using the app.
Research methods – difference-in-difference and fixed effects
To investigate if the CKW works as intended, simply comparing outcomes before and after the introduction of a CKW does not suffice. Over time, many other factors may have changed as well, making it impossible to disentangle the effect of the intervention from other factors such as, for instance, the weather. However, comparing outcomes from famers who were exposed to CKWs (henceforth also referred to as the ‘treated’ group) to that of farmers who have not been exposed to CKWs (a ‘control’ group) at one point in time is also not satisfactory: unless the intervention was randomized, chances are that households with particular characteristics have a higher chance of ending up in one of the two groups. For example, it may be that Grameen Foundation tries to optimize the expected benefits of the CKW project by searching for locations that are particularly isolated from the rest of the world. In this case, the treated group is likely to be disadvantaged to begin with. The fact that a particular project will ‘attract’ particular groups is known as selection bias.
We will use a difference-in-difference (DD) estimator, which controls for selection bias by comparing the change in the outcome variable over time in the control group to the change in the outcome variable over time in the treatment group (Angrist & Pischke, Citation2008). In other words, the approach looks at the difference in outcomes between treatment and control, but it accounts for the fact that the outcomes may have been different to begin with. Therefore, the method needs observations on the outcome variable before the intervention (a baseline) and after the intervention (an end line) for both a treated group and a control group. If the treatment group has fared differently over time from the control group, this is interpreted as an impact.
Central to the DD approach is the parallel trend assumption. This assumption states that the group that received the intervention would have followed the same trend over time than the control group if the intervention would not have occurred. While we cannot test this assumption directly, we will increase the credibility of DD in two ways. First, we try to choose a control group that is sufficiently similar to the treatment group by sampling control villages from areas reasonably close to the treatment villages to ensure they are the same in terms of market access, climate, geology, etc. We also statistically test if the treatment and control population differ in a range of characteristics (). Second, we add more time periods to our DD (Angrist & Pischke, Citation2008). In particular, instead of just using one pretreatment baseline, we add a second one. If we find that the difference in outcome for the control group between the first pretreatment and the second pretreatment baseline is not significantly different from the difference in outcome for the treatment group between the first pretreatment and the second pretreatment baseline, we may feel more comfortable with the assumption of a parallel trend.
One of the attractive features of a DD study is that it does not necessitate panel data (Meyer, Citation1995). Since one assumes the potential omitted variable bias works at the treatment level (the treated group versus the non-treated group), one can simply compare the aggregates (e.g. the means or medians of the two groups). This can be done with repeated cross sections, as long as the before and after control groups are comparable. While repeated cross-sections reduce on tracking costs and eliminate the problem of panel attrition, it prevents us from controlling for household-specific time-invariant (potentially unobservable) effects.
Above, we defined the intervention as the mere presence of a CKW at the parish level and selection bias is likely to work mostly at a more aggregate level. However, within the treatment group, we will also look at treatment intensity (i.e. do households that interact more with a CKW have different outcomes from those that interact less), where the selection bias may be situated at the household level. For instance, it may be that certain households are more likely to contact the CKW because of individual-specific characteristics (e.g. a particular farmer likes the stay current on local weather conditions, because his deceased father told him how he lost half of his crop due to an adverse weather shock). To control for this, we will estimate a fixed effects (FE) regression with household-level FEs. It will also be informative to compare the results of a specification that controls for household specific effects to the DD specification, as this will allow us to say something about spillover effects.
Study areas and data sources used
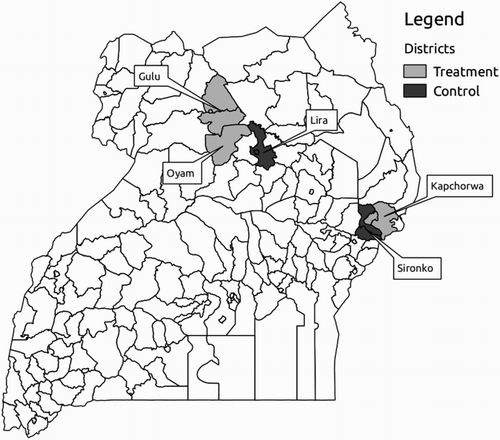
We decided to sample from three districts in Uganda, one in the East and two in the North. In the Eastern region, CKWs were trained and introduced in Kapchorwa district in 2010. Kapchorwa is on the slopes of Mount Elgon, bordering Kenya, but also covers the extensive Kapchorwa plains. In the Northern region, the project started in October 2010 in Gulu district and in December 2010 in neighboring Oyam district. Grameen collected data on a variety of outcomes before the intervention (i.e. data on the 2009/10 agricultural season), and we revisited a random subsample of these households. We revisited 137 households in Kapchorwa and 133 in Gulu and Oyam.
For our DD estimator, we also need information on people who have not been exposed to the intervention. These control districts were selected such that they resemble the population that received a CKW intervention as closely as possible. As one control area, we selected Sironko, a neighboring district that shares the same geology as Kapchorwa. We sampled from Lira district to assemble a control group that resembles as closely as possible that of Gulu and Oyam. The geographical location of the districts is illustrated in the map in . We interviewed 142 households in Lira and 158 households in Sironko.
Figure 1. Sampling areas used.
Unfortunately, the baseline survey Grameen did was only done in the treated population and so we have no baseline data in the control areas. Bamberger (Citation2009) describes different techniques for the reconstruction of baseline data and argues that the use of secondary data drawn from representative household surveys provides the most credible pretreatment counterfactual. The Uganda National Household Survey (UNHS) of 2005/2006 covers more than 6000 households nationwide. It is collected by the Uganda Bureau of Statistics with support from the World Bank. The UNHS interviewed 136 households in Lira and 52 households in Sironko, which we update to 2009/2010 to match the baseline data from the Grameen.Footnote2
To assess the robustness of our findings, we also construct an alternative baseline for which we rely entirely on the UNHS 2005/2006. That is, we also use outcome variables from the UNHS 2005/2006 as the baseline for the districts that were treated (Gulu, Oyam and Kapchorwa), instead of using the data collected by Grameen on the 2009/2010 season. As such, we have a baseline treatment-control sample taken from the UNHS 2005/2006 and an end-line treatment-control sample which we collected ourselves in 2012. We thus end up with three waves of cross-sectional data in both treatment and control areas. Two of these are from before the intervention (one done in 2005/2006 and one done in 2009/2010) and one is from after the intervention (the one documenting the 2011/2012 agricultural season). shows the sample sizes by region, treatment regime and time of the survey.
Table 1. Sample design.
lists some key household characteristics of the farm households that were included in our UNHS baseline survey. For most of the characteristics, there is no significant difference between farm households that will be treated and those that will serve as control groups. Some of these characteristics will also be used in the DD regressions with additional controls below.
Table 2. Means of key variables.
Results
We will now estimate the impact of the CKW intervention on four outcome variables informed by the theoretical framework (crop mix, productivity, marketing and price). We will start by estimating DD models. These models will then be augmented with other control variables to check the robustness of our findings. Finally, we will look at treatment intensity and spillover effects.
Difference in differences
Impact on crop portfolio
We first investigate if the introduction of a CKW in the communities leads to changes in the crops that farmers grow. In order to answer this question for a range of important agricultural commodities, we estimate the change in the percentage of households that report growing a particular crop over time for the households that did receive a CKW. This difference is then contrasted to the change in percentage over time for the sample of farmers that did not receive information and extension from CKWs. These DDs for a range of crops are displayed as bar charts in , with the whiskers indicating the standard errors of the estimates.
Figure 2. Change in proportion of farmers reporting growing crop attributed to community knowledge workers.
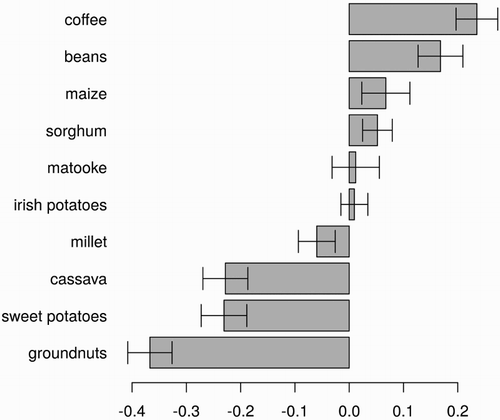
The results suggest that access to information and extension through CKWs leads to a significant increase in the percentage of farmers growing coffee, beans, maize and sorghum. The importance of millet, cassava, sweet potatoes and groundnuts seemed to have declined as a result of the CKW intervention. No statistically significant change in the share of farmers growing matooke and Irish potatoes was observed. The observed pattern suggests a tendency to move away from low-risk low-return crops to more risky but more commercially oriented crops.
It may seem that the increase in the importance of sorghum in the farmer’s crop portfolio runs against the general trend of farmers moving away from low-risk low-return crops to more commercially oriented crops. However, more and more, sorghum is becoming valued as a key ingredient in the commercial production of beer. For instance, in 2003, Uganda’s Nile Breweries, which is owned by SABMiller, the world’s second-largest brewer, introduced Eagle, a beer that is brewed from sorghum (Economist, Citation2003). The weak Ugandan shilling and high excise duties, as well as a new brewing method that avoids the long and costly malting process, give locally sourced sorghum a clear advantage over imported barley. The resulting lager is two-thirds cheaper and closer to the traditional beer Ugandans are accustomed to, reportedly making it a huge success. This development may have increased the commercial value of a traditional food security crop in Uganda in recent years (Ebiyau, Arach, & Serunjogi, Citation2005).
Changes in maize productivity
Secondly, we examine if CKWs have improved maize productivity. To do so, we compare amounts harvested (in kg) per area of cultivation (acres) before and after the intervention, both for a sample of treated farmers and a sample of farmers who make up the control group. The results for our analysis are presented in .
Table 3. The effect of CKW on maize productivity.
The first model in the table only uses end-line data and is presented as a reference. It not only estimates the difference between treated and control farmers in maize productivity, but also controls for location (East or North). We find that farmers in control villages in the North have an average yield of 381 kg per acre. In the East, average productivity is significantly higher, as was expected by the better agro-ecological conditions near Mount Elgon. Here, farmers harvest on average 766.73 kg of maize from one acre. More important, however, is that we also find a significant and positive additional treatment effect: living in a treated area increases maize productivity by 116 kg per acre.
The second model (2) in presents a basic DD model. It regresses the outcome variable (here maize productivity) on a constant, a treatment dummy, an end-line dummy and an interaction term of the treatment and the end-line dummies.Footnote3 The second model differs from the third model only in the choice of the baseline data source. While the second model uses the 2009/2010 agricultural season as the baseline, the third model uses the 2005/2006 agricultural season as the baseline. The results, regardless of what baseline data are used, suggest that the difference in productivity found in model (1) is not caused by the CKW intervention, reflected in the fact that the coefficient on the treatment and end-line interaction dummy is not significantly different from zero. The treated population has, on average, a higher productivity than the control population, irrespective of the timing of the measurement. Depending on what baseline has been used, productivity in the treated group is 86 or 145 kg per acre higher to begin with than productivity in the control group. We do, however, find a significant and positive trend in maize yields if we look at differences over the 2005/2006 to 2011/2012 period. But this increase is general and hence cannot be attributed to the CKW intervention.
The fourth model combines the two different baseline data sets into a DD model with multiple pre-intervention time periods. The dummy variable mid takes the value of one if the observation comes from the 2009/2010 baseline, and zero otherwise. The dummy variable post takes the value of one if the observation comes from the 2011/2012 end line, and zero otherwise. A credible treatment effect would manifest itself through a posttreatment interaction that is significantly different from zero together with a mid-treatment interaction that is not significantly different from zero. However, we find no significant treatment effect for maize productivity. Irrespective of the time period, treated farmers always have a higher average maize productivity than farmers in the control group. Also, while average productivity was significantly higher in both 2009/2010 and in the end-line data compared to the 2005/2006 baseline, these increases are not significantly different between the control and treatment samples.
There may be different reasons why we fail to find a significant effect on maize productivity. First of all, measuring productivity is notoriously difficult. It requires estimates made by the farmer on the area that is planted with maize and the amounts harvested. Both these quantities may be subject to substantial measurement error, reducing precision and making it more difficult to detect a statistical significant effect (Aker, Citation2011). In addition, it will take some time before the impact of extension information is reflected in productivity measures. For example, it may take several years of fertilizer application before soil regains sufficient nutrients and micro-organisms to lead to significantly higher yields. Our end-line survey was done only two years after the intervention.
Changes in share of maize sold
We now ask ourselves if the increased extension and marketing information brought by the CKWs have changed farmers’ participation in the market as suppliers of maize. shows the results for the share of the total harvest that is sold. As in the previous section, the first model compares the post-intervention situation of farmers who have access to a CKW to those who have not, controlling for region. We see that, on average, farmers sell about 38% of the maize they harvest. There seems to be no significant difference between farmers in the North and farmers in the East. In addition, there also seems to be no impact of the CKWs, as the difference between treated and control populations is not significantly different from zero.
Table 4. The effect of CKW on maize on the share of maize harvest sold.
Models (2) and (3) provide estimates for standard DD regressions. As before, model (2) uses 2009/2010 data as the baseline and model (3) the UNHS 2005/2006. We now find a positive common trend. Between the surveys before the intervention and the survey after the intervention, the share of maize sold has increased by 13–20 percentage points, depending on which baseline is chosen. More importantly, we find a significant and negative treatment effect. The presence of a CKW reduces the share of the harvest of maize that is sold in a significant way. There is some indication that the treated population sold a larger share than the control population before the intervention, and that this difference if offset by the intervention.
The final model again looks at all available data in one nested model. We find that there is a significant increase in the share of maize sold over time, but this effect is entirely attributed to the period between 2009/2010 and 2011/2012. In addition, there seems to be evidence of a selection effect, as treated farmers have a significantly higher share of sales. Most importantly, we find again that the CKW intervention reduced the share of the maize harvest sold on the market. As anticipated, the interaction between the indicator for the baseline of 2009/2010 (mid) and treatment status is not significant, making the parallel trend assumption plausible. However, the interaction between the dummy variable indicating the end-line and the treatment status is significantly negative.
The fact that we find a negative treatment effect on maize market participation runs counter to what we expected given the theory. As explained above, the CKW intervention is expected to decrease transaction costs, making market participation (both selling and purchasing) more likely. There are different possible explanations for why we find a negative impact on the share of maize sold. The decision of a particular household to participate in the market for a commodity depends not only on the price band created by the transaction costs, but also on the location of the household-specific shadow price of the commodity (Mather, Boughton, & Jayne, Citation2013). A decrease in the transaction cost may be offset by an increase in the shadow price, due to an outward shift of the household’s demand schedule or an inward shift of the household’s supply. Within the context of household agricultural models, it may be that the CKW intervention relaxes the budget constraint (for instance, through increased marketing of another commodity such as coffee), which may shift the demand curve for maize outward, leading to less market participation. In addition, Renkow (Citation1990) shows how an inventory creates effects that are similar to wealth effects, again likely to shift consumption outward. Such an explanation is consistent with the findings of Muto and Yamano (Citation2009), who find that the introduction of mobiles in Uganda increases market participation for bananas, which is perishable, but not for maize.
Price received for maize sold
Farmers were asked about the highest price they received for maize sold over the last agricultural year. The results of four regression models similar to the ones for maize productivity and shares sold are reported in . The first model again only looks at end-line data. We find that, at the time of the end line in 2011/2012, the average price was about UGX100 higher in the Mount Elgon area than in the North, irrespective of the treatment status. Thus, farmers in the control population received on average UGX513 per kg of maize sold in the North, and UGX613 in the East. We also find a significantly positive effect of the treatment status. Treated farmers received on average about UGX91 per kg of maize more.
Table 5. The effect of CKW on the price received for maize.
Again, models (2) and (3) present DD models to account for possible selection bias in model (1). Model (2), which uses the more recent 2009/2010 baseline data, estimates baseline price levels at about UGX427 per kg of maize. Unsurprisingly, we find that, for all farmers irrespective of the treatment status and location, prices rose significantly between the baseline of 2009/2010 and the end line of 2011/2012. This general maize price inflation of about UGX189 represents a 44% increase. However, on top of this 44% increase, farmers who had access to a CKW received an additional premium of about UGX85, such that the price at which they sold was on average about UGX700. When not interacted, the treatment status is not significantly different from zero, meaning that the allocation of the treatment appears to have been independent of the initial prices farmers received for their maize. Model (3) uses the relatively older baseline constructed from the 2005/2006 UNHS. This fact is reflected in a much lower baseline price level and a much higher absolute general price increase between the baseline and the end line. The conclusions of a significant treatment effect and no selection bias remain the same as in model (2). The CKW premium is slightly lower at about UGX68 per kg.
Model (4) presents the results for the pooled sample, with all three surveys included. The average price of maize in 2005/2006 is estimated to be about UGX218 in the North and about UGX184 in the East. These prices have increased by about UGX208 by 2009/2010 due to general maize price inflation. By 2011/2012, they have increased by about UGX395. There is no significant difference between the treatment and the control group before the intervention. The fact that the interaction between the treatment indicator and the time indicator for the 2009/2010 survey is insignificant lends support to the hypothesis of a parallel trend. We find a significant positive treatment effect as the interaction between the treatment indicator and the dummy indicating the end line shows.
While there is some evidence that market information dissemination does play a role in Uganda (Svensson & Yanagizawa, Citation2009), studies that focus on direct price information dissemination initiatives through mobile phones such as Fafchamps and Minten (Citation2012) often do not find significant effects on prices. The fact that the CKW intervention leads to a more optimistic conclusion than the other studies may be because the CKW model attempts to make information actionable by complementing it with additional information such as a trader directory. For instance, price information is useless if there are no alternatives to the trader the farmer is bargaining with. Additional data suggest that people rely more on price information conveyed by friends, which suggests that the introduction of a CKW raises the credibility of price information that is circulating within communities and social networks. This highlights the public nature of (price) information and may help explain why the CKW model may outperform initiatives that rely on private ownership of mobile phones.
Regression adjusted models
The models presented in the previous sections found no impact from the CKW project on maize productivity, a negative impact on share sold and a positive impact on the price at which farmers sold this maize. However, apart from a dummy indicating survey site (North or East), these models did not allow for other sources of variation in the dependent variables. Therefore, in this section, we control for other variables which may reduce the residual variance. Adding additional controls also investigates the robustness of our treatment effect identified in the previous section to the inclusion of additional household characteristics, such as household size, education of the household head, etc. We add these controls to our preferred specification, which is the DD model that uses the UNHS 2005/2006 as a baseline (i.e. model (3) in the previous sections).
The results of the regression adjusted DD regression are presented in . For instance, model (1) in this table expands model (3) in . Maize productivity, measured as kg harvested per acre, seems to be negatively correlated to the age of the household head. According to expectations, we find that farmers who have less education have significantly lower productivity. The questions on clothes and shoes can be regarded as indicators of well-being; hence, it is expected that they are positively related to productivity. We find indeed that coefficients on both dummies are positive, but for shoes it is not significant. What is most important is that after the inclusion of additional controls, our earlier conclusions remain valid: Maize productivity, for which conditions are more conducive in the east, has increased over time. Productivity is higher in the treatment group, but since this was also the case before the intervention, this higher productivity cannot be attributed to the intervention. There is no effect of the CKW intervention on maize productivity.
Table 6. DD regressions with additional controls.
Model (2) in adds controls to model (3) in . Only one of the added controls seems to be significant. Female-headed households sell a significantly lower share of their maize on the market, a common finding in the literature on smallholder market participation (Mather et al., Citation2013). All other estimates remain similar to the ones found in . In fact, the negative treatment effect seems to become even more important after controlling for household characteristics. Model (3) corresponds to model (3) in . While it is unclear why household size is positively related to the price at which households are able to sell their maize, the effect of the education level of the household head is as expected: heads who have no or only primary education sell their maize at lower prices. Households that report having at least one pair of shoes for each household member report higher prices. Most importantly, controlling for these characteristics does not change our conclusion that the CKW intervention increased the price at which farmers are able to sell their maize.
The remaining three models add two variables to the regressions for share sold and price at which maize is sold. We find no effect on share sold or price from the area of land that is used for growing maize, and the treatment effects remain virtually the same. In the last column, we add the share of the maize harvest sold as an explanatory variable for the price received. We find that farmers who are more engaged in business also receive higher prices. Again, the treatment effect is robust to the inclusion of this variable. The results in show that the impact (or the lack thereof) of the CKW intervention we identify is unlikely to be due to specification issues.
Treatment intensity and spillover effects
investigates if there are additional effects associated to repeated direct, personal interactions with a CKW, over and above the ones found in the preceding sections. In particular, we added the number of interactions each farmer had with a CKW and estimated a FE model. The estimates are not significantly different from zero for any of the outcome variables, signifying that what matters is that one lives in an area served by a CKW, not how often one interacts. This suggests substantial spillover effects. There are different ways in which these effects can come about. Information may be perceived as non-rival and public, and information looked up on the smartphone during a CKW farmer interaction may be shared within the communities very quickly. It may also be that farmers who interact with a CKW are seen as model farmers and their practices are copied by other farmers.
Table 7. Treatment intensity.
The fact that we find effects if we control for selection bias at the treatment level but not at the household level may also provide an explanation why we find an effect of the intervention, and other studies such as Fafchamps and Minten (Citation2012) that evaluate similar interventions do not. Fafchamps and Minten (Citation2012) treat the information as private and randomize at the household level. If, in reality, this price information is shared with the neighbors, there will be spillover of the treatment to the control group. This will result in a smaller difference in the outcome variables between the two groups.
Conclusion
In many developing countries, the majority of households seem to be stuck in subsistence agriculture. Most households produce a mix of predominantly food security crops mainly for own consumption, using rudimentary technology on small plots. At the same time, at least some farmers seem to have engaged in successful crop intensification, using improved seeds and modern inputs such as inorganic fertilizers obtained through the market. These farmers also provide the bulk of agricultural produce to the market. The fact that some farmers seem to be able to transform into successful commercial farmers while other are left behind suggests the existence of market failures.
The literature on agricultural economic development identifies a range of market inefficiencies that may result in some farm households self-selecting into subsistence, such as land and labor market inefficiencies or incomplete credit markets. We argue that ICTs are especially promising in overcoming information inefficiencies, which are special in that they are also likely to affect many of the other market inefficiencies (e.g. output market inefficiencies or risk market inefficacies). In particular, we explain how ICTs can induce farmers to grow more cash crops by reducing risk. We also point out the potential of ICTs in increasing the bargaining power of the smallholder vis-à-vis traders and middlemen. ICTs may also be a powerful vehicle for agricultural extension information delivery to spur technology adoption and increase yields. Finally, we also point out that ICTs are important in reducing transaction costs, affecting smallholder market participation.
The potential of ICTs to lift smallholders out of the subsistence is then illustrated through an empirical investigation of the CKW project of the Grameen Foundation. This innovative project, rolled out in 2010, set out to deliver extension and marketing information to smallholder farmers in rural villages in some districts in Eastern and Northern Uganda. They equipped locally recruited individuals with an Android smartphone. These devices were running a mobile application called ‘CKW search’ that can be used to search up-to-date and location-specific information related to farming and product marketing.
We find that, consistent with the theory, the availability of a CKW in the village of a farmer increases the percentage of farmers who grow high-value crops such as coffee and maize. At the other end of the spectrum, we find that CKW presence reduces the percentage of farmers who report growing food security crops, such as groundnuts, cassava and sweet potatoes. It seems that the access to information on agriculture and commodity marketing through a CKW induces farmers to adjust their crop portfolio, moving from low-risk low-return to higher return crops, but with a larger variance. The CKW project may thus be useful to mitigate a particular type of poverty trap, whereby poor farmers choose low-risk low-return crops because they cannot afford risk, which in turn keeps them poor.
While we expected that ICTs would be effective in reducing knowledge gaps and accelerating technology adoption, we do not find evidence that the presence of a CKW alters maize productivity. To test if ICTs are effective in reducing transaction costs, we looked at the share of the maize harvest that is marketed by the farmers. Here we find that the intervention reduces the share of maize marketed by about 15–20%. Finally, we looked at the effect on the price farmers get for the maize they sell, as theory predicts that ICTs may be effective in improving the bargaining power of the smallholder farmer. We find that farmers who have access to a CKW receive prices that are on average about 12–16 higher. FE models exploring effects from the number of interactions between a CKW and a farmer suggest no additional effects, which may indicate substantial sharing of the extension and marketing information obtained from the CKW.
Disclosure statement
No potential conflict of interest was reported by the author.
Notes on contributor
Bjorn Van Campenhout is a Research Fellow at the International Food Policy Research Institute based in the Kampala office in Uganda. His research focuses on smallholders farmer interaction with both input and output markets and how this affects production, revenues and ultimately wellbeing. He obtained his PhD from the KULeuven in Belgium [email: [email protected]].
Notes
1. An extreme example would be where the market for the primary staple food is missing, such that the farm household has no other option than produce for auto-consumption. However, in other setups, where for example there are labor market and/or land market constraints, the optimal production decisions may be conditional on consumption decisions.
2. An online technical appendix explains how we deal with the fact that the UNHS data refer to the 2005/2006 agricultural season, while the baseline data from the CKW areas refer to the 2009/2010 agricultural season.
3. We also control for region in all specifications.
References
- Aker, J. C. (2010). Information from markets near and far: Mobile phones and agricultural markets in Niger. American Economic Journal: Applied Economics, 2(3), 46–59.
- Aker, J. C. (2011). Dial ‘A’ for agriculture: A review of information and communication technologies for agricultural extension in developing countries. Agricultural Economics, 42(6), 631–647. doi: 10.1111/j.1574-0862.2011.00545.x
- Aker, J. C., & Fafchamps, M. (2015). Mobile phone coverage and producer markets: Evidence from West Africa. World Bank Economic Review, 29(2), 262–292. doi: 10.1093/wber/lhu006
- Aker, J. C., & Mbiti, I. M. (2010). Mobile phones and economic development in Africa. Journal of Economic Perspectives, 24(3), 207–232. doi: 10.1257/jep.24.3.207
- Anderson, J. R., & Feder, G. (2004). Agricultural extension: Good intentions and hard realities. World Bank Research Observer, 19(1), 41–60. doi: 10.1093/wbro/lkh013
- Angrist, J. D., & Pischke, J. S. (2008). Mostly harmless econometrics: An empiricist’s companion. Princeton, NJ: Princeton University Press.
- Bamberger, M. (2009). Strengthening the evaluation of programme effectiveness through reconstructing baseline data. The Journal of Development Effectiveness, 1(1), 37–59. doi: 10.1080/19439340902727610
- Courtois, P., & Subervie, J. (2015). Farmer bargaining power and market information services. American Journal of Agricultural Economics, 97(3), 953–977.
- Dar, M. H., de Janvry, A., Emerick, K., Raitzer, D., & Sadoulet, E. (2013). Flood-tolerant rice reduces yield variability and raises expected yield, differentially benefitting socially disadvantaged groups, Science Reports 3, Article number 3315.
- Dercon, S. (1996). Risk, crop choice, and savings: Evidence from Tanzania. Economic Development and Cultural Change, 44(3), 485–513. doi: 10.1086/452229
- Dercon, S. (2002). Income risk, coping strategies and safety nets. World Bank Research Observer, 17(2), 141–166. doi: 10.1093/wbro/17.2.141
- Dorosh, P., Wang, H. G., You, L., & Schmidt, E. (2012). Road connectivity, population, and crop production in Sub-Saharan Africa. Agricultural Economics, 43(1), 89–103. doi: 10.1111/j.1574-0862.2011.00567.x
- Duflo, E., Kremer, M., & Robinson, J. (2008). How high are rates of return to fertilizer? Evidence from field experiments in Kenya. American Economic Review, 98(2), 482–488. doi: 10.1257/aer.98.2.482
- Ebiyau, J., Arach, T., & Serunjogi, K. L. (2005). Commercialisation of sorghum in Uganda. African Crop Science Conference Proceedings, 7, 695–696.
- Economist. (2003). The Eagle has landed. Retrieved from March 29, 2016, from http://www.economist.com/node/1915350
- Eswaran, M., & Kotwal, A. (1989). Credit as insurance in agrarian economies. Journal of Development Economics, 31(1), 37–53. doi: 10.1016/0304-3878(89)90030-8
- Fafchamps, M., & Hill, R. V. (2008). Price transmission and trader entry in domestic commodity markets. Economic Development and Cultural Change, 56(4), 729–766. doi: 10.1086/588155
- Fafchamps, M., & Minten, B. (2012). Impact of SMS-based agricultural information on Indian farmers. World Bank Economic Review, 26(3), 383–414. doi: 10.1093/wber/lhr056
- Foster, A. D., & Rosenzweig, M. R. (2010). Microeconomics of technology adoption. Annual Review of Economics, 2, 395–424. doi: 10.1146/annurev.economics.102308.124433
- Futch, M. D., & McIntosh, C. T. (2009). Tracking the introduction of the village phone product in Rwanda. Information Technology and International Development, 5(3), 54–81.
- Gabre-Madhin, E., Barrett, C. B., & Dorosh, P. (2002). Technological change and price effects in agriculture: conceptual and comparative perspectives. In T. Bonger, E. Gabre-Madhin, & S. Babu (Eds.), Agriculture technology diffusion and price policy (pp. 3–33). Washington, DC: Ethiopian Development Research Institute and the International Food Policy Research Institute.
- Goyal, A. (2010). Information, direct access to farmers, and rural market performance in Central India. American Economic Journal: Applied Economics, 2, 22–45.
- de Janvry, A., Fafchamps, M., & Sadoulet, E. (1991). Peasant household behaviour with missing markets: Some paradoxes explained. Economic Journal, 101(409), 1400–1417. doi: 10.2307/2234892
- Jensen, R. (2007). The digital provide: Information (technology), market performance, and welfare in the South Indian fisheries sector. The Quarterly Journal of Economics, 122(3), 879–924. doi: 10.1162/qjec.122.3.879
- Jensen, R. (2010). Information, efficiency and welfare in agricultural markets. Agricultural Economics, 41(S1), 203–216. doi: 10.1111/j.1574-0862.2010.00501.x
- Karlan, D., Osei, R., Osei-Akoto, I., & Udry, C. (2014). Agricultural decisions after relaxing credit and risk constraints. Quarterly Journal of Economics, 129(2), 597–652. doi: 10.1093/qje/qju002
- Key, N., Sadoulet, E., & de Janvry, A. (2000). Transactions costs and agricultural household supply response. American Journal of Agricultural Economics, 82(2), 245–259. doi: 10.1111/0002-9092.00022
- Mather, D., Boughton, D., & Jayne, T. S. (2013). Explaining smallholder maize marketing in southern and eastern Africa: The roles of market access, technology and household resource endowments. Food Policy, 43, 248–266. doi: 10.1016/j.foodpol.2013.09.008
- Meyer, B. D. (1995). Natural and Quasi-experiments in Economics. Journal of Business & Economic Statistics, 13(2), 151–161.
- Muto, M., & Yamano, T. (2009). The impact of mobile phone coverage expansion on market participation: Panel data evidence from Uganda. World Development, 37(12), 1887–1896. doi: 10.1016/j.worlddev.2009.05.004
- Nakasone, E., Torero, M., & Minten, B. (2014). The power of information: The ICT revolution in agricultural development. Annual Review of Resource Economics, 6, 533–550. doi: 10.1146/annurev-resource-100913-012714
- Quizon, J., Feder, G., & Murgai, R. (2001). Fiscal sustainability of agricultural extension: The case of the farmer field school approach. Journal of International Agricultural and Extension Information, 8(1), 13–24.
- Renkow, M. (1990). Household inventories and marketed surplus in semi subsistence agriculture. American Journal of Agricultural Economics, 72, 664–675. doi: 10.2307/1243036
- Renkow, M., Hallstrom, D. G., & Karanja, D. D. (2004). Rural infrastructure, transactions costs and market participation in Kenya. Journal of Development Economics, 73(3), 349–367. doi: 10.1016/j.jdeveco.2003.02.003
- Ricker-Gilbert, J., & Jones, M. (2015). Does storage technology affect adoption of improved maize varieties in Africa? Insights from Malawi’s input subsidy program. Food Policy, 50, 92–105. doi: 10.1016/j.foodpol.2014.10.015
- Schultz, T. W. (1964). Transforming traditional agriculture (p. 212). New Haven, CT: Yale University Press.
- Singh, I. J., Squire, L., & Strauss, J. (Eds.). (1986). Agricultural household models: Extension, application and policy (p. 335). Baltimore, MD: Johns Hopkins University Press.
- Stifel, D., & Minten, B. (2008). Isolation and agricultural productivity. Agricultural Economics, 39(1), 1–15. doi: 10.1111/j.1574-0862.2008.00310.x
- Svensson, J., & Yanagizawa, D. (2009). Getting prices right: The impact of the market information service in Uganda. Journal of the European Economic Association, 7(2–3), 435–445. doi: 10.1162/JEEA.2009.7.2-3.435
- Udry, C. R. (1990). Credit markets in Northern Nigeria: Credit as insurance in a rural economy. World Bank Economic Review, 4(3), 251–269.
- Van Campenhout, B. (2007). Modelling trends in food market integration: Method and an application to Tanzanian maize markets. Food Policy, 32(1), 112–127. doi: 10.1016/j.foodpol.2006.03.011
- Van Campenhout, B., Lecoutere, E., & D’Exelle, B. (2015). Inter-temporal and spatial price dispersion patterns and the well-being of maize producers in Southern Tanzania. Journal of African Economies, 24(2), 230–253. doi: 10.1093/jae/ejv002
