
ABSTRACT
There is a strong push to increase American students’ interest in Science, Technology, Engineering, and Mathematic (STEM) careers. However, minority and female students remain underrepresented in the STEM fields. Therefore, it is essential that we continue to examine the potential factors that both incite and dissuade STEM interest. We apply Expectancy-Value Theory (EVT) to examine STEM attitudes of predominantly low-socioeconomic status minority elementary school students over the course of a computing intervention. Furthermore, we integrate the digital inequality mental access conceptualization of ‘emotional costs’ into the EVT model in order to predict students’ negative STEM attitudes. Data are from a large-scale computing intervention that took place in a primarily minority, high poverty, urban elementary school district located in the southeastern USA. Results indicate that positive expectancies for success and subjective task values predict students’ positive STEM attitudes. Emotional costs toward technology primarily predict negative STEM attitudes. Students’ expectancies/values and emotional costs may have a ‘push-and-pull’ effect on the formation of STEM attitudes. This study successfully links digital disparities to STEM disparities by integrating the digital inequality concept of emotional costs. Practically, we conclude that future computing interventions should increase students’ academic-related expectancies and values while also minimizing their emotional costs in order to address both digital and STEM inequalities. Theoretically, we conclude that broad conceptualizations of emotional costs should be included in future studies to help explain negative attitudes/motivations toward STEM-related topics.
1. Introduction
In today’s world of rapid technological advances, there exists a growing need for a highly educated and skilled workforce of science, technology, engineering, and mathematic (STEM) workers (Briggs, Citation2016; Carter et al., Citation2014; Milfort, Citation2012). By the year 2018, the USA could be short up to three million high-skilled workers to fill these in-demand positions (National Math and Science Initiative, Citation2015). Increasing the supply of STEM workers to meet the growing demand is vital. Furthermore, strengthening STEM presence is essential if the USA hopes to remain competitive in an increasingly dynamic and globalized economy (Beede et al., Citation2011; Briggs, Citation2016; Chen & Weko, Citation2009; Melguizo & Wolniak, Citation2012). STEM fields are distinctly tied to our nation’s innovativeness, creativeness, productivity, and economic growth (Allen-Ramdial & Campbell, Citation2014; Carnevale, Smith, & Melton, Citation2014).
There remains a persistent STEM divide in the USA as women and minorities are consistently underrepresented in STEM fields and careers (Briggs, Citation2016). Outside of clear national-level economic motivators, there are a myriad of other equally important reasons to increase the flow of minority and female students into STEM fields (Eglash et al., Citation2017). We must strive to increase minority and female presence in STEM fields in order to make such fields representative of the current and future racial and gender landscape of the USA (Briggs, Citation2016; Carnes, Schuler, Sarto, Lent, & Bakken, Citation2006). Minority and female students bring with them unique perspectives that are invaluable when tackling important research questions facing an increasingly diverse population (Yager, Waitzkin, Parker, & Duran, Citation2007). The federal government has put forth a number of agendas and policies in the hopes of tapping into this minority population of potential STEM workers for both global competitiveness and individual social mobility (Committee on STEM Education, Citation2013; Obama, Citation2015).
Unfortunately, it appears that the lack of diversity will continue to persist despite federal agendas (McIntosh, Citation2016). The underrepresentation of minorities and females in STEM-related fields can be examined from both societal and psychological perspectives. From a societal perspective, researchers argue that the exclusion and erasure of ethnic/racial minorities and females from computing and technology fields are the outcome of certain dominant ideologies (e.g., masculinity), systematic neglect from society, and cultural/ideological conflicts (e.g., Eglash et al., Citation2017; Hicks, Citation2017; Oldenziel, Citation1999). Some scholars investigating the impacts of the exclusion from media technologies on individuals argue that the spatial and temporal constraints of access to technologies will shape self-concepts and mindsets that prevent disadvantaged youth from using technologies in the future (Robinson, Citation2009). Furthermore, environmental factors such as the socioeconomic status (SES) of minority students’ neighborhoods influence various technological inequalities (Simoni, Gibson, Cotten, Stringer, & Coleman, Citation2016). In other words, both societal and personal factors can lead to access-related inequalities, which later influence the underrepresentation of minorities and women in STEM fields.
The current study focuses on the psychological factors of students who may be encouraged or dissuaded from entering into these increasingly important fields, which are formed and influenced by social structural factors (e.g., SES), in the context of a computing intervention. We believe that it is essential to examine and investigate both the factors that might encourage STEM interest and career selection, and those factors that might dissuade STEM selection. Therefore, we apply Expectancy-Value Theory (EVT) in order to investigate which factors positively influence young students’ STEM attitudes (Eccles et al., Citation1983). Briefly, EVT is an educational theory which posits that students’ motivations, achievements, and choices are determined by their expectations for success and their subjective task values related to specific activities (Wigfield & Cambria, Citation2010b).
The first goal of this study is to investigate if the psychological factors within EVT can explain and predict elementary age students’ positive STEM attitudes in the context of a computing intervention. While previous EVT research successfully explains students’ choice and persistence, the sub-construct of cost is largely ignored in the literature until very recently (Barron & Hulleman, Citation2014; Gaspard, Dicke, Flunger, Schreier, et al., Citation2015; Wigfield & Cambria, Citation2010a). The second goal of this study is to investigate if the digital divide conceptualization of ‘emotional costs’ can explain predominantly low-SES minority elementary age students’ negative attitudes toward the traditionally technology-centric STEM fields. The third goal of this study is to investigate if the digital inequality conceptualization of emotional costs can be successfully integrated into the EVT model. Finally, our fourth goal is to provide both practical and theoretical ramifications for the study of STEM inequality, the digital divide, and the literature surrounding EVT.
We begin by delving into the importance of STEM careers on both the macro and micro levels. We then review the current body of research surrounding EVT. Next, we examine how the digital divide is a source of emotional costs and how these costs might relate to STEM disparities. Afterwards, we elaborate upon the data used in this study, the variables of interest, and the methodology employed. We conclude with a discussion of our results and the practical as well as theoretical implications of our findings.
2. Literature review
2.1. STEM importance: A macro and micro perspective
The US STEM crisis is an increasing topic of debate, policy, and evaluation. The importance of STEM fields and the need for increased diversity in them can be examined from both a macro and a micro perspective. First, we will examine the STEM crisis from a national (i.e., macro) perspective in which the global economic competitiveness of the USA is impacted by a lack of diversity (Allen-Ramdial & Campbell, Citation2014). Reports indicate that there are 36 nations that outperform US high school students in mathematics and 18 nations which outperform US high school students in science (National Center for Education Statistics, Citation2015b). The findings have global implications as the USA falls behind in measures of STEM productivity. For instance, in the USA only 33% of bachelor’s degrees are awarded in the science and engineering fields, while 49% are awarded in China (National Science Board, Citation2016). The figures have a subsequent impact on our national ability to remain innovative and competitive in today’s technologically advanced economy (Briggs, Citation2016).
Another macro-level issue is that the STEM crisis may also be restricting research growth. To elaborate, in 1981 US scientists contributed 40% of the articles in the most influential journals; however, in 2009 US scientists only accounted for 29% (National Math and Science Initiative, Citation2015). Likewise, for the first time in history, over half of US patents were awarded to non-US companies and corporations, which indicates that the STEM crisis has potentially stunted innovation in the USA (National Math and Science Initiative, Citation2015). These statistics demonstrate the growing importance of STEM fields at a national/macro-level.
However, the importance of STEM fields can also be examined from a micro-level perspective which observes the individual effects/benefits of STEM diversity. Compared to non-STEM workers, STEM employees are less likely to be unemployed (Beede et al., Citation2011). Students with STEM majors earn between 26% and 40% more than non-STEM majors, up to 70% more than the national average, and up to $500,000 more over the course of their working life (Carnevale et al., Citation2014; Cover, Jones, & Watson, Citation2011; Melguizo & Wolniak, Citation2012). African Americans, in particular, who pursue STEM careers earn 39% more than their non-STEM counterparts (Beede et al., Citation2011). However, while African Americans and Hispanics account for roughly 30% of the US population, these minorities only account for 11% of the science and engineering workforce (National Center for Science; Engineering Statistics, Citation2017).
Finally, the macro-level and micro-level perspectives intermingle to influence each other in important ways. The minority disparity in STEM originates in the US educational system, otherwise known as the STEM pipeline (Allen-Ramdial & Campbell, Citation2014; Ball, Huang, Cotten, Rikard, & Coleman, Citation2016). For instance, in 2013 White students obtained 67% of STEM-related bachelor’s degrees, while African Americans only obtained 6% (National Center for Education Statistics, Citation2015a). STEM fields must reflect the diverse population of the USA to develop innovative approaches to the complex problems facing an increasingly complex world (Carnes et al., Citation2006; Yager et al., Citation2007). STEM fields are important for the USA’s ability to remain creative, innovative, and productive (Allen-Ramdial & Campbell, Citation2014; Carnevale et al., Citation2014). The underrepresentation of racial/ethnic minorities will continue to grow in importance as projections indicate that minorities will actually compose the majority of the population by 2050 (Passel & Cohn, Citation2008). Therefore, there is a need to investigate the psychological factors that encourage and dissuade the ‘hidden workforce’ from entering into these increasingly important fields (Frehill, Di Fabio, & Hill, Citation2008).
2.2. EVT: A source of STEM attitudes
EVT is an educational theory that explains students’ motivation, selection, and persistence in activities (Eccles et al., Citation1983). The modern educational Expectancy-Value model, based on Atkinson’s (Citation1957) previous work, links choice, persistence, and performance directly to a person’s expectancy-related and task value beliefs (Wigfield & Cambria, Citation2010a). Eccles et al. (Citation1983) revised and extended the model over time in order to develop a more empirically valid theory of student motivation and persistence.
In Eccles et al.’s (Citation1983) model, EVT’s two core constructs include expectancies for success and subjective task values. Expectancies include an individual’s beliefs regarding his or her ability to successfully perform a task both currently and in the future (Matusovich, Streveler, Loshbaugh, Miller, & Olds, Citation2008). Expectancies also include a comparative element among one’s peers and the perceived difficulty of the task (Wigfield & Cambria, Citation2010b). Subjective task values refer to the values that individuals attribute to particular activities or tasks, which then in turn influence their persistence and achievement (Wigfield, Tonks, & Klauda, Citation2009). Subjective task values vary from person to person (they are subjective) and are attributed to specific tasks which can influence the desirability of an activity. In the EVT model, previous research reveals that task values are actually stronger predictors of task motivation than expectancies for success (Xiang, McBride, Guan, & Solmon, Citation2003).
There are four sub-constructs which comprise subjective task values: intrinsic value, attainment value, utility value, and cost. Briefly, intrinsic value refers to the level of interest or fun that a person receives from an activity (Wigfield & Cambria, Citation2010b). Children or students who intrinsically value an activity will often become deeply engaged in the said activity for extended periods of time (Wigfield et al., Citation2009). Attainment value refers to how important an activity is for a person’s sense of self (Wigfield & Cambria, Citation2010b). For example, if students feel that being good at math is an important aspect of their identity, then they will have a higher attainment value for the pursuit of math-based activities. However, attainment value normally does not emerge as a construct until later in a child’s life because it requires the child to develop a sense of self (Wigfield & Eccles, Citation2000). Utility value refers to how useful an activity is for accomplishing future goals and plans; for example, taking a mathematics course in order to eventually obtain a science-based degree (Wigfield & Eccles, Citation2000). Cost is the final sub-construct and it is the least studied construct within EVT (Conley, Citation2011; Flake, Barron, Hulleman, McCoach, & Welsh, Citation2015; Vernadakis, Kouli, Tsitskari, Gioftsidou, & Antoniou, Citation2014; Wigfield & Cambria, Citation2010a; Wigfield et al., Citation2009). As a result, cost is conceptualized in a number of ways. In general, cost is often referred to as the cost of time to pursue a particular activity or the cost of negative judgment from peers (Anderson & Ward, Citation2013).
Since inception, the EVT model has been applied to a broad range of activities including STEM-related course selection (Anderson & Ward, Citation2013; Wigfield et al., Citation2009). For instance, Anderson and Ward (Citation2013) found that intrinsic value, attainment value, and utility value in high school predicted STEM persistence and STEM course selection in college. Additionally, a separate study found that science and math values in elementary school predicted students’ subsequent course selections in high school (Simpkins, Davis-Kean, & Eccles, Citation2006). Therefore, we posit that EVT provides a useful framework for understanding young students’ STEM persistence. In this sense, we hypothesize that students will be more likely to express positive attitudes toward STEM fields as the level of EVT constructs (i.e., expectancy, intrinsic value, and utility value) increases.
While EVT provides a number of factors that could be relevant to young students’ positive STEM attitudes, it is essential that we continue to better our understanding of the factors that also influence students’ negative STEM attitudes. As noted previously, EVT does have a negative predictor, cost, which is the least studied construct within the EVT framework (Flake et al., Citation2015). The potential negative influence of the cost construct is important because costs can offset the positive motivational constructs found in the EVT model (Eccles et al., Citation1983). In order to better understand the psychological factors that influence attitudes and motivate behavior, we must examine both the positive and the negative factors that influence students’ complex STEM attitudes. Considering both the positive and negative motivational factors in the EVT model fills an important gap in the EVT literature related to the cost construct. Moreover, examining the concept of emotional costs in particular, we can also realize both the potential ‘push-and-pull’ relationship between psychological EVT factors and STEM attitudes in the context of a computing intervention. In the following sections, we explore and apply a new conceptualization of costs which has its roots within the digital divide literature.
2.3. The digital divide to access inequality: A source of emotional costs
The digital divide literature provides a theoretical perspective to understand how it is that minorities may perceive of and experience technology differently, which may lead to minorities’ underrepresentation in STEM fields. The conceptualization of the digital divide has shifted from a hardware access issue to a more complex multidimensional perspective (Van Deursen & Van Dijk, Citation2013). Specifically, instead of conceptualizing the digital divide as a single ‘gap,’ there are multiple gaps, origins, and ramifications (Van Dijk & Hacker, Citation2003). The first gap involves ‘material access,’ which is in line with the traditional views of the digital divide as an issue of access to technology. The second gap involves ‘skills access,’ which examines how people with limited technology access develop different digital skill levels as a result of their lack of experience. The third gap involves ‘usage access,’ which establishes that individuals with limited technology access will also develop different usage patterns when using technology. The fourth and final gap involves ‘mental access,’ which focuses on the psychological and emotional burdens placed upon those who lack experience with technology (Van Dijk & Hacker, Citation2003).
Research also indicates that unequal material and mental access leads to different Internet usage patterns between people with Internet access and those with limited Internet access (DiMaggio, Hargittai, Celeste, & Shafer, Citation2004). For example, there are racial and socioeconomic differences between using information and communication technologies (ICTs) for consuming versus producing content online (Schradie, Citation2012). Furthermore, different ICT usage patterns can result in social inequalities as digitally advantaged people gain more social and economic returns over time compared to those who do not have enough access and skills (Hargittai & Hinnant, Citation2008). Even in contexts in which Internet access is common, there are still unequal outcome differences as a result of differences in usage (Van Deursen & Helsper, Citation2015). These studies have led some researchers to posit that the digital divide should be examined in terms of a broader theory of inequality, which encompasses various inequalities (Gilbert, Citation2010; Robinson et al., Citation2015).
In the present research, we are most interested in mental access gaps. The mental access gap may culminate into ‘computer anxiety,’ which may turn ‘information have-nots’ into ‘information want-nots’ (Van Dijk & Hacker, Citation2003). More specifically, recent research conceptualizes technology-based anxiety as ‘emotional costs’ (Robinson, Citation2009). In essence, the concept of emotional costs refers to feelings of stress and/or anxiety which can occur when digitally disadvantaged students use technology, such as desktop computers, that they are unaccustomed to using due to temporal and spatial restraints. In other words, emotional costs may stem from various access inequalities. For example, while predominantly low-SES minority students may have material access and a subsequent level of comfort/proficiency with portable ICT devices such as smartphones (Smith, Citation2010), they may have to share a laptop computer at school or travel to a library to use a desktop computer. These temporal and spatial limitations add a layer of anxiety when using computers (Robinson, Citation2009). Continual technology deprivation may result in students feeling a range of negative emotions, which may influence their attitudes toward technology or particularly technology-centric tasks (Robinson, Citation2009, Citation2014). The effects of the emotional costs can be widespread as they might influence students’ abilities to gather and filter information online (skills access), conduct social capital-building activities (usage access), and research valuable information regarding college opportunities and STEM careers (skills and usage access) (Hargittai & Hinnant, Citation2008; Huang, Robinson, & Cotten, Citation2015; Robinson, Citation2012).
With the modern conceptualization of digital inequality in mind, we posit that emotional costs may contribute to predominantly low-SES minority students’ underrepresentation within STEM fields. White-collar STEM fields are generally technology-centric and require a host of twenty-first-century digital skills (Carter et al., Citation2014; Robinson et al., Citation2015). Minorities have differential access to and use of ICT devices such as smartphones (Smith, Citation2010). However, such access may be less relevant for technology-centric STEM careers which are more traditionally associated with desktop/laptop computers. Less powerful devices such as smartphones are less practical for intense or productive tasks, such as writing papers or producing digital content (O’Neal, Hale, & Cotten, Citation2011; Schradie, Citation2012). Moreover, previous research also found that minority students’ emotional costs had an impact on how they used computers (Huang, Cotten, & Rikard, Citation2017). Therefore, it stands to reason that a lack of computer experience at home or school, and subsequent emotional costs, may dissuade or discourage students from selecting STEM-based classes or careers by influencing their overall STEM attitudes. In essence, we posit that the digital divide runs through the STEM divide and hypothesize that students will be more likely to express negative STEM attitudes (i.e., STEM is not helpful) as the level of emotional costs increases.
2.4. The importance of costs: an expectancy-value and digital divide synthesis
Despite theoretical significance, the cost sub-construct is currently the least studied within the EVT model (Conley, Citation2011; Flake et al., Citation2015; Vernadakis et al., Citation2014; Wigfield & Cambria, Citation2010a; Wigfield et al., Citation2009). However, the ‘forgotten component’ of cost has re-emerged as an important and influential determinant of choice and persistence (Barron & Hulleman, Citation2014; Flake et al., Citation2015). Researchers have begun to examine the influence of cost on various activities, while others are beginning to refine the conceptualization and operationalization of this sub-construct (Barron & Hulleman, Citation2014; Flake et al., Citation2015; Gaspard, Dicke, Flunger, Brisson, et al., Citation2015; Gaspard, Dicke, Flunger, Schreier, et al., Citation2015; Trautwein et al., Citation2012).
However, there still remains a lack of consensus regarding the conceptualization of costs and the location of cost within the overall EVT model. For instance, a recent study posits that costs should be promoted from a sub-construct of subjective task values, to its own separate construct (Barron & Hulleman, Citation2014). Further still, there remains a dearth of research applying various conceptualizations of costs to different age groups (such as elementary age minority students) and topic areas (such as STEM) (Barron & Hulleman, Citation2014; Wigfield & Cambria, Citation2010a). There is a need for empirical studies to examine this increasingly important construct.
Eccles and her colleagues first conceptualized cost in the EVT model (Eccles et al., Citation1983). However, cost remained largely unexamined until fairly recently (Chiang, Byrd, & Molin, Citation2011). As mentioned above, in general, cost is usually conceptualized as the cost of time that has to be committed to pursue a particular activity. For example, students have limited time to spend pursuing various undertakings, so a class that takes an inordinate amount of time would be considered a ‘costly’ class (Eccles, Citation2005). However, the original conceptualization of cost included three dimensions (Eccles et al., Citation1983).
The first dimension was the cost of the perceived effort to pursue an activity. In this case, students anticipate the amount of effort it will take to succeed at a task; yet, if the effort requirements do not match the anticipated benefits, then the task is considered too costly (Flake et al., Citation2015). The second dimension is the cost of valued alternatives; students must often choose between two valued activities (e.g., should I sign up for basketball or baseball?), so there is often an inherent cost associated with selecting one particular task over another. Finally, there is the psychological cost of failure (Perez, Cromley, & Kaplan, Citation2014). For example, if students believe that they are likely to perform poorly in math, then they may have to deal with the added cost of anxiety, dissuading them from pursuing math-related activities (Barron & Hulleman, Citation2014; Flake et al., Citation2015; Gaspard, Dicke, Flunger, Brisson, et al., Citation2015; Perez et al., Citation2014).
One of the first studies to include costs examined their influence on women’s choice to pursue graduate school (Battle & Wigfield, Citation2003; Wigfield & Cambria, Citation2010a). The study also provides one of the first attempts at operationalizing this construct. The results indicate that college women did indeed consider costs when making career choices and costs detracted from their motivation to pursue graduate school. Of particular note, for the present analysis, another study examined the impact of costs on the intention of college students to drop out of STEM majors (Perez et al., Citation2014). Importantly, the study revealed that the different dimensions of cost related to different student intentions. For instance, effort costs and alternative costs influenced the likelihood of dropping out, but psychological costs did not. In fact, perceived effort cost was the strongest predictor in the model.
Psychological costs have also been referred to as ‘emotional costs.’ Prior research conceptualizes psychological costs as a broad ‘emotional’ cost construct which may include other emotional mood states (Flake et al., Citation2015). We refine the broad EVT conceptualization and operationalization of psychological costs and employ the digital divide conceptualization of ‘emotional costs’ related specifically to technology usage. Taken together, we hypothesize that the new EVT-based model with the construct of emotional costs may shed light and have better explanatory power on elementary students’ STEM attitudes and motivations. Applying the findings of previous literature to the context of the current computing intervention, we propose three hypotheses:
H1: As the level of expectancy, intrinsic value, and utility value increases, the 4th and 5th graders in the computing intervention will be more likely to express positive STEM attitudes.
H2: As the level of emotional costs increases, the 4th and 5th graders in the computing intervention will be more likely to express negative STEM attitudes.
H3: The model with emotional costs will provide a better model fit than the EVT model alone.
3. Data and methods
3.1. Data collection and sample
The data for this study were gathered over the course of a large-scale computing intervention in an urban, high poverty, predominately African-American school district in the southeastern USA. The Integrating Computing Across the Curriculum (ICAC) project took place across five years and 30 schools. Approximately 95% of the students were African American and 89% of students participated in the free or reduced lunch program (Alabama Department of Education, Citation2015). These demographic characteristics made this particular school district an ideal location for the ICAC intervention, which was focused on increasing the interest of predominantly low-SES minority students in STEM fields/careers.
Regarding the intervention itself, ICAC was a teacher-based intervention that took place in the 4th and 5th grades. Teachers participated in a number of computing-based trainings over the course of the school year and summer. In essence, teachers were taught how to integrate computing across their curriculum and into their classrooms. The trainings themselves were focused on developing computing-related skills, such as creating tables, programming, blogging, and other activities that could promote students’ STEM interests. Teachers then implemented what they learned in their classrooms. Teachers also received ICAC support during their classroom integration. The fundamental idea behind the ICAC intervention design was that students would benefit from the intervention through the teacher implementation of computing within the classroom.
The data for this study were collected in the Fall of 2012 (i.e., year 4), the beginning of the academic school year. The survey was administered to 4th and 5th grade students enrolled in the 12 schools participating in the ICAC intervention during that academic year. The paper-and-pencil surveys were administered during class and they took approximately 30–40 minutes to complete. Participation in the data collection was voluntary and students received a small incentive regardless of their survey completion. A total of 1201 students completed the survey. Participants with missing data related to key variables were excluded from the analysis, which reduced the overall sample size to 1045. Overall, most of the students elected to finish the survey. We further adjusted the missing data with the key variables by reducing people who did not answer. In terms of demographic information, students did not have significant difference in race, gender, class grade, and also STEM-related variables between two groups (with vs. without missing independent variables). This research was approved by the university institutional review board.
3.2. Dependent variables
There are four dependent variables in the present research: STEM Affinity, STEM Importance, STEM Career, and Negative STEM. All of the STEM-related variables were created post hoc out of the ICAC survey instrument which included a general STEM Attitudes index (Cotten, Citation2010). The STEM Affinity index consisted of three questions such as ‘I think science is cool.’ The STEM Importance index consisted of two questions, such as ‘Knowing math will be important for me to get a good job.’ The STEM Career index consisted of two questions, such as ‘I would like to get a job working with computers and technology when I am older.’ The Negative STEM index consisted of two questions, such as ‘Knowing about math and science won’t help me to find a job when I am older.’ The response categories for each index were 1 = Disagree, 2 = Not Sure, and 3 = Agree.
The four dependent variables employed were formative items, which means that the direction of causality is from the indicator to the construct and without any concern for item intercorrelations. Tests of reliability were not applicable to the formative constructs because it is not necessary for formative indicators to share the same theme (Coltman, Devinney, Midgley, & Venaik, Citation2008). Ellwart and Konradt (Citation2011) further specify that Cronbach’s alpha does not apply to formative indicator models because each indicator of a formative construct is responsible for a specific dimension. Therefore, we did not calculate Cronbach’s alpha. To be more specific, the STEM variables are formative constructs rather than reflective constructs, so the reliability will be relatively low because the items are not necessarily highly correlated. For example, kids who are interested in science are not necessarily also interested in math. Some research on measurements also suggests that researchers should not assume a high correlation between items of formative constructs, which means a high reliability will not be applicable to formative constructs.
3.3. Independent variables
Both the EVT and emotional costs scales were constructed post hoc from the ICAC survey instrument. The original ICAC survey gauged academic self-efficacy, computer use, anxiety toward using computers in the context of the computing intervention, and technology self-efficacy. The instrument also gathered students’ basic demographic information. After examining the survey instrument and comparing it to other EVT measures (Eccles, Wigfield, Harold, & Blumenfeld, Citation1993; Wigfield & Cambria, Citation2010b), we believed that there were enough EVT-related questions to justify a factor analysis. A number of relevant items were selected and a factor analysis using varimax rotation was conducted.
Four factors emerged from the varimax rotation factor analysis: expectancy, utility value, intrinsic value, and emotional costs. Upon inspection of the results, there were no significant cross loadings greater than 0.40, demonstrating distinct constructs. A factor for attainment value did not emerge from our analysis. However, this finding was consistent with previous EVT studies which found that some of the value sub-constructs, attainment value in particular, do not empirically emerge within young students and they tend to load onto more general value factors (Eccles et al., Citation1993; Wigfield & Cambria, Citation2010b). For instance, previous research found that only utility and intrinsic values develop early in a student’s life, while attainment value develops later with maturity (Wigfield & Eccles, Citation2000). The factor analysis was conducted using SPSS 22, and the results of the analysis are listed in .
Table 1. Factor loadings of EVT constructs and emotional costs (n=1045).
The expectancies for the success scale consisted of five questions. Sample questions include ‘I usually do a good job on tests’ and ‘I can read as well as most kids my age.’ The response options for this scale were 1 = Almost Never, 2 = Sometimes, and 3 = Almost Always. The utility value scale consisted of six questions. Sample questions include ‘I do well at school so that I can get a high-paying job later on’ and ‘I do my best in school because I am trying to have a good future.’ The intrinsic value scale consisted of two questions. A sample question includes ‘I work hard at school because I am interested in what I am learning.’ The response options for both the utility value and intrinsic value scales were 1 = Disagree, 2 = Not Sure, and 3 = Agree. The response categories for these survey items were limited due to the young age of respondents in conjunction with the overall length of the questionnaire. The scores for each scale were totaled and then averaged.
Emotional costs were operationalized as anxiety or stress when using a computer in a number of classroom situations. As mentioned above, the emotional costs scale was constructed post hoc out of the ICAC survey instrument which asked students a number of questions regarding their attitudes toward computers, perceived control of computers, and anxiety toward computers. The term ‘computers’ in this scale refers to desktop and laptop computers and does not include measures of other ICT devices, such as tables or smartphones. Sample questions include ‘Computers make me uncomfortable’ and ‘I don’t want to use a computer in case I look stupid’ (Selwyn, Citation1997). The response categories for the survey items were 1 = Disagree, 2 = Not Sure, and 3 = Agree. The scores were totaled and then averaged.
After creating each of the above four independent variable scales, reliability tests were conducted. The Cronbach alpha was acceptable for the expectancy scale (α = 0.74), the utility value scale (α = 0.68), and the emotional costs scale (α = 0.74). For the intrinsic value scale, the three-item sale had a slightly low reliability (α = 0.57). After we deleted one item (i.e., Going to school is fun), the reliability of the intrinsic scale increased to a more acceptable level (α = 0.66).
3.4. Control variablesFootnote1
There were three control variables included within the present analysis: gender, race, and grade. Gender, race, and grade were controlled based on previous EVT literature, which found that these individual characteristics can influence students’ expectancies and values (Eccles et al., Citation1983; Eccles et al., Citation1993). All three of these control variables were recoded as dichotomous dummy variables (0 = Female, 1 = Male; 0 = Non-African American, 1 = African American; 0 = 4th grade, 1 = 5th grade). In particular, race was operationalized as racial and ethnic minorities in which African Americans comprised the vast majority of respondents. We did not include a measure of SES in the analyses because the elementary age students were not able to accurately report the amount of parental income nor their parents’ highest level of education obtained. However, we believe it is still important to contextualize our findings in regard to students’ SES, which is considered an important factor influencing digital inequality factors such as emotional costs (Robinson, Citation2009; Simoni et al., Citation2016). Therefore, we defaulted to using available SES indicators gathered from the school district in which the computing intervention took place, which have been shown to influence digital inequality factors such as the ones measured in the current study (Alabama Department of Education, Citation2015).
3.5. Analytic techniques
There were four analytic techniques implemented in the present study. First, descriptive statistics were estimated for each variable of interest. The descriptive statistics are not used to draw any conclusions from the data; instead, they are used to gain a better contextual understanding of the data. The demographic information of our participants and the descriptive information of our interested variables were analyzed via the SPSS 22 software package.
Second, a confirmatory factor analysis of the proposed model was conducted to verify the factor structure of the independent variables via the AMOS 22.0 software package. Confirmatory factor analysis is a method that provides us with more information regarding the level of fit of the proposed research model. The proposed theoretical model was generated based on prior studies and our research hypotheses. For the confirmatory factor analysis, we employed the maximum likelihood estimation method to estimate the parameters of our model. The indexes of goodness-of-model fit include the comparative fit index (CFI), the root mean square error of approximation (RMSEA), and the Chi-square/degrees of freedom (CMIN/DF). Regarding the acceptable standards for the evaluation of our goodness of fit, the CFI should be between 0.95 and 1.00; the RMSEA should be between 0 and 0.07; and the CMIN/DF should be between 0 and 3, and the p-value should not be significant (Hooper, Coughlan, & Mullen, Citation2008).
Third, a series of ordinary least squares (OLS) regressions were estimated to determine the predictive power of the EVT and emotional cost independent variables on the STEM-related dependent variables while controlling for participants’ demographics. All of the OLS regressions were conducted using the SPSS 22 software package.
Fourth, a path analysis of the proposed model, including several direct paths from the EVT constructs and emotional costs to STEM attitudes, using maximum likelihood estimation was conducted. We accessed the overall model fit and then removed the nonsignificant paths in the model.
4. Results
4.1. Descriptive statistics
presents the descriptive statistics for the demographic information and the variables of interest. The demographic characteristics of the participants consisted of 517 (49.5%) females and 528 (50.5%) males. Slightly more than half of the respondents were in the fifth grade. For the dependent variables, the students reported high STEM affinity (2.61) and importance (2.78). However, the students only expressed a medium score on attitude toward pursuing a STEM career (1.80) and negative STEM attitudes (1.53) measures. For the independent variables, the majority of the students reported having relatively high utility value (2.92), intrinsic value (2.82), and expectancy (2.61). On average, the students reported a medium level of emotional costs (1.58).
Table 2. Descriptive statistics for independent and control variables.
4.2. Confirmatory factor analyses
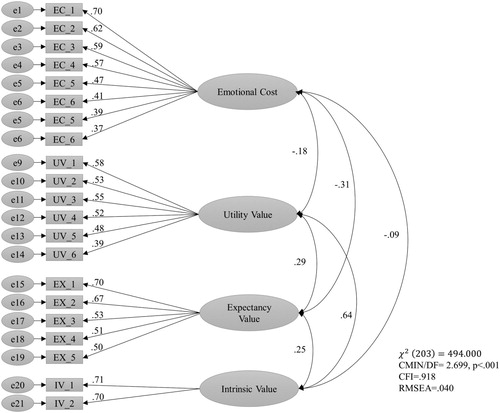
and present the results of the confirmatory factor analyses. Two models were generated. The first model was a three-factor model including just the EVT variables. The second model was a four-factor model which included all of the EVT variables as well as emotional costs. The models reveal the effect level of the independent variables on each other and their ratio to each other. First, for the three-factor model, which included only EVT variables, the fit indices indicated only acceptable but not a desired level of goodness of fit (Chi-square = 265.978, p < .001; CMIN/DF = 4.290; CFI = 0.914; and RMSEA = 0.056). However, the fit indices of the four-factor model indicated that the goodness of fit was excellent and at the desired level (Chi-square = 494.000, p < .001; CMIN/DF = 2.699; CFI = 0.918; and RMSEA = 0.040). Thus, the four-factor model, which includes emotional costs and the EVT constructs, provides a better model fit. Therefore, in the following sections, we use the four factors derived from the CFA as predictors to examine students’ STEM-related attitudes.
Figure 1. Confirmatory factor analysis of expectancy-value theory items (three-factor model).
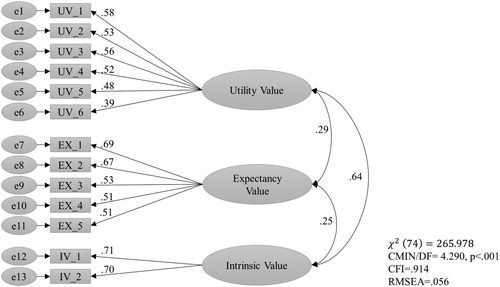
Figure 2. Confirmatory factor analysis of expectancy-value theory and emotional costs items (four-factor model).
4.3. OLS regression analyses
There were two OLS regression models included within the analysis, which can be found in . The models examined the impact of the control variables and independent variables upon the four STEM-related outcome variables. The first models only included the control variables: gender, race, and grade. In the second set of models, we included our independent variables of interest: intrinsic value, utility value, expectancy, and emotional costs. Examining students’ affinity toward STEM fields, the results reveal that students’ intrinsic values (β = 0.261, p < .001) and expectancies (β = 0.127, p < .01) were significant positive predictors. Regarding students’ beliefs about the importance of STEM fields, intrinsic values (β = 0.110, p < .001) and expectancies (β = 0.087, p < .01) were still statistically significant positive predictors. However, in this case, students’ utility values (β = 0.244, p < .001) were actually the strongest predictor in the model when compared to the other independent variables. Emotional costs were not significant predictors of either STEM Affinity or STEM Importance.
Table 3. Regression coefficients: STEM affinity and STEM importance regressed on EVT constructs and emotional cost.
While emotional costs were not statistically significant predictors of STEM affinity or importance, emotional costs became a relatively strong and significant predictor when examining the impact on STEM Career interest and negative STEM attitudes. For instance, when examining students’ attitudes toward pursuing a STEM career, emotional costs (β = 0.257, p < .001) and intrinsic values (β = 0.122, p < .001) were effective predictors. The results also indicate that students’ class grade (β = −0.088, p < .01) was associated with students’ attitudes toward STEM career. More specifically, 5th graders reported lower STEM career interest scores after controlling for the other variables of interest. Regarding students’ negative attitudes toward STEM fields, we found that emotional cost (β = 0.298, p < .001) was in fact the only significant predictor in this model. However, similar to the STEM career results, being in the 5th grade (β = −0.081, p < .01) was associated with having more negative attitudes toward STEM fields ().
Table 4. Regression coefficients: STEM career and negative STEM regressed on EVT constructs and emotional cost.
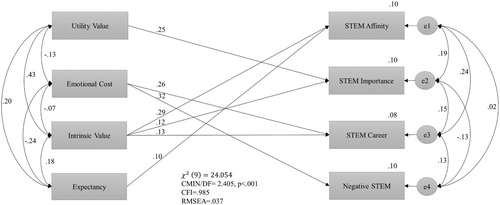
4.4. Path analysis
In order to gain a better understanding of the effects of EVT constructs and emotional costs on STEM attitudes, a path analysis estimated the proposed model shown in . First, we accessed the overall model fit, and the fit indices suggested a good fit of the proposed model to the data (Chi-square = 24.054, p < .001, CFI = .985, CMIN/DF = 2.405, RMSEA = .037). Given that the proposed model has a good fit, we interpret the results regarding our hypotheses. The model shows that utility value, intrinsic value, and expectancy have a positive effect on positive STEM attitudes, which is consistent with our first hypothesis. On the other hand, emotional cost has a positive effect on negative STEM attitudes, which supports our second hypothesis. To be more specific, utility value predicts more positive attitude toward STEM importance (γ = .25, p < .000); intrinsic value predicts higher STEM affinity (γ = .29, p < .000), STEM importance (γ = .12, p < .000), and STEM career (γ = .13, p < .000); and expectancy predicts higher STEM affinity (γ = .10, p < .01). Emotional cost, on the one hand, positively predicts negative STEM attitudes (γ = .32, p < .000) as we expected. However, unexpectedly, it also positively predicts attitude toward STEM careers (γ = 0.26, p < .000). We address this unexpected finding in the discussion section.
Figure 3. Path analysis of the effects of expectancy-value theory and emotional costs on dependent variables.
5. Discussion
Over the past decade there has been a growing body of research which examines the link between digital inequality and other forms of inequality (Hargittai & Hinnant, Citation2008). The implications of these connections have a broad range of impacts on an individual’s life trajectories (Robinson et al., Citation2015). In this study, we built upon previous research by examining how students’ expectancies and values in the context of a computing intervention influence their attitudes toward increasingly important and valuable STEM fields. More importantly, we also contribute to the body of research by discovering that the digital divide concept of emotional costs can be linked to students’ negative STEM attitudes.
The results of this study reveal that students’ intrinsic values (i.e., interest in a topic/task) are the most consistent predictors across all of the positive STEM models. As intrinsic values increase, students are more likely to report higher affinity toward STEM topics, higher beliefs in the importance of STEM fields, and higher interest in pursuing STEM-based careers. Furthermore, both utility values (i.e., usefulness of a topic/task) and expectancies for success (i.e., belief in the ability to perform a task) are also predictors of various STEM attitudes. Specifically, as students’ expectancies for success increase, they are more likely to report higher affinity toward STEM topics and they are also more likely to express beliefs in the importance of STEM. Likewise, as students’ level of utility values increases, they are more likely to express a belief in the importance of STEM. The findings support our first hypothesis, which stated that as the level of EVT variables increased, students would be more likely to express positive STEM attitudes.
The present study also examined the influence of the digital divide conceptualization of emotional costs (i.e., anxiety toward using computers) on STEM attitudes. Results reveal that emotional costs are an effective predictor of students’ negative STEM attitudes. More specifically, when students’ emotional costs increase, they are more likely to express negative attitudes toward STEM. For example, students become more likely to express beliefs that STEM will not be helpful for getting a good job in the future. These findings support our second hypothesis, which stated that as the level of emotional costs increased, students would be more likely to express negative STEM attitudes.
While examining the predictive power of the independent variables of interest was an important facet of the current study, an additional goal was to expand the original EVT model on STEM-related subjects (e.g., Anderson & Ward, Citation2013; Eccles et al., Citation1983) by including the digital divide conceptualization of emotional costs into the model and to contribute to the developing scholarship on the conceptualization and operationalization of costs in the EVT model (e.g., Flake et al., Citation2015). Using a series of confirmatory factor analyses, we found that the new model, which included emotional costs, was indeed a better model for explaining both students’ positive and negative STEM attitudes. Therefore, our third hypothesis, which predicted that the model with emotional costs would have a better model fit than the EVT model alone, was supported.
Last, when examining the outcome variable of STEM career interest in particular, an attitudinally neutral construct, an interesting finding, emerges. In the case of STEM career interest, both intrinsic values (a positive construct) and emotional costs (a negative construct) are significant predictors. If we synthesize all of the above findings together, a potential ‘push-and-pull’ phenomenon emerges. In other words, it would appear that EVT constructs push students toward STEM careers by enhancing their positive STEM attitudes, while emotional costs pull students away from STEM careers by increasing their negative STEM attitudes. In regard to STEM careers in particular, the effects of the EVT constructs and emotional costs are mixed.
The results suggest that higher emotional costs will have a positive effect on pursuing STEM careers, which seems to contrast with our hypothesis at first glance. However, this finding is actually consistent with previous qualitative research on underprivileged students’ emotional cost and their ICT usage patterns. For example, Robinson’s (Citation2009) interviews with students who suffered from limited spatial and temporal access to ICTs found that underprivileged students enacted ‘a taste for necessary.’ In other words, underprivileged students rationed their ICT use and also avoided activities with no immediate payoff. Applying the findings to the context of this computing intervention, students with higher emotional costs might regard STEM careers as a taste for necessary; however, their negative attitude toward STEM subjects prevent them from building a correct informational habitus, which leads people to a positive disposition toward information seeking. Therefore, people with higher emotional costs and higher intrinsic values can both pursue STEM careers, but with different habitus and mindsets.
Our findings examine the effects of EVT constructs and emotional costs on predominantly minority students’ STEM attitudes. The implications of our findings can be divided into three major categories. First, regarding student implications, enhancing students’ expectancies and subjective task values should encourage students to pursue STEM majors. Second, regarding implications for teachers and parents, lowering students’ emotional costs associated with technology should help to encourage students to pursue STEM careers. Finally, regarding implications for computing interventions, providing material access is not enough to encourage positive STEM attitudes in students. Computing interventions should emphasize students’ expectancies for academic success and subjective values, while also providing computing environments that help reduce students’ emotional costs in order to encourage positive STEM attitudes and career pursuit.
5.1. Limitations
Though the above findings provide interesting insights into the factors that influence predominantly low-SES minority students’ STEM attitudes, we must acknowledge a number of inherent limitations within the present study. First, the data used in this study come from a large-scale computing intervention which took place in a high poverty urban school district located within the southeastern USA. Therefore, these results may have limited generalizability to students of other regions and SESs. Second, our sample consists of primarily African-American elementary school students. While a predominately African-American sample is ideal for the purposes of our study, the sample characteristics may also limit the generalizability of our findings outside the specific racial and age categories. Third, the response options for independent and dependent variables in the current study were limited to three categories, which were kept short due to the length of the questionnaire and the young age of the participants. The three categorical responses may not fully capture the subtle variations in children’s emotions. Finally, the dimensions of STEM were limited across all of our dependent variables. In other words, some variables such as STEM affinity only included dimensions for science, technology, and math without any questions related to engineering. Therefore, our STEM dependent variables do not necessarily reflect the entirety of the STEM diversity of fields and careers.
Future research should consider addressing the above limitations by obtaining a more diverse (both racially and geographically) sample. Future research should also continue to investigate any interactions between EVT constructs and emotional costs, as well as their impacts on specific STEM fields across different age groups. Finally, there is also potential to investigate the impacts of EVT variables and emotional costs outside of the present context of a large-scale computing intervention. Studies examining the impact of smaller scale computer labs and classroom activities might also be important.
6. Conclusion
Given the above limitations, the present research still offers a number of important theoretical as well as practical implications and contributions. First, our study demonstrates that EVT provides a useful framework for examining elementary age students’ STEM attitudes. Second, our research contributes to the scholarship surrounding the connection between digital inequality and other forms of inequality, such as STEM disparities, by integrating the digital divide concept of emotional costs into the EVT model. Third, the study validates the importance of the largely understudied construct of ‘costs’ in the EVT model. Finally, we demonstrate that cost should be conceptualized as a full multidimensional and potentially interrelated construct within EVT.
To elaborate, our analysis revealed that EVT variables (i.e., expectancies for success, intrinsic values, and utility values) are contributing factors that potentially ‘push’ students toward STEM careers. When students believe that they can succeed in academia and when they value academic activities, they are more likely to express positive STEM attitudes. However, while EVT variables predicted positive STEM attitudes, they were unable to predict negative STEM attitudes. Our analysis further found that emotional costs predicted not only negative STEM attitudes, but also interest in STEM careers. By consulting previous research on emotional costs (Robinson, Citation2009), we conclude that emotional costs might ‘pull’ students away from STEM careers by either increasing their negative attitudes toward STEM, or preventing them from building the correct mindset and habitus toward pursuing these careers even though they would like to pursue STEM careers. To reiterate, emotional costs refer to technology-related feelings of anxiety and stress that stem from limited technology access. Therefore, our study successfully integrated the digital divide conceptualization of emotional costs into the EVT model. The finding links the digital divide to STEM disparities by demonstrating that computer/technology anxiety negatively influences attitudes toward STEM fields.
Practically speaking, increasing predominantly low-SES minority students’ expectancies and values might be a viable, but not the only, way to increase the number of predominantly low-SES minority students interested in STEM fields. For an intervention to be truly effective in increasing predominantly low-SES minority students’ STEM motivations, the intervention must also attempt to relieve students’ emotional costs associated with technology use, a key factor that might dissuade predominantly low-SES minority students from pursuing STEM careers. Therefore, future computing interventions should emphasize academic expectancies for success and academic values while also attempting to minimize emotional costs in order to have the greatest effect on predominantly low-SES minority students’ STEM attitudes.
Theoretically speaking, our results contribute in a number of important ways. First, our study is one of the few that actually accounts for the construct of ‘cost’ within the EVT model. Cost is considered the most understudied construct within EVT (Conley, Citation2011; Flake et al., Citation2015; Gaspard, Dicke, Flunger, Schreier, et al., Citation2015; Vernadakis et al., Citation2014; Wigfield & Cambria, Citation2010a; Wigfield et al., Citation2009). Our research demonstrates that cost is indeed an important predictor that should be included in future EVT-related studies. We also expand the conceptualization of costs significantly. While cost is conceptualized in a number of ways in the past and present (Eccles et al., Citation1983; Flake et al., Citation2015; Gaspard, Dicke, Flunger, Brisson, et al., Citation2015; Gaspard, Dicke, Flunger, Schreier, et al., Citation2015), it is usually associated with a particular activity or task, which is consistent with the theory. For example, a study might examine the cost of playing basketball on the intention to play basketball.
However, here, we have demonstrated that the concept of cost is a very complex, emotional, and interrelated concept. More specifically, our study demonstrates that the emotional costs associated with computers can actually influence attitudes related to other separate, but interrelated topics, such as STEM attitudes. In other words, the costs of one task might influence students’ motivation to pursue another associated or tangential task. After considering all the above findings together, we agree with other scholars (Barron & Hulleman, Citation2014) that the construct of costs should be promoted from a sub-construct of task values to a full construct within the EVT model. Cost would appear to be a complex, multidimensional construct, which adds to the ability to explain negative attitudes in addition to positive attitudes.
Over the past several decades, a much deeper understanding of how digital inequalities are related to other important inequalities has evolved. In the present research, we demonstrate that digital inequalities are related to STEM disparities. However, digital inequalities remain complex and we assert that more research is needed into the affective and attitudinal factors that influence students’ motivations to pursue and persist in STEM fields. Our results indicate that attitudinal factors can push students toward STEM careers, while others may pull them away from these lucrative careers. In particular, we believe that future technology and educational interventions should consider both the positive and the negative influencers of STEM motivations: expectancies, values, and emotional costs. In the end, overcoming STEM disparities will require a multifaceted view of both these positive and negative factors because different values and mindsets will lead to different STEM attitudes and goals.
Acknowledgement
The views expressed in this manuscript reflect those of the authors and not the National Science Foundation.
Disclosure statement
No potential conflict of interest was reported by the authors.
Notes on contributors
Christopher Ball is currently a PhD student in the Media and Information Studies program at Michigan State University. His research interests involve the influence of new technologies on society and how these technologies can be harnessed for research, education, and outreach purposes. More specifically, his research interests involve the use of interactive media and technologies such as video games, virtual worlds, and virtual reality to foster prosocial outcomes [email: [email protected]].
Kuo-Ting Huang is a doctoral candidate in the Department of Media and Information at Michigan State University. His research interests lie in information and communication technologies (ICTs) with a focus on the effects of virtual environments on learning and education. His current research focuses on the social psychological effects of ICTs on education and health [email: [email protected]].
R.V. Rikard is a Postdoctoral Research Associate under the direction of Dr. Shelia Cotten in the Department of Media and Information at Michigan State University. R.V.’s research interests include: the intersection of health literacy and health disparities, the social impact of technology on health and community health, the connection between online health messages using social media/social network site and offline health behaviors, and the social science of “Big Data” [email: [email protected]].
Shelia R. Cotten is Professor in the Department of Media and Information at Michigan State University. She has served as the Chair of CITASA. Her work has been funded by The National Science Foundation and the National Institute on Aging. Cotten’s work addresses key social problems with sociological tools related to technology access, use, and impacts/outcomes. Her body of work was recognized by the CITASA Award for Public Sociology in 2013 [email: [email protected]].
Additional information
Funding
Notes
1 We also tested for the effects of the teacher intervention as well as the effects of schools and classrooms. We further controlled for teacher's self-efficacy and attitude toward the computing intervention. These variables did not have a significant effect on our results, so we did not include teacher-related variables in our analyses. Results are available from the authors.
References
- Alabama Department of Education. (2015). Alabama Department of Education Data Center. from http://www.alsde.edu/dept/data/Pages/home.aspx.
- Allen-Ramdial, S.-A. A., & Campbell, A. G. (2014). Reimagining the pipeline: Advancing STEM diversity, persistence, and success. BioScience, 64(7), 612–618. doi: 10.1093/biosci/biu076
- Anderson, L., & Ward, T. (2013). Expectancy-value models for the STEM persistence plans of ninth-grade, high-ability students: A comparison between black, Hispanic, and white students. Science Education, 98(2), 216–242. doi: 10.1002/sce.21092
- Atkinson, J. (1957). Motivational determinants of risk-taking behavior. Psychology Review, 64(6), 359–372. doi: 10.1037/h0043445
- Ball, C., Huang, K.-T., Cotten, S. R., Rikard, R. V., & Coleman, L. O. (2016). Invaluable values: An expectancy-value theory analysis of youths’ academic motivations and intentions. Information, Communication & Society, 1–21. doi: 10.1080/1369118X.2016.1139616
- Barron, K., & Hulleman, C. (2014). Expectancy-value-cost model of motivation. In J. Eccles & K. Salmelo-Aro (Eds.), International encyclopedia of social and behavioral sciences (2nd ed.: Motivational Psychology, pp. 503–509). Oxford: Elsvier.
- Battle, A., & Wigfield, A. (2003). College women’s value orientations toward family, career, and graduate school. Journal of Vocational Behavior, 62, 56–75. doi: 10.1016/S0001-8791(02)00037-4
- Beede, D., Julian, T., Khan, B., Lehrman, R., McKittrick, G., Langdon, D., & Doms, M. (2011). Education supports racial and ethnic equality in STEM. Washington, DC: Economics and Statistics Administration.
- Briggs, C. (2016). The policy of STEM diversity: Diversifying STEM programs in higher education. Journal of STEM Education: Innovations and Research, 17(4), 5–7.
- Carnes, M., Schuler, L., Sarto, G. E., Lent, S. J., & Bakken, L. (2006). Increasing sex and ethnic/racial diversity of researchers in aging: Some promising strategies at the postdoctoral level. Journal of the American Geriatrics Society, 54(6), 980–985. doi: 10.1111/j.1532-5415.2006.00739.x
- Carnevale, A., Smith, N., & Melton, M. (2014). STEM. Washington, DC: Center on Education and the Workforce.
- Carter, A., Cotten, S., Gibson, P., O’Neal, L., Simoni, Z., Stringer, K., & Watkins, L. (2014). Integrating computing across the curriculum: Incorporating technology into STEM education. In Z. Yang, H. Hao Yang, D. Wu, & S. Liu (Eds.), Transforming K-12 classrooms with digital technology (pp. 165–192). Hershey, PA: IGI Global.
- Chen, X., & Weko, T. (2009). Students who study science, technology, engineering, and mathetatics (STEM) in postsecondary education. Washington, DC: U.S. Department of Education.
- Chiang, E., Byrd, S., & Molin, A. (2011). Children’s percieved cost for exercise: Application of an expectancy-value paradigm. Health Education & Behavior, 38(2), 143–149. doi: 10.1177/1090198110376350
- Coltman, T., Devinney, T. M., Midgley, D. F., & Venaik, S. (2008). Formative versus reflective measurement models: Two applications of formative measurement. Journal of Business Research, 61(12), 1250–1262. doi: 10.1016/j.jbusres.2008.01.013
- Committee on STEM Education. (2013). Federal STEM education 5-year plan. Washington, DC: National Science and Technology Council.
- Conley, A. (2011). Patterns of motivation beliefs: Combining achievement goal and expectancy-value perspectives. Journal of Educational Psychology, 104(1), 32–47. doi: 10.1037/a0026042
- Cotten, S. (2010). XO laptops, education, and connection: Results from the Birmingham youth and technology study. Paper presented at the Texas A&M Race and Ethnic Studies Institute, College Station, Texas.
- Cover, B., Jones, J. I., & Watson, A. (2011). Science, technology, engineering, and mathematics (STEM) occupations: A visual essay. Monthly Labor Review, 134(5), 3–15.
- DiMaggio, P., Hargittai, E., Celeste, C., & Shafer, S. (2004). From unequal access to differentiated use: A literature review and agenda for research on digital inequality. In K. Neckerman & S. Shafer (Eds.), Social inequality (pp. 355–400). New York, NY: Russell Sage Foundation.
- Eccles, J. (2005). Subjective task value and the Eccles et al. Model of achievement-related choices. In A. Elliot & C. Dweck (Eds.), Handbook of competence and motivation (pp. 105–121). New York, NY: The Guildford Press.
- Eccles, J., Adler, T., Futterman, R., Goff, S., Kaczala, C., Meece, J., & Midgley, C. (1983). Expectancies, values, and academic behaviors. In J. Spence (Ed.), Achievement and achievement motivation (pp. 75–146). San Francisco, CA: W. H. Freeman.
- Eccles, J., Wigfield, A., Harold, R., & Blumenfeld, P. (1993). Age and gender differences in children’s self- and task perceptions during elementary school. Child Development, 64(3), 830–847. doi: 10.2307/1131221
- Eglash, R., Babbitt, W., Bennett, A., Bennett, K., Callahan, B., Davis, J., & Krishnamoorthy, M. (2017). Culturally situated design tools: Generative justice as a foundation for STEM diversity (pp. 132–151). Hershey, PA: IGI Global.
- Ellwart, T., & Konradt, U. (2011). Formative versus reflective measurement: An illustration using work–family balance. The Journal of Psychology, 145(5), 391–417. doi: 10.1080/00223980.2011.580388
- Flake, J., Barron, K., Hulleman, C., McCoach, B., & Welsh, M. (2015). Measuring cost: The forgotten component of expectancy-value theory. Contemporary Educational Psychology, 41, 232–244. doi: 10.1016/j.cedpsych.2015.03.002
- Frehill, L., Di Fabio, N., & Hill, S. (2008). Confronting the “new” American dilemma-underrepresented minorities in engineering: A data-based look at diversity. White Plains, NY: National Action Council for Minorities in Engineering.
- Gaspard, H., Dicke, A.-L., Flunger, B., Brisson, B. M., Häfner, I., Nagengast, B., & Trautwein, U. (2015). Fostering adolescents’ value beliefs for mathematics with a relevance intervention in the classroom. Developmental Psychology, 51(9), 1226–1240. doi: 10.1037/dev0000028
- Gaspard, H., Dicke, A.-L., Flunger, B., Schreier, B., Häfner, I., Trautwein, U., & Nagengast, B. (2015). More value through greater differentiation: Gender differences in value beliefs about math. Journal of Educational Psychology, 107(3), 663–677. doi: 10.1037/edu0000003
- Gilbert, M. (2010). Theorizing digital and urban inequalities: Critical geographies of ‘race’, gender and technological capital. Information, Communication & Society, 13(7), 1000–1018. doi: 10.1080/1369118X.2010.499954
- Hargittai, E., & Hinnant, A. (2008). Digital inequality: Differences in young adults’ use of the internet. Communication Research, 35(5), 602–621. doi: 10.1177/0093650208321782
- Hicks, M. (2017). Programmed inequality: How Britain discarded women technologists and lost its edge in computing. Cambridge, MA: The MIT Press.
- Hooper, D., Coughlan, J., & Mullen, M. (2008). Structural equation modelling: Guidelines for determining model fit. Electronic Journal of Business Research Methods, 6(1), 53–60.
- Huang, K.-T., Cotten, S. R., & Rikard, R. V. (2017). Access is not enough: The impact of emotional costs and self-efficacy on the changes in African-American students’ ICT use patterns. Information, Communication & Society, 20(4), 637–650. doi: 10.1080/1369118X.2016.1203456
- Huang, K.-T., Robinson, L., & Cotten, S. (2015). Mind the emotional gap: The impact of emotional costs on student learning outcomes. In L. Robinson, S. Cotten, & J. Schulz, T. M. Hale, & A. Williams (Eds.), Communication and information technologies annual (studies in media and communications, (vol. 10, pp. 121–144). Bingley, West Yorkshire: Emerald Group.
- Matusovich, H., Streveler, R., Loshbaugh, H., Miller, R., & Olds, B. (2008). Will I succeed in engineering? Using expectancy-value theory in a longitudinal investigation of students’ beliefs. Paper presented at the American Society for Engineering Education 2008 Annual Conference & Exposition, Pittsburgh, Pennsylvania.
- McIntosh, D. H. (2016). A bridge to the stars: An innovative pipeline to improve STEM diversity. Paper presented at the American Astronomical Society Meeting Abstracts.
- Melguizo, T., & Wolniak, G. (2012). The earnings benefits of majoring in STEM fields among high achieving minority students. Research in Higher Education, 53(4), 383–405. doi: 10.1007/s11162-011-9238-z
- Milfort, M. (2012). An examination of the information technology job market credentials that work. Washington, DC: Jobs for the Future.
- National Center for Education Statistics. (2015a). Digest of educaiton statistics. Retrieved from https://nces.ed.gov/programs/digest/d14/tables/dt14_219.70.asp?current=yes/; https://nces.ed.gov/programs/digest/d14/tables/dt14_322.40.asp?current=yes
- National Center for Education Statistics. (2015b). Selected findings from PISA 2015. Retrieved June 27, 2017, from https://nces.ed.gov/surveys/pisa/pisa2015/pisa2015highlights_1.asp
- National Center for Science and Engineering Statistics. (2017). National science foundation women, minorities, and persons with disabilities in science and engineering: 2017. Retrieved June 27, 2017, from https://www.nsf.gov/news/news_images.jsp?cntn_id=190946&org=NSF
- National Math and Science Initiative. (2015). STEM education statistics. Retrieved from https://www.nms.org/AboutNMSI/TheSTEMCrisis/STEMEducationStatistics.aspx
- National Science Board. (2016). Science and engineering indicators 2016. Retrieved from https://www.nsf.gov/statistics/2016/nsb20161/#/digest/u-s-and-global-stem-education
- Obama, B. (2015). Investing in America’s future: Preparing students with STEM skills. Washington, DC: White House Office of Science and Technology Policy.
- Oldenziel, R. (1999). Making technology masculine: Men, women, and modern machines in America, 1870–1945. Amsterdam: Amsterdam University Press.
- O’Neal, L., Hale, T., & Cotten, S. (2011). The impact of information and communication technology (ICT) usage on depression among urban youth. Paper presented at the American Sociological Association Annual Meeting, Las Vegas, NV.
- Passel, J. S., & Cohn, D. (2008). U.S. Population projections: 2005–2050. Washington, DC: Pew Hispanic Center.
- Perez, T., Cromley, J., & Kaplan, A. (2014). The role of identity development, values, and costs in college STEM retention. Journal of Educational Psychology, 106(1), 315–329. doi: 10.1037/a0034027
- Robinson, L. (2009). A taste for the necessary. Information, Communication & Society, 12(4), 488–507. doi: 10.1080/13691180902857678
- Robinson, L. (2012). Information-seeking 2.0: The effects of informational advantage. RESET – Social Science Research on the Internet, 1(1), 89–115.
- Robinson, L. (2014). Endowed, entrepreneurial, and empowered-strivers: Doing a lot with a lot, doing a lot with a little. Information, Communication & Society, 17(5), 521–536. doi: 10.1080/1369118X.2013.770049
- Robinson, L., Cotten, S. R., Ono, H., Quan-Haase, A., Mesch, G., Chen, W., … Stern, M. J. (2015). Digital inequalities and why they matter. Information, Communication & Society, 18(5), 569–582. doi: 10.1080/1369118X.2015.1012532
- Schradie, J. (2012). The trend of class, race, and ethnicity in social media inequality: Who still cannot afford to blog? Information, Communication & Society, 15(4), 555–571. doi: 10.1080/1369118X.2012.665939
- Selwyn, N. (1997). Student’ attitudes toward computers: Validation of a computer attitude scale for 16–19 education. Computers & Education, 28(1), 35–41. doi: 10.1016/S0360-1315(96)00035-8
- Simoni, Z. R., Gibson, P., Cotten, S. R., Stringer, K., & Coleman, L. O. (2016). Does place matter? The effects of concentrated poverty on the computer use of elementary students. Journal of Urban Technology, 23(3), 3–21. doi: 10.1080/10630732.2015.1073901
- Simpkins, S., Davis-Kean, P., & Eccles, J. (2006). Math and science motivation: A longitudinal examination of the links between choices and beliefs. Developmental Psychology, 42(1), 70–83. doi: 10.1037/0012-1649.42.1.70
- Smith, A. (2010). Mobile access 2010 pew Internet and American life project. Washington, DC: Taylor Francis.
- Trautwein, U., Marsh, H., Nagengast, B., Ludtke, O., Nagy, G., & Jonkmann, K. (2012). Probing for the multiplicative term in modern expectancy-value theory: A latent interation modeling study. Journal of Educational Psychology, 104(3), 763–777. doi: 10.1037/a0027470
- Van Deursen, A., & Helsper, E. J. (2015). The third-level digital divide: Who benefits most from being online?. In L. Robinson, S. R. Cotten, J. Schulz, T. M. Hale & A. Williams (Eds.), Communication and information technologies annual (vol. 10, pp. 29–52). Emerald Group Publishing Limited.
- Van Deursen, A., & Van Dijk, J. (2013). The digital divide shifts to differences in usage. New Media Society, 16(3), 507–526. doi: 10.1177/1461444813487959
- Van Dijk, J., & Hacker, K. (2003). The digital divide as a complex and dynamic phenomenon. The Information Society, 19, 315–326. doi:10.1080/01972240390227895 doi: 10.1080/01972240309487
- Vernadakis, N., Kouli, O., Tsitskari, E., Gioftsidou, A., & Antoniou, P. (2014). University students’ ability-expectancy beliefs and subjective task values for exergames. Computers & Education, 75, 149–161. doi: 10.1016/j.compedu.2014.02.010
- Wigfield, A., & Cambria, J. (2010a). Expectancy-value theory: Retrospective and prospective. In T. Urdan & S. Karabenick (Eds.), The decade ahead: Theoretical perspectives on motivation and achievement (advances in motivation and achievement, volume 16 part A) (pp. 35–75). Emerald Group. Advance online publication.
- Wigfield, A., & Cambria, J. (2010b). Students’ achievement values, goal orientations, and interest: Definitions, development, and relations to achievement outcomes. Developmental Review, 30, 1–35. doi: 10.1016/j.dr.2009.12.001
- Wigfield, A., & Eccles, J. (2000). Expectancy-value theory of achievement motivation. Contemporary Educational Psychology, 25, 68–81. doi: 10.1006/ceps.1999.1015
- Wigfield, A., Tonks, S., & Klauda, S. L. (2009). Expectancy-value theory. In K. R. Wentzel & A. Wigfield (Eds.), Handbook of motivation in school (pp. 55–76). New York, NY: Routledge.
- Xiang, P., McBride, R., Guan, J., & Solmon, M. (2003). Children's motivation in elementary physical education: An expectancy-value model of achievement choice. Research Quarterly for Exercise and Sport, 74(1), 25–35. doi: 10.1080/02701367.2003.10609061
- Yager, J., Waitzkin, H., Parker, T., & Duran, B. (2007). Educating, training, and mentoring minority faculty and other trainees in mental health services research. Academic Psychiatry, 31(2), 146–151. doi: 10.1176/appi.ap.31.2.146
