
 ?Mathematical formulae have been encoded as MathML and are displayed in this HTML version using MathJax in order to improve their display. Uncheck the box to turn MathJax off. This feature requires Javascript. Click on a formula to zoom.
ABSTRACT
While ride-hailing ridership declined in 2020 due to COVID-19 induced restrictions like stay-at-home orders, food/grocery delivery services became quasi-essential. This study investigates if and how public perceptions of gig work related to platform-based ride-hailing and food/grocery delivery services changed during the early stages of the pandemic. We collected a sample of 23,845 Twitter posts (‘tweets’) related to these platform-based services within two-week periods before and after the US COVID-19 emergency declaration. Sentiment analysis on tweets was conducted to investigate changes in public perception of gig work. Tweet content was analyzed by descriptively coding about 10% of the sample of tweets manually along ten different dimensions (e.g., personal experience, informative, and about driver); then we used thematic analysis to gain an understanding about the public’s views towards gig work/workers. We tested supervised machine learning methods to explore their potential to classify the rest of the sample along the ten descriptive dimensions. The number of tweets increased by approximately 150% after the emergency declaration and became more positive in sentiment. Qualitative results indicate that tweets about negative personal experiences with drivers/companies decreased during COVID-19, while tweets exhibiting a sense of community (e.g., sharing information) and concern towards gig workers increased. Findings can inform policy and workforce changes regarding platform-based service companies.
Introduction
COVID-19 has resulted in a range of impacts across most US workforce segments. Understanding early pandemic impacts may yield insights that can help companies and workers to successfully navigate the continuing pandemic and future work. This study utilizes an exploratory approach to examine one segment of the workforce – gig workers – to determine whether, and if so how, public perceptions of gig work related to platform-based ride-hailing and food/grocery delivery services changed during the early stages of the pandemic. After a brief review of gig work, COVID-19 impacts on public perception of gig work, the role of public opinion on policymaking, and use of social media to study opinion, we discuss the data collection and analysis methods. Study results are presented. We conclude with a detailed discussion of our methods, findings, and study contributions.
Gig work
The flexibility of ‘gig work’ has attracted a large number of workers in recent years. Gig workers operate in less structured labor arrangements typically characterized by flexible working conditions (e.g., choice of working hours) and lack of job security and other employment benefits (e.g., paid sick leave) as a result of their lack of formal employer-employee relationship (Abraham et al., Citation2018). There is no universally accepted definition of gig work among researchers; however, it is most commonly used to refer to emerging ‘electronically mediated work’ or ‘online platform work’ (Current Population Survey staff, Citation2018). Gig workers use a company’s electronic platform (e.g., smartphone app) to connect to customers and obtain short tasks for which they get paid. This arrangement provides them with the flexibility to choose when and whether they want to work.
About 10.1% of US workers had ‘alternative employment arrangements’ in 2017, with about 1.0% making income through online platform work (Current Population Survey staff, Citation2018). The US transportation and utilities industry saw approximately a 50% increase in independent contractors between 2005 and 2017 (Abraham & Houseman, Citation2020), with this increase primarily attributed to the emergence of platform-based ride-hailing companies like Uber and Lyft (Paquette & Long, Citation2018).
Ride-hailing services are a form of shared mobility that features passengers connecting with independently working drivers (‘gig drivers’) using online platforms, typically smartphone apps, provided by platform-based ride-hailing companies, also known as transportation network companies (TNCs) (Shaheen et al., Citation2015). Gig drivers use their personal vehicle or arrange for a vehicle themselves to provide services. Similar to ride-hailing, platform-based food/grocery delivery services offered by delivery network companies (DNCs) like Grubhub and Instacart connect customers with gig drivers to get restaurant food or grocery items delivered to a prespecified location (Shaheen et al., Citation2015). In some cases, gig drivers also shop for grocery items in-store on behalf of customers. Some gig drivers hold both ride-hailing and food/grocery delivery jobs (Farrell et al., Citation2018). The present study focuses on these transportation sector platform-based gig workers – gig drivers using online platforms provided by TNCs and/or DNCs (T/DNCs) to connect with paying customers.
Lower and unstable income and lack of employment benefits are concerns for T/DNC drivers (Waheed et al., Citation2018). In 2014, Uber estimated that the median annual wage for drivers who work at least 40 hours a week is more than $90,000 in New York City and $74,000 in San Francisco (McFarland, Citation2014). However, most drivers don’t earn this amount (Farrell et al., Citation2018). Gig drivers bear fuel, insurance, maintenance, and depreciation vehicle costs (Henao & Marshall, Citation2019). Mean net earnings for TNC drivers after including expenses ranges from $5.72 to $10.46 per hour (Henao & Marshall, Citation2019). Average monthly earnings for T/DNC drivers fell by more than 50% and the portion of total income from driving decreased from 80% to 60% between 2013 ($1,469) and 2017 ($783) (Farrell et al., Citation2018). This decline is likely due to a reduction in driving hours caused by increasing driver competition. Several factors, such as consumer tips and surge pricing during peak hours, contribute to varying hourly wages for gig drivers.
Gig drivers, as independent contractors, are not entitled to employment benefits like health and unemployment insurance (Waheed et al., Citation2018). Labor advocates are pressuring platform-based companies to provide basic minimum wages and healthcare (Beckman et al., Citation2021). However, gig economy executives contend that this would put a significant financial strain on companies and decrease job flexibility (Khosrowshahi, Citation2020b).
Several T/DNCs have formed corporate alliances and lobbying groups to influence regulations in favor of maintaining the current employment status of gig drivers, raising questions from labor rights groups on the implications of such lobbying for US contingent workers (Pinto et al., Citation2019). The State of California’s Assembly Bill No. 5 that reclassified several gig workers from independent contractors to employees (California Assembly Bill No. 5, Citation2019) and the subsequent Proposition 22 that reverted their employment status to independent contractors is a prime example of TNC lobbying (Ballotpedia, Citationn.d.).
Impacts of COVID-19
The onset of the COVID-19 pandemic prompted federal and private changes in gig workers’ conditions. The US President declared COVID-19 a national emergency on 13 March 2020 (Proclamation No. 9994, Citation2020). Gig drivers faced exacerbated risks during COVID-19 due to COVID-19 exposure, as well as lack of benefits and lack of bargaining power to negotiate (Purkayastha et al., Citation2021). Some platform-based companies like Uber appealed to the government to provide their independent workers with economic aid and other benefits (Khosrowshahi, Citation2020a). On 27 March 2020, federal unemployment benefits were expanded to independent contractors through the Coronavirus Aid, Relief, and Economic Security Act (H.R.748 - CARES Act, Citation2020). State governments adapted unemployment policies relevant to gig workers in a disjointed fashion (Smith, Citation2020), resulting in no consistent national level gig worker aid eligibility (Lobel, Citation2020). Companies like Uber and Lyft offered paid sick leave to drivers during the 2020 US first shutdown after pressure from the public and policymakers (Katta et al., Citation2020; Lobel, Citation2020). Some companies also provided drivers with personal protective equipment (e.g., masks or hand sanitizer) for free or through company storefronts (Tripathi, Citation2020).
While TNCs attempted to persuade potential riders to use their services by mandating sanitation requirements (e.g., masks and hand sanitizer), this sometimes came at the expense of the drivers (Lobel, Citation2020). This may have worsened the pandemic economic situation of some drivers, as about 21% of drivers had no health insurance, nearly 15% relied on public assistance programs, and about 53% relied entirely on gig work for their income in the previous month (Benner et al., Citation2020).
Ride-hailing drivers (included under the ‘Taxi and Limousine Service’ industry) were listed as essential workers under recommended Vaccination Phase 1c (US Centers for Disease Control and Prevention, Citation2021). However, Phase 1c began two to three months after Phase 1a in most US states (Ballotpedia, Citation2021). Since gig drivers, like other transportation industry workers, have low telework ability (Dingel & Neiman, Citation2020) and they receive no or limited employment benefits, the delay in vaccine rollout may have prolonged their economic- and health-risks (Baker, Citation2020).
From an industry perspective, TNCs and DNCs experienced different impacts during the COVID-19 pandemic. Demand for ride-hailing services plummeted by almost 60-70% globally during early stages of the pandemic (Heineke et al., Citation2020). Conversely, food and grocery delivery services became quasi-essential, leading to unprecedented spikes in demand. Instacart added 300,000 new gig workers in late March of 2020 (Instacart, Citation2020). More than 55% of consumers that used online delivery services in one area of Portland, Washington metropolitan area reported ordering more deliveries during the pandemic (Unnikrishnan & Figliozzi, Citation2020). The increasing food/grocery delivery demand attracted a large number of people to work as gig drivers for DNCs (AppJobs Institute, Citation2020); many people turned to DNC gig work to address their immediate financial needs rather than waiting for government assistance (Ravenelle et al., Citation2021).
DNC gig drivers entered a unique position where their services provided users additional protection against COVID-19 exposure. However, drivers subsumed those exposure risks as they interacted with restaurant and grocery staff, as well as customers, until ‘no-contact deliveries’ became widely adopted (Tripathi, Citation2020). Part of what this study seeks to address is if the public noticed such changes in the working conditions of gig drivers and whether it changed their perception of gig drivers.
Public opinion and policy
Public perception and opinion can impact public policy (Page & Shapiro, Citation1983) as well as industry policy (Spears, Citation2021). Burstein (Citation2003) found that public opinion affected public policy nearly three-quarters of the time and that higher issue salience has an amplifying effect of public opinion on policy. Opinion-policy congruence exists to some degree in the US and is especially strong for high-salience issues (Manza et al., Citation2002). A study on the 2014 Ebola epidemic reported significant linkages between higher issue salience and altruistic behavioral intentions during a global health crisis (Yang, Citation2016). COVID-19 has led to heightened salience among the public of increased risk and altered working conditions across labor types, especially essential workers such as gig drivers (Mejia et al., Citation2021; Tripathi, Citation2020).
Legislators are responsive to issues discussed by the public on platforms like Twitter as it enables them to track public opinion and priorities (Barberá et al., Citation2019). For platform-based gig work, the case of California Proposition 22 demonstrates the importance of public opinion as well as corporate lobbying in influencing public policy. Further, consumers’ perceptions of company policies (e.g., labor practices) can affect their spending behavior and have economic ramifications for companies, as observed in T/DNCs (Belanche et al., Citation2021).
Social media
Social media websites generate immense amounts of diverse content pertaining to perception and opinions from a large population (Webb & Wang, Citation2013). While the efficacy of social media data in understanding public opinion is still open for debate (Edwards et al., Citation2013; Schober et al., Citation2016), it has changed how opinions are formed as the proportion of the US population seeking news on social media increased from 27% in 2013 to 48% in 2020, while TV and print news steadily declined (Newman et al., Citation2020). Accordingly, politicians strategically address their policy preferences to their constituents through social media platforms like Twitter (Hemphill et al., Citation2021). These platforms can provide an economical and efficient tool to gauge public opinion and its potential impact on public policy (Ceron & Negri, Citation2016); and social media data provide flexibility to analyze opinions at one point in time as well as their temporal evolution. Using emergent computational methods, such as machine learning (ML), allows researchers to draw insights from large volumes of social media data (Su et al., Citation2017). Conclusions drawn from social media analyses can align with those from survey data in terms of topic coverage, despite not having population coverage (Schober et al., Citation2016).
Twitter, a microblogging social media platform, is being increasingly used to assess public sentiment and perception of social issues, especially using content analysis methods (Oscar et al., Citation2017; Xiang et al., Citation2021). As of July 2021, Twitter had an estimated 77 million active users in the US (DataReportal, Citation2021). Twitter users are younger, more educated, wealthier, and more likely to be liberal – thus, not representative of the general US population (Wojcik & Hughes, Citation2019). However, opinion insights from social media can align with results from representative surveys of opinions through topic coverage that includes breadth and depth of issues (Schober et al., Citation2016).
COVID-19 research has utilized Twitter data to explore the nature of discussions of public health (Xiang et al., Citation2021), policy responses (Tsai & Wang, Citation2021), information-sharing (Saud et al., Citation2020), and labor conditions (Dubey & Tripathi, Citation2020). However, the coalescence of these topics on Twitter has not been explored for gig drivers. A recent study examined survey data measuring ride-hailing service usage before and during the COVID-19 pandemic with changes in public sentiments, emotions, and remarks towards ride-hailing services on Twitter (Morshed et al., Citation2021). However, they did not analyze tweet content to gain deeper insights into underlying themes of public discourse on Twitter.
The current study presents an exploratory analysis to identify emergent patterns in public discourse surrounding platform-based gig drivers before COVID-19 was declared a national emergency in the US and during the early stages of the pandemic using Twitter data.
Materials and methods
Data collection
We analyzed social media posts from Twitter (tweets) within two-week time windows before and after COVID-19 was declared as a US national emergency on 13 March 2020 (pre-COVID: 28 February 2020–12 March 2020; during-COVID: 13 March 2020–26 March 2020). We acquired publicly available tweets originating in the US and containing at least one of the keywords listed in between 28 February 2020 and 26 March 2020 using Salesforce’s Social Studio REST API v51.0 (Salesforce, Citationn.d.-a).
Table 1. Keywords and suggestive emojis used for sampling Twitter data.
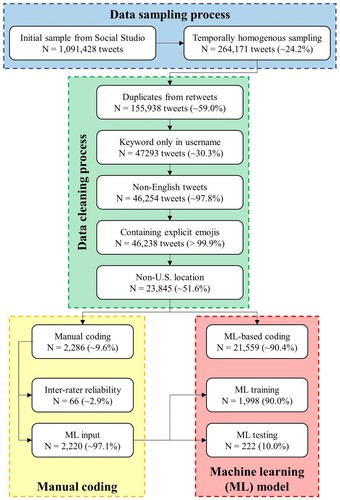
Social Studio flagged 1,091,428 tweets within our search parameters, distributed unequally between pre- and during-COVID time periods (see the Results section for more details). Previous literature on thematic analysis of Twitter data used an approximate temporally homogeneous distribution of tweets (Ahmed et al., Citation2017). Hence, we used the REST API to sample 450 tweets per hour from the flagged tweets (Salesforce, Citationn.d.-b) and acquired a total of 264,171 tweets, distributed approximately equally between pre- and during-COVID time periods. Tweet text and metadata were retrieved from their tweet ID using Twitter Standard API v1.1 (Twitter API, Citationn.d.).
Tweets were removed that: (1) were duplicates from retweets (i.e., users reposting identical content from another user), (2) contained the searched keywords only in the Twitter handle (username) of the user who posted the tweet, (3) were non-English language based on the identified language in the metadata provided by Twitter API, (4) contained any of the suggestive emojis (i.e., digital icons with a sexual connotation; Nexø & Strandell, Citation2020) illustrated in , and (5) were from outside the US or from unknown location (based on user-specified location in the metadata). Duplicates from retweets were removed to avoid a biased sample as we did not have data on other mechanisms (i.e., ‘likes’) through which Twitter users can voice their opinions. User-specified locations were parsed to identify the country using OpenStreetMap data implemented in Python’s geocoder v1.38.1 library (Carriere, Citationn.d.). illustrates the number and percentage of remaining tweets after each step of the data sampling and cleaning processes. The final sample included 23,845 tweets (about 9.0% of the temporally homogenous sample) within the time period of interest, with 11,312 tweets pre-COVID and 12,533 tweets during-COVID.
Figure 1. Twitter data sampling, cleaning, and subsetting.
The present study utilizes both manual and automated (based on ML) content analysis of the textual components of tweets. We retained non-suggestive emojis in our final sample as they are considered a textual component of tweets. However, we did not utilize website links or multimedia data (e.g., images and videos) embedded in tweets due to software and model limitations as discussed in the following sections.
Data analysis
Sentiment analysis
Sentiment analysis is a form of content analysis that implements supervised ML methods to determine the underlying sentiment or opinion of textual data (Desai & Mehta, Citation2017). We use Salesforce’s proprietary Sentiment Model to classify tweets as either positive, negative, or neutral in sentiment (Salesforce, Citationn.d.-c). The Sentiment Model is tuned to incorporate the effect of emojis embedded in the tweet, but not multimedia, in its sentiment coding.
Manual coding
Manual coding occurred in two phases using a random sample of about 10% of the tweets from the main dataset (N = 2,286). Descriptive coding of the content of the tweets occurred in phase one (Wolcott, Citation1994). The randomly sampled tweets were coded across seven dimensions adapted from McNeil et al. (Citation2012) and Oscar et al. (Citation2017) to understand stigma and overall public perception surrounding gig work: personal experience, informative, advice seeking, opinion, joke, ridicule, and miscellaneous. We coded three additional dimensions: about drivers, about company, and not relevant. About drivers and about company assessed whether a tweet was directed towards gig drivers or towards T/DNCs. The not relevant dimension accounted for tweets not related to platform-based gig work (e.g., tweets using the keyword ‘uber’ in its semantic context). details these dimensions. A tweet could be classified into multiple dimensions, except for miscellaneous and not relevant which were exclusive dimensions. To establish inter-rater reliability, three researchers initially coded 125 tweets together to achieve a kappa value greater than 0.80. The coding from this round was discarded, and these tweets were shuffled back into the data. Each researcher then independently coded 806 tweets, with 66 common tweets among them used to verify a kappa value of greater than 0.80 (Cohen, Citation1960; Stemler & Tsai, Citation2008).
Table 2. Descriptions of topical coding dimensions.
During the second phase of manual coding (i.e., thematic analysis), a subsample of coded tweet data, excluding the tweets previously coded as not relevant, were analyzed. A single researcher reviewed the tweets multiple times to inductively develop larger themes related to public perception of platform-based gig drivers (Nowell et al., Citation2017).
Machine learning model
This study explores the efficacy of using ML methods to descriptively code the remainder of the data (N = 21,559) along the ten dimensions. We developed a supervised ML model for each of our ten topical dimensions by adapting Oscar et al.’s (Citation2017) model. We used Oscar et al. (Citation2017)’s model due to similarities in data source (i.e., Twitter) and the coded topical dimensions. Their results serve as a point of comparison for us to determine the performance of ML methods to expand manual coding results using our data. The supervised ML model was trained using 90% of 2,220 independently manually coded tweets (i.e., 2,286 manually coded tweets minus 66 commonly coded tweets). The remaining 10% of the tweets were used to test model performance. illustrates the data subsetting for the ML model. The ML model analyzes the textual component, ignoring associated multimedia, of a tweet to determine whether it belongs to a particular topical coding dimension independent of other dimensions. We enforced two additional rules to the model output to remain consistent with the dimension definitions (). First, tweets classified as not relevant by the model were exclusively considered not relevant even if they were assigned in other dimensions by the model. Second, to comply with the dimension description (see ), tweets classified as miscellaneous by the model were not considered miscellaneous if the model also assigned them any other dimension.
To determine the effectiveness and usability of the ML model, testing accuracy (i.e., the percentage of ML predictions matching the manual coding classification) for each dimension is compared with the corresponding simple majority classifier (SMC) (Oscar et al., Citation2017). SMC is the testing accuracy for a base model that predicts all instances as the classification with most instances. A higher testing accuracy compared to SMC is indicative of a more accurate classifier. We also calculated Cohen’s kappa for each dimension to assess the inter-rater reliability for providing a standardized machine performance assessment (Zhai et al., Citation2021).
Results
Descriptive analysis
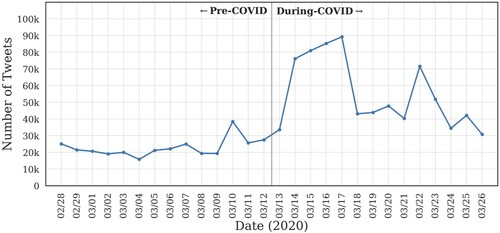
The volume trend of flagged tweets (see ) shows a significant spike in the number of tweets following the COVID-19 national emergency declaration on 13 March 2020. On average, 22,896 and 56,716 tweets per day were flagged for pre-COVID and during-COVID periods, respectively, which corresponds to an almost 150% increase in volume. Platform-based gig work received increased public attention on Twitter during the early days of COVID-19.
Figure 2. Volume trend of tweets between 28 February 2020 and 26 March 2020 (N = 1,091,428).
Sentiment analysis
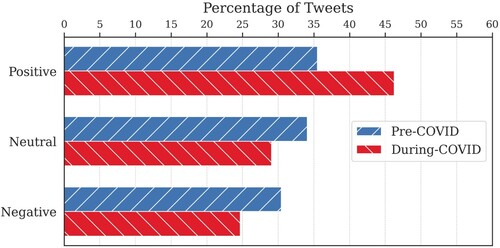
Sentiment was calculated for the entire 23,845 tweet sample. The sentiment of pre-COVID tweets was about equally distributed (see ), with a slightly higher percentage of positive tweets (4,016 tweets, or 36%) compared to negative (3,853 tweets, or 34%) and neutral (3,443 tweets, or 30%). There was an increase in positive tweets (+10%) during COVID-19 (5,797 tweets, or 46%), while both neutral (3,094 tweets, or 25%) and negative (3,642 tweets, or 29%) tweets saw similar declines. Differences in the sentiment between pre- and during-COVID tweets were statistically significant ( = 286.0, df = 2, p < 0.001).
Figure 3. Distribution of tweet sentiment pre- and during-COVID (N = 23,845).
We also investigated the change in sentiment by users. Our sample contained 9,775 and 11,297 unique users who tweeted pre- and during-COVD, respectively. Among them, 506 ‘common’ users tweeted within both time periods, with a total of 1,140 tweets pre-COVID and 863 tweets during-COVID. The proportion of positive and negative sentiment tweets from these common users were 30.8% (351 tweets) and 40.7% (464 tweets), respectively, pre-COVID and 35.1% (303 tweets) and 36.5% (315 tweets), respectively, during-COVID. Although the absolute sentiment proportions for these common users differ from that of the entire sample, they exhibit a similar general trend with an increase in positive sentiment during-COVID.
Manual coding
Descriptive coding
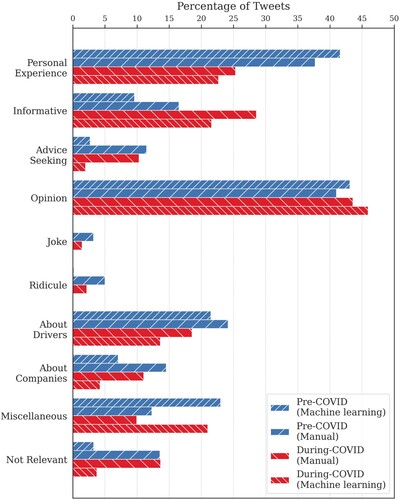
details the distribution of topical dimensions of manually coded tweets. Most tweets were classified as opinion and personal experience. However, the percentage of personal experience decreased (−12.4%) during-COVID while the percentage of opinion slightly increased (+2.5%). After the COVID-19 emergency declaration, there was an increase in the informative tweets (+12.1%). While the percentage of tweets coded as about drivers (−5.6%), about companies (−3.5%), advice seeking (−1.1%), and miscellaneous (−2.4%) decreased slightly after the declaration. Although the reduction in percentages of joke and ridicule tweets during-COVID in absolute terms is lower, their proportion during-COVID decreased relative to pre-COVID.
Figure 4. Distribution of dimensions for manual topical coding (N = 2,220) and topical coding from machine learning output (N = 21,559).
Thematic analysis
Three themes emerged from the thematic analysis of the manually coded tweets (N = 2,286): individual experiences, unity, and concern for gig drivers. See for detailed theme descriptions.
Table 3. Descriptions of themes identified in the data.
Individual experiences
Prior to COVID-19, tweets were predominately about individual experiences with gig workers. Most of these experiences were negative and focused on issues with the gig workers personality (e.g., silent, antisocial, rude), quality of service (e.g., canceled ride, bad/no music playing in car, long wait time, missing items, assaulted passenger, car odor), or driving capabilities (e.g., too fast/slow, almost hit someone, blocked crosswalk). For example:
@DoorDash_Help have used your service 4 times and still can’t get a seamless delivery.
Missing ingredients in food and a rude driver. Not sure how you still exist – tweeted on 20 February 2020
Lyft and uber are so expensive now, they aren’t even worth it – tweeted on 9 March 2020
my uber drivers and i always end up becoming friends by the time i reach my destination hahaha extrovert lifeee – tweeted on 4 March 2020
Unity
During COVID-19, the tweets evolved from an undertone of ‘I’ to an undertone of ‘we.’ Tweets centered around the importance of gig workers and being appreciative of their services during COVID-19. Tweeters expressed gratitude toward gig workers and/or encouraged others to tip gig workers well.
If you’re getting things delivered- food, groceries, etc. - make sure you’re tipping your delivery person, and tipping them well. This may be all they’ve got right now, and as much as they want to be home, quarantined … they’re out helping everyone stay safer. – tweeted on 19 March 2020
If you're looking online, keep cart full in instacart. Sometimes it'll say no slots until weekend, but both times I ordered & later, had openings today as they caught up. Mine said delivery in 5 hrs, but she shopped/delivered right away. – tweeted on 25 March 2020
Concern for gig drivers
Present in both the pre-and during-COVID tweets, concern for gig drivers was communicated by tweeters who were frustrated that gig workers had a high risk for COVID-19 exposure but at the same time could not afford to miss work because they do not get paid enough.
If you order groceries today, realize that the delivery workers are likely ‘freelance’ workers with NO health benefits, paid payroll taxes, unemployment or worker’s comp. Tip them in sanitized CASH so the app company can’t steal it. #PSA #essentialworkers #instacart #labor – tweeted on 20 March 2020
Are you deaf- misclassified U\L drivers forced into a sharecropper arrangement and are forced to work while ill b\c they owe their souls to the company - endangering us all. If they were employees they’d have - PSD, health insurance, unemployment benefits. – tweeted on 12 March 2020
@Uber @lyft how about Lyft and Uber up their fares slightly and give their employees health benefits? – tweeted on 13 March 2020
if you are planning on eating out or getting delivery i urge you to tip and tip WELL. 20% MINIMUM. if you think corona is scary, just think of all the people who are risking their health and safety to get your food to you – tweeted on 18 March 2020
Machine learning model
Our ML model did not perform well on several dimensions. The testing accuracies for the ten topical dimensions ranged from 63% to 97% and the differences between testing accuracies and SMCs (‘Diff’) ranged from −12.61% to 13.06%, indicating that SMC worked better than our model for some dimensions. To compare, Oscar et al. (Citation2017) reported testing accuracies between 86% and 95% and Diff between 5% and 38%. The distribution of these topical dimensions for the tweets classified using ML (N = 21,559) is representative of the smaller manually coded sample, as illustrated in .
Unlike testing accuracy and SMC, Cohen’s kappa is able to provide insights on inter-rater reliability between the ML model and human coders. For all dimensions except personal experience and about drivers, the kappa values were below 0.50 (ranging from 0.00–0.63), indicating an overall poor performance of the ML model. presents machine model performance measures for each dimension.
Table 4. Machine learning model performance measures (N = 222).
Discussion
Not only did the COVID-19 pandemic reveal critical shortcomings of the US labor market, such as the lack of protection for gig workers, but it also directed public attention towards such issues (Katta et al., Citation2020; Mejia et al., Citation2021). In this exploratory study, we examined how the public perception of gig drivers evolved during the early stages of the COVID-19 pandemic on Twitter.
Our results illustrate several changes in different aspects of public perception of platform-based gig drivers. The volume trend of tweets indicates that platform-based gig work received more attention on Twitter during the onset of the pandemic emergency mandate as opposed to two weeks prior to the mandate. Further, overall sentiment of sampled tweets became more positive during the pandemic. There was also a shift in the focus of public discourse from ride-hailing services to delivery services during COVID-19, which is consistent with the changing demands for platform-based services and labor shifts during COVID-19 (Heineke et al., Citation2020).
Prior to the national emergency declaration, most of the tweets were negative towards gig drivers and T/DNCs. However, tweets referenced fewer personal experiences related to T/DNCs during the pandemic, most likely because of fewer opportunities to interact with drivers, especially in ride-hailing services. Supporting prior research (Saud et al., Citation2020), we found that informative tweets surged after the emergency declaration as the Twitter community shared information about safety and service/goods availability to help each other in the wake of the pandemic. Although the proportion of opinions posted on Twitter did not change much after the COVID-19 emergency, they exhibited more concern for gig drivers’ safety and working conditions and urged other tweeters, T/DNCs, and the government to support gig drivers.
Although our ML model did not perform well, our results reflect a similar trend found in Oscar et al.’s (Citation2017) study, where ML classifications were more effective than that of simple majority classifier for topical dimensions with lower SMC values. For our data, this is shown by the improved performance compared to SMC in personal experience, opinion, and about drivers dimensions. Our ML model also had low kappa values (less than 0.63), which is not uncommon for ML models (Ullmann, Citation2019). Our exploratory approach of using ML model demonstrates some potential benefits of using such computational methods in topical coding of tweets for topics that are more prevalent in the data.
Lack of bargaining power and unionization have been identified as barriers to gig workers securing health protections and benefits from T/DNCs companies (Purkayastha et al., Citation2021), but several protests organized by gig workers early in the pandemic received national media attention (Lobel, Citation2020). The increased discussion, positive perception, and newfound empathy towards gig drivers on Twitter during the pandemic, as illustrated by our results, may indicate broader demand for better working conditions and employment benefits from T/DNC companies and support of these efforts by workers. Perhaps labor advocates can take advantage of the apparent public awareness/concern for gig workers and communicate to voters and policymakers how benefits would have improved workers’ outlook during COVID-19. However, we suspect that labor advocates will need to contend with competing narratives from T/DNCs. Going forward, a key challenge for labor advocates will be to maintain this positive momentum and achieve tangible policy outcomes while it lasts (Mejia et al., Citation2021).
The study has a few limitations. First, although diverse, Twitter users are not representative of the US population (Wojcik & Hughes, Citation2019), which affects the generalizability of our results. Second, our keywords list included the most popular terms related to platform-based gig drivers, but it was not exhaustive. Thus, bias may have been introduced if tweets that were relevant, but did not contain a keyword, were missed in data collection. Third, the ML model was trained to classify each topical dimension independently. Although this allowed us to train the model using a relatively lower sample size that required substantial manual coding efforts, it fails to capture the intrinsic relationships between different dimensions. Our ML model could potentially perform better for data with lower interrelationships between the topical dimensions. Future research exploring ML methods in descriptive coding could either train the model on multiple dimensions simultaneously (but would require larger training dataset and more manual coding effort) or could use more advanced ML approaches such as deep learning.
In sum, this study illustrates how Twitter data can be used as an exploratory tool to examine public perceptions of segments of the platform/gig workforce during the COVID-19 pandemic. While the results of this study reveal that perception of the gig workforce became more positive after the emergency declaration and that the content of tweets also evolved, further research is needed to determine if similar results are found among more nationally representative samples and if these positive perceptions will remain as the COVID-19 pandemic continues to linger and evolve in the US.
Disclosure statement
No potential conflict of interest was reported by the author(s).
Additional information
Funding
Notes on contributors
Shubham Agrawal
Shubham Agrawal (Ph.D., Purdue University) is a postdoctoral fellow in the Department of Sociology, Anthropology and Criminal Justice. He received his Ph.D. in Transportation Engineering from Purdue University. He is currently investigating the impacts of automated vehicles on the driving workforce and developing strategies to prepare the future workforce for the transition. His other research interests include traveler behavior and cognition, emerging transportation technologies, alternative fuel vehicles, and smart mobility.
Amy M. Schuster
Amy M. Schuster (Ph.D., University of Kentucky) is a postdoctoral fellow in the Department of Sociology, Anthropology, and Criminal Justice at Clemson University. She earned her Ph.D. in Gerontology from the University of Kentucky, MSW from the University of Georgia, and BSW from Florida State University. Amy’s research interests have developed from her years of work experience as a social worker in a long-term care setting. She is particularly interested in information and communication technology use by older adults.
Noah Britt
Noah Britt is a junior at Clemson University majoring in computer science (BS), and most of his work revolves around analyzing social media data. He previously worked as an intern with the Social Media Listening Center at Clemson University.
Jessica Liberman
Jessica Liberman (B.A., Southern Illinois University of Carbondale) is a M.S. candidate in the Social Science program of the Department of Sociology, Anthropology, and Criminal Justice at Clemson University. She received her Bachelor of Arts in Sociology from Southern Illinois University of Carbondale in 2018. She currently works as a research assistant on the NSF project WEAVE: Preparing the Workforce for the Era of Automated Vehicles, applying methods of sociological inquiry to the project’s goals of workforce development.
Shelia R. Cotten
Shelia R. Cotten (Ph.D., North Carolina State University) is the Associate Vice President for Research Development and Provost’s Distinguished Professor at Clemson University. Her research examines emerging technologies and their impacts on quality of life, health, workforce, and educational outcomes. Her research has been funded by the National Science Foundation, National Institute on Aging, American Center for Mobility, and other organizations. She is a former Chair of the American Sociological Association’s Communication, Information Technologies, and Media Sociology (CITAMS) section; she won the Public Sociology and the William F. Ogburn Senior Career Awards from the CITAMS section. Prior to joining Clemson University in August 2020, she was an MSU Foundation Professor in the Department of Media and Information at Michigan State University.
References
- Abraham, K. G., Haltiwanger, J. C., Sandusky, K., & Spletzer, J. R. (2018). Measuring the gig economy: Current knowledge and open issues (No. w24950). National Bureau of Economic Research. https://doi.org/https://doi.org/10.3386/w24950.
- Abraham, K. G., & Houseman, S. N. (2020). Contingent and alternative employment: Lessons from the contingent worker supplement, 1995-2017. Prepared for the US Department of Labor. https://www.dol.gov/agencies/oasp/evaluation/completedstudies/contingent-alternative-employment
- Ahmed, W., Demaerini, G., & Bath, P. A. (2017, March 22–25). Topics discussed on Twitter at the beginning of the 2014 Ebola epidemic in United States. iConference 2017 proceedings, Wuhan, China, March 22-25, 2017. 774–777. https://doi.org/https://doi.org/10.9776/17338.
- AppJobs Institute. (2020). How does the COVID-19 outbreak affect the life of freelancers & gig workers. https://institute.appjobs.com/how-does-the-covid-19-outbreak-affect-the-life-of-freelancers-gig-workers-march-2020
- Baker, M. G. (2020). Nonrelocatable occupations at increased risk during pandemics: United States, 2018. American Journal of Public Health, 110(8), 1126–1132. https://doi.org/https://doi.org/10.2105/AJPH.2020.305738
- Ballotpedia. (2021, September 23). Coronavirus (COVID-19) vaccination rates and distribution plans by state. Retrieved September 27, 2021, from https://ballotpedia.org/Coronavirus_(COVID-19)_vaccination_rates_and_distribution_plans_by_state
- Ballotpedia. (n.d.). California Proposition 22, App-Based Drivers as Contractors and Labor Policies Initiative (2020). Retrieved September 27, 2021, from https://ballotpedia.org/California_Proposition_22,_App-Based_Drivers_as_Contractors_and_Labor_Policies_Initiative_(2020)
- Barberá, P., Casas, A., Nagler, J., Egan, P. J., Bonneau, R., Jost, J. T., & Tucker, J. A. (2019). Who leads? Who follows? Measuring issue attention and agenda setting by legislators and the mass public using social media data. American Political Science Review, 113(4), 883–901. https://doi.org/https://doi.org/10.1017/S0003055419000352
- Beckman, K. L., Monsey, L. M., Archer, M. M., Errett, N. A., Bostrom, A., & Baker, M. G. (2021). Health and safety risk perceptions and needs of app-based drivers during COVID-19. American Journal of Industrial Medicine, 941–951. https://doi.org/https://doi.org/10.1002/ajim.23295
- Belanche, D., Casaló, L. V., Flavián, C., Pérez-Rueda, A., & Pérez-Rueda aperu, A. (2021). The role of customers in the gig economy: How perceptions of working conditions and service quality influence the use and recommendation of food delivery services. Service Business, 15(1), 45–75. https://doi.org/https://doi.org/10.1007/s11628-020-00432-7
- Benner, C., Johanss, E., Feng, K., & Witt, H. (2020). On-demand and on-the-edge: Ride hailing and delivery workers in San Francisco. UCSC Institute for Social Transformation. https://transform.ucsc.edu/on-demand-and-on-the-edge/
- Burstein, P. (2003). The impact of public opinion on public policy: A review and an agenda. Political Research Quarterly, 56(1), 29–40. https://doi.org/https://doi.org/10.1177/106591290305600103
- California Assembly Bill No. 5, 341. (2019). (Testimony of Supreme Court of California). https://leginfo.legislature.ca.gov/faces/billTextClient.xhtml?bill_id = 201920200AB5
- Carriere, D. (n.d.). Geocoder: Simple, Consistent. Retrieved September 6, 2021, from https://geocoder.readthedocs.io/
- Ceron, A., & Negri, F. (2016). The “social side” of public policy: Monitoring online public opinion and its mobilization during the policy cycle. Policy & Internet, 8(2), 131–147. https://doi.org/https://doi.org/10.1002/poi3.117
- Cohen, J. (1960). A coefficient of agreement for nominal scales. Educational and Psychological Measurement, 20(1), 37–46. https://doi.org/https://doi.org/10.1177/001316446002000104
- Current Population Survey staff. (2018). Electronically mediated work: New questions in the contingent worker supplement. Monthly Labor Review, 2018(9), https://doi.org/https://doi.org/10.21916/mlr.2018.24
- DataReportal. (2021). Twitter Stats and Trends. Retrieved September 27, 2021, from https://datareportal.com/essential-twitter-stats
- Desai, M., & Mehta, M. A. (2017). Techniques for sentiment analysis of Twitter data: A comprehensive survey. Proceeding – IEEE International Conference on Computing, Communication and Automation, ICCCA 2016, 149–154. https://doi.org/https://doi.org/10.1109/CCAA.2016.7813707.
- Dingel, J. I., & Neiman, B. (2020). How many jobs can be done at home? Journal of Public Economics, 189, 104235. https://doi.org/https://doi.org/10.1016/j.jpubeco.2020.104235
- Dubey, A. D., & Tripathi, S. (2020). Analysing the sentiments towards work-from-home experience during COVID-19 pandemic. Journal of Innovation Management, 8(1), 13–19. https://doi.org/https://doi.org/10.24840/2183-0606_008.001_0003
- Edwards, A., Housley, W., Williams, M., Sloan, L., & Williams, M. (2013). Digital social research, social media and the sociological imagination: Surrogacy, augmentation and re-orientation. International Journal of Social Research Methodology, 16(3), 245–260. https://doi.org/https://doi.org/10.1080/13645579.2013.774185
- Farrell, D., Greig, F., & Hamoudi, A. (2018). The online platform economy in 2018: Drivers, workers, sellers, and lessors. JPMorgan Chase Institute. https://www.jpmorganchase.com/content/dam/jpmc/jpmorgan-chase-and-co/institute/pdf/institute-ope-2018.pdf
- Heineke, K., Kloss, B., & Scurtu, D. (2020, July 16). The future of micromobility: Ridership and revenue after a crisis. McKinsey Center for Future Mobility. Retrieved on August 23, 2021, from https://www.mckinsey.com/industries/automotive-and-assembly/our-insights/the-future-of-micromobility-ridership-and-revenue-after-a-crisis
- Hemphill, L., Russell, A., & Schöpke-Gonzalez, A. M. (2021). What drives U.S. Congressional members’ policy attention on Twitter? Policy & Internet, 13(2), 233–256. https://doi.org/https://doi.org/10.1002/poi3.245
- Henao, A., & Marshall, W. E. (2019). An analysis of the individual economics of ride-hailing drivers. Transportation Research Part A: Policy and Practice, 130, 440–451. https://doi.org/https://doi.org/10.1016/j.tra.2019.09.056
- H.R.748 – CARES Act. (2020). (Testimony of Joe Courtney). https://www.congress.gov/bill/116th-congress/house-bill/748
- Instacart. (2020, March 23). Instacart announces plans to bring on 300,000 new personal shoppers over the next 3 months. PRNewswire. https://www.prnewswire.com/news-releases/instacart-announces-plans-to-bring-on-300-000-new-personal-shoppers-over-the-next-3-months-301028409.html
- Katta, S., Badger, A., Graham, M., Howson, K., Ustek-Spilda, F., & Bertolini, A. (2020). (Dis)embeddedness and (de)commodification: COVID-19, Uber, and the unravelling logics of the gig economy. Dialogues in Human Geography, 10(2), 203–207. https://doi.org/https://doi.org/10.1177/2043820620934942
- Khosrowshahi, D. (2020a, March 23). Letter to the President. Uber. https://blogadmin.uberinternal.com/wp-content/uploads/2020/03/UberLetter.pdf
- Khosrowshahi, D. (2020b, October 5). The high cost of making drivers employees. Uber Newsroom. https://www.uber.com/en-CA/newsroom/economic-impact/
- Lobel, O. (2020). We are all gig workers now: Online platforms, freelancers and the battles over employment status and rights during the COVID-19 pandemic. SSRN Electronic Journal, 57(4), 919–946. https://doi.org/https://doi.org/10.2139/ssrn.3725090
- Manza, J., Cook, F. L., & Page, B. I. (2002). Navigating public opinion. Oxford University Press, Incorporated.
- McFarland, M. (2014, May 27). Uber’s remarkable growth could end the era of poorly paid cab drivers. Washington Post. https://www.washingtonpost.com/news/innovations/wp/2014/05/27/ubers-remarkable-growth-could-end-the-era-of-poorly-paid-cab-drivers/
- McNeil, K., Brna, P. M., & Gordon, K. E. (2012). Epilepsy in the Twitter era: A need to re-tweet the way we think about seizures. Epilepsy & Behavior, 23(2), 127–130. https://doi.org/https://doi.org/10.1016/j.yebeh.2011.10.020
- Mejia, C., Pittman, R., Beltramo, J. M. D., Horan, K., Grinley, A., & Shoss, M. K. (2021). Stigma & dirty work: In-group and out-group perceptions of essential service workers during COVID-19. International Journal of Hospitality Management, 93, 102772. https://doi.org/https://doi.org/10.1016/j.ijhm.2020.102772
- Morshed, S. A., Khan, S. S., Tanvir, R. B., & Nur, S. (2021). Impact of COVID-19 pandemic on ride-hailing services based on large-scale Twitter data analysis. Journal of Urban Management, 10(2), 155–165. https://doi.org/https://doi.org/10.1016/j.jum.2021.03.002
- Newman, N., Fletcher, R., Schulz, A., Andı, S., & Nielsen, R. K. (2020). Reuters Institute digital news report 2020. Reuters Institute for the Study of Journalism. https://reutersinstitute.politics.ox.ac.uk/sites/default/files/2020-06/DNR_2020_FINAL.pdf
- Nexø, L. A., & Strandell, J. (2020). Testing, filtering, and insinuating: Matching and attunement of emoji use patterns as non-verbal flirting in online dating. Poetics, 83, 101477. https://doi.org/https://doi.org/10.1016/j.poetic.2020.101477
- Nowell, L. S., Norris, J. M., White, D. E., & Moules, N. J. (2017). Thematic analysis: Striving to meet the trustworthiness criteria. International Journal of Qualitative Methods, 16(1), https://doi.org/https://doi.org/10.1177/1609406917733847
- Oscar, N., Fox, P. A., Croucher, R., Wernick, R., Keune, J., & Hooker, K. (2017). Machine learning, sentiment analysis, and tweets: An examination of Alzheimer’s disease stigma on Twitter. The Journals of Gerontology: Series B, 72(5), 742–751. https://doi.org/https://doi.org/10.1093/geronb/gbx014
- Page, B. I., & Shapiro, R. Y. (1983). Effects of public opinion on policy. American Political Science Review, 77(1), 175–190. https://doi.org/https://doi.org/10.2307/1956018
- Paquette, D., & Long, H. (2018, June 7). America’s gig economy is smaller now than before Uber existed, official data show. The Washington Post. https://www.washingtonpost.com/news/wonk/wp/2018/06/07/there-are-fewer-workers-in-the-gig-economy-today-than-before-uber-existed-official-data-show/
- Pinto, M., Smith, R., & Tung, I. (2019). Rights at risk: Gig companies’ campaign to upend employment as we know it. National Employment Law Project. https://www.nelp.org/publication/rights-at-risk-gig-companies-campaign-to-upend-employment-as-we-know-it/
- Proclamation No. 9994. (2020). 85 F.R. 15337 (March 18, 2020). https://www.federalregister.gov/documents/2020/03/18/2020-05794/declaring-a-national-emergency-concerning-the-novel-coronavirus-disease-covid-19-outbreak
- Purkayastha, D., Vanroelen, C., Bircan, T., Vantyghem, M. A., & Gantelet Adsera, C. (2021). Work, health and COVID-19: A literature review. SSRN Electronic Journal, https://doi.org/https://doi.org/10.2139/ssrn.3856915
- Ravenelle, A. J., Kowalski, K. C., & Janko, E. (2021). The side hustle safety net: Precarious workers and gig work during COVID-19. Sociological Perspectives, https://doi.org/https://doi.org/10.1177/07311214211005489
- Salesforce. (n.d.-a). Introducing Social Studio REST API. Social Studio API Developer’s Guide. Retrieved September 28, 2021, from https://developer.salesforce.com/docs/atlas.en-us.230.0.api_social.meta/api_social/1-introduction-to-the-social-studio-marketing-cloud.htm
- Salesforce. (n.d.-b). Posts. Social Studio API Developer’s Guide. Retrieved September 28, 2021, from https://developer.salesforce.com/docs/atlas.en-us.230.0.api_social.meta/api_social/14-posts.htm
- Salesforce. (n.d.-c). Sentiment Model. Retrieved July 15, 2021, from https://help.salesforce.com/articleView?id = sf.mc_ss_sentiment_model.htm
- Saud, M., Mashud, M., & Ida, R. (2020). Usage of social media during the pandemic: Seeking support and awareness about COVID-19 through social media platforms. Journal of Public Affairs, 20(4), e02417. https://doi.org/https://doi.org/10.1002/pa.2417
- Schober, M. F., Pasek, J., Guggenheim, L., Lampe, C., & Conrad, F. G. (2016). Social media analyses for social measurement. Public Opinion Quarterly, 80(1), 180–211. https://doi.org/https://doi.org/10.1093/poq/nfv048
- Shaheen, S., Chan, N., Bansal, A., & Cohen, A. (2015). Shared Mobility: A Sustainability & Technologies Workshop: Definitions, Industry Developments, and Early Understanding. https://escholarship.org/uc/item/2f61q30s
- Smith, R. (2020). Independent contractors & COVID-19: Working without protections. National Employment Law Project. https://www.nelp.org/publication/independent-contractors-covid-19-working-without-protections/
- Spears, R. (2021). The impact of public opinion on large global companies’ market valuations: A Markov switching model approach. Journal of Finance and Economics, 9(3), 115–141. https://doi.org/https://doi.org/10.12691/jfe-9-3-3
- Stemler, S. E., & Tsai, J. (2008). Best practices in interrater reliability three common approaches. In J. Osborne (Ed.), Best practices in quantitative methods (pp. 29–49). SAGE Publications, Inc. https://doi.org/https://doi.org/10.4135/9781412995627.d5.
- Su, L. Y.-F., Cacciatore, M. A., Liang, X., Brossard, D., Scheufele, D. A., & Xenos, M. A. (2017). Analyzing public sentiments online: Combining human- and computer-based content analysis. Information, Communication & Society, 20(3), 406–427. https://doi.org/https://doi.org/10.1080/1369118X.2016.1182197
- Tripathi, S. (2020). Companies, COVID-19 and respect for human rights. Business and Human Rights Journal, 5(2), 252–260. https://doi.org/https://doi.org/10.1017/bhj.2020.16
- Tsai, M. H., & Wang, Y. (2021). Analyzing Twitter data to evaluate people’s attitudes towards public health policies and events in the era of COVID-19. International Journal of Environmental Research and Public Health, 18(12), 6272. https://doi.org/https://doi.org/10.3390/ijerph18126272
- Twitter API. (n.d.). Twitter Standard API v1.1. Retrieved September 7, 2021, from https://developer.twitter.com/en/docs/twitter-api/v1
- Ullmann, T. D. (2019). Automated analysis of reflection in writing: Validating machine learning approaches. International Journal of Artificial Intelligence in Education, 29(2), 217–257. https://doi.org/https://doi.org/10.1007/s40593-019-00174-2
- Unnikrishnan, A., & Figliozzi, M. (2020). A study of the impact of COVID-19 on home delivery purchases and expenditures [Working Paper]. Portland State University. https://archives.pdx.edu/ds/psu/33410
- US Centers for Disease Control and Prevention. (2021). Interim list of categories of essential workers mapped to standardized industry codes and titles. https://www.cdc.gov/vaccines/covid-19/categories-essential-workers.html
- Waheed, S., Herrera, L., Gonzalez-Vasquez, A. L., Shadduck-Hernández, J., Koonse, T., & Leynov, D. (2018). More than a gig: A survey of ride-hailing drivers in Los Angeles. Institute for Research on Labor and Employment. https://www.labor.ucla.edu/publication/more-than-a-gig/
- Webb, L. M., & Wang, Y. (2013). Techniques for sampling online text-based data sets. In Big data management, technologies, and applications (pp. 95–114). IGI Global. https://doi.org/https://doi.org/10.4018/978-1-4666-4699-5.ch005.
- Wojcik, S., & Hughes, A. (2019). Sizing up Twitter users. Pew Research Center. https://www.pewresearch.org/internet/2019/04/24/sizing-up-twitter-users/
- Wolcott, H. F. (1994). Transforming qualitative data: Description, analysis, and interpretation. Sage.
- Xiang, X., Lu, X., Halavanau, A., Xue, J., Sun, Y., Lai, P. H. L., & Wu, Z. (2021). Modern senicide in the face of a pandemic: An examination of public discourse and sentiment about older adults and COVID-19 using machine learning. The Journals of Gerontology: Series B, 76(4), e190–e200. https://doi.org/https://doi.org/10.1093/geronb/gbaa128
- Yang, Z. J. (2016). Altruism during Ebola: Risk perception, issue salience, cultural cognition, and information processing. Risk Analysis, 36(6), 1079–1089. https://doi.org/https://doi.org/10.1111/risa.12526
- Zhai, X., Shi, L., & Nehm, R. H. (2021). A meta-analysis of machine learning-based science assessments: Factors impacting machine-human score agreements. Journal of Science Education and Technology, 30(3), 361–379. https://doi.org/https://doi.org/10.1007/s10956-020-09875-z