
 ?Mathematical formulae have been encoded as MathML and are displayed in this HTML version using MathJax in order to improve their display. Uncheck the box to turn MathJax off. This feature requires Javascript. Click on a formula to zoom.
ABSTRACT
This paper focuses on the labour disparities between Sub-Saharan African immigrants in the Netherlands, a hitherto undescribed ethnic group, and the native Dutch population. Using unique data with nationwide coverage, the analysis reveals that the labour market position of Sub-Saharan Africans displays an exceptionally large disparity with the native Dutch, compared with discrepancies found in previous research on other immigrant groups. The outcomes also show great differences across the Sub-Saharan groups with Cape Verdeans and South Africans deviating the least from the native Dutch, Ghanaians occupying an intermediate position, while people from Somalia, Eritrea, Congo, Sudan and Sierra Leone are in the worst position. Most importantly, we found that the conventional human capital model does not account for much of the disparity between Sub-Saharan Africans and the native Dutch, even when the model is expanded with language proficiency as an additional variable. Considering these findings, we suggest that alternative explanations, such as society of origin, the operation of norm images and ethnic concentration in specific sectors impeding mobilities should be researched further.
1. Introduction
The difference in labour attainment between native populations and immigrants has been a persistent concern in Western societies. There is a gap across the board, pertaining to human capital, labour attainment, job quality, prospects offered by the jobs, and ultimately mobility. Immigrants are often driven into the less promising labour markets, although there may be substantial differences across the groups. However, despite the fact that the second generation shows an increase in competitive capacity, as indicated by their higher level of education, and despite the diversification of their social networks, as well as their familiarity with the language and culture of the receiving society, the gap between this generation and the native population may have diminished, but still persists (Andriessen, Fernee, and Wittebrood Citation2014; Dagevos and Huijnk Citation2016; Holland and De Valk Citation2017; Van Ours and Veenman Citation2004).
Most of these findings were established with reference to established minorities. With regard to the Netherlands, these included former guest labourers (Turks and Moroccans mainly) and people from former colonies (Surinam and the Netherlands Antilles). However, in the last decades, several different categories of immigrants have entered the Netherlands. Some are highly skilled, such as ICT-workers from India, while the resources of others, notably from Sub-Saharan Africa, remain unknown and are under researched (Choenni Citation2004; Van Heelsum and Hessels Citation2006). That there is reason for concern is underscored by the fact that over half of the adult Somalis and Eritreans depend on social assistance (Dourleijn and Dagevos Citation2011; Statistics Netherlands Citation2016; see also Appendix 1). Moreover, Widmaier and Dumont (Citation2011) reported that the largest unemployment gap in Europe between natives and Sub-Saharan Africans is found in the Netherlands. Highly skilled Sub-Saharan Africans encounter many barriers when looking for a job, due to their lack of knowledge of the local labour market and the underappreciation of foreign education.
The traditional models based on human capital factors have been widely tested, but only on settled immigrants. In order to disclose the labour market position of Sub-Saharan Africans in the Netherlands, and departing from the persistent feature of a gap between immigrants and the native population, we set out to address not only the gap in labour market attainment between the native Dutch population and the beforementioned African immigrants, but also to address disparities across African immigrants.
Consequently, this paper focuses on the labour disparities between Sub-Saharan African immigrants in the Netherlands, a hitherto undescribed ethnic group, and Dutch natives. Considering the impact of human capital in reducing the disparities as demonstrated in previous research (Andriessen, Nievers, and Dagevos Citation2012; Bovenkerk, Gras, and Ramsoedh Citation1995; Dagevos and Huijnk Citation2016), we first sought to establish the size of the impact of human capital. The central hypothesis is that differences in human capital will account for the disparities in labour attainment between Sub-Saharan Africans and the native Dutch. Other possible explanations for labour participation of migrants exist apart from their less favourable human capital. Limited command of the host country’s language, less effective social networks, labour market segmentation (Doeringer and Piore Citation1971; Dagevos Citation1998; Bevelander and Nielsen Citation2001), labour market discrimination (Phelps Citation1972; Van Beek Citation1993; Veenman Citation2010; Andriessen, Nievers, and Dagevos Citation2012) and the effects of different welfare systems in different countries play a role in the overrepresentation of migrants among the unemployed.
Using unique data with nationwide coverage, the analysis reveals that the labour market position of Sub-Saharan Africans displays an exceptionally large disparity with the native Dutch population. Most importantly, unlike previous research, we found that the conventional human capital model does not account for much of the disparity between Sub-Saharan Africans and the native Dutch, even when the human capital model is expanded with an additional variable that highlights the language skills of the participants. Considering these findings, we suggest society of origin, the operation of norm images and ethnic concentration in specific sectors impeding mobility as alternative explanations for further research.
In the next section, we elaborate the hypothesis that human capital explains the gap between the Sub-Saharan Africans in the Netherlands and the native Dutch. In the section after we outline the methodology, specifically the origin of the data and the use of the Fairlie decomposition method. Section four presents descriptive statistics, while section five tests the main hypothesis. The final section suggests some lines for further research.
2. The labour market: hypothesis
The human capital theory is by far the most popular theory to account for differences in labour market performances. The theory stipulates that education, in addition to work experience, is the key to success (Becker Citation1962, Citation1975; Mincer Citation1974). People need to invest in their schooling in order to obtain a higher income in the future. From this, it may be inferred that high unemployment rates among immigrants can be accounted for by their low educational level or limited work experience. In this context, Duleep and Regets (Citation1999) argued that education obtained in less developed countries is less valued in western countries. Hartog and Zorlu (Citation2009) and Duleep and Regets (Citation1999) found that vocational skills and low education levels are more easily transferable than higher education. Language and accreditation of diplomas by employers remain problematic. As a result, newcomers tend to initially accept jobs below their level.
Language proficiency is also considered a form of human capital with positive economic effects (Geurts and Lubbers Citation2017). The economic gains in the form of job opportunities depends on the investment in local skills, which is related to the duration of stay and the place where immigrants were educated. Borjas (Citation1999) argued that migrants will assimilate more the longer they reside in the host country, or in other words, the more they invest in specific local skills such as the language, the higher the probability of being employed. The duration of stay impacts the intention to invest in language proficiency. It is worth noting that this investment is related to its economic returns. Immigrants take into account the potential benefits before they invest in learning or improving their language skills. When the economic gains are expected to be higher, the investment made will also be greater. Hence immigrants who intend to stay for a long time in a new country are more open to invest in their language proficiency. So long-term immigrants will invest more in their language skills. This expectation is supported by research of Geurts and Lubbers (Citation2017). Their study shows that migrants who do not intend to stay, or who plan to circulate between their country of origin and the Netherlands, invest less in their language proficiency. Therefore the variable ‘duration of stay’ affects the immigrants’ adjustments, such as fluency in the language.
Likewise, it has been argued that education in the host country is important in narrowing the unemployment gap between natives and immigrants. Based on their empirical research in the Netherlands, Kanas and Van Tubergen (Citation2009) showed that the economic returns to schooling acquired in the country of origin are much lower than returns from schooling in countries of residence. The education system not only prepares individuals for work, but also socialises them into the culture of the receiving society (Vermeulen and Penninx Citation1994; Engbersen Citation2003). Esser (Citation2004) argues that it is impossible to integrate into a new labour market without some knowledge of the rules of the receiving society. Therefore, schooling gives new migrants the opportunity to build and extend their human capital. Schooling in the host country is considered necessary for establishing ethnically diverse relationships. Immigrants enrolled in a the host country schooling system increase their contacts with natives. These contacts are presumed to positively impact on their networks and social influence. Immigrants may take advantage of these networks for job-matching processes or to collect information on job offers. However, studies that addressed the impact of networks and education are controversial. Research conducted by Kanas and Van Tubergen (Citation2009) among four ethnic minority groups in the Netherlands did not confirm the importance of the networks. They concluded that higher returns to host-country schooling cannot be explained by increased social contacts with natives.
We argue that familiarity with the Dutch language is a form of human capital that enhances the likelihood of having a job. This familiarity with Dutch culture, including the command of Dutch language, is reflected in education, but is indicated by the duration of stay and generation. In addition to education and labour market experience, labour market performance of immigrants benefits from a longer duration of stay, notably when they are born in the host-country. Hence, ‘generation’ is used as a proxy for language skills.
We therefore formulate our hypothesis in accordance of the human capital explanation: low education is positively related to a low attainment of jobs. Note that the relationship between the possession of human capital and job attainment is expected to vary across African nationalities because of differences in human capital and familiarity with Dutch culture. This hypothesis addresses the topic of the paper and will disclose the gap between recent immigrants from Sub-Saharan Africa and the native Dutch, as well as the gaps between African groups.
In spite of its popularity, the human capital theory suffers from a few flaws. The major flaw is the excessive focus on the job seeker. Studies on job allocation reveal that education and work experience only affect the stage of recruitment and selection. Personal characteristics appear to be decisive for the job interview, the offering of a probation period and the making of a final job decision (Ballafkih Citation2017). Secondly, preferences relating to group features, such as gender or ethnicity profiles, are conspicuously absent in this perspective (Van Beek Citation1993; Veenman Citation1995; Blau Citation2012; Gowricharn and Çankaya Citation2017). Job allocation cannot be reduced to individual features, but needs to include group characteristics as well. Neglecting these group characteristics would render the persistence of ethnic hierarchy in the labour market incomprehensible (Gowricharn Citation2002). Thirdly, the human capital theory centres the explanation of labour market performance at the supply side of the market. Consequently, this bias does not account for the preferences of the employer, the key player in the labour market (Atkinson Citation1970; Dagevos Citation1998).
It has often been reported that labour market disparities are due to racial or ethnic discrimination. This account is based on the reasoning that identical factors generate similar outcomes across ethnic groups. When discrepancies are observed, these are likely to be attributed to discrimination, besides other unmeasured factors (Arrow Citation1973; Veenman Citation2006; Lang and Lehman Citation2011). This has been corroborated by Dutch research, using a variety of methods and perspectives (Van Beek Citation1993; Veenman Citation2010; Andriessen, Nievers, and Dagevos Citation2012; McGinnity and Gijsberts Citation2017). In this context, Spörlein and van Tubergen (Citation2014) suggest that differences in societies of origin might be a powerful explanatory variable, since more highly developed societies may connect easier with the host society. In addition, one can also argue that not every ethnic minority group is accepted in the same manner by the host population, as some ethnic groups are preferred above others (Veenman Citation1995). Therefore, it ought to be noted that the unaccounted discrepancies reflected in residuals can never be taken as an indicator of discrimination.
3. Data and method
This study focuses on the labour participation of Sub-Saharan Africans. The occupational background of the research population is provided by the Social Statistical Database (SSB), which matches information at the individual level with data from other sources: the municipal population registers, the tax authorities, the social security administration, labour force and household surveys. Moreover, it provides information on the sociodemographic characteristics of workers, such as gender, date of birth, marital status, place of residence and household composition. We managed to link the SSB with the education administration databanks, notably students in higher education (CRIHO), students who took an exam in general secondary education (ERR), monthly registration of job-seekers (ERR), and students with grants (UWV, WSD). This exercise enabled us to produce information on education at the individual level and differentiate it by Sub-Saharan nationalities.
The data covered the period 2006–2012. The statistics comprised Sub-Saharan immigrants and the native Dutch population. The African sample focuses on the eleven countries with the largest number of immigrants: Nigeria, Angola, Somalia, Eritrea, Ethiopia, Ghana, Cape Verde, Sudan, Congo (DR), Sierra Leone and South Africa. According to the official definitions of Statistics Netherlands (Statistics Netherlands Citation2016), the immigrant population consists of the first generation, described as persons born outside the Netherlands and with at least one foreign-born parent, while the second generation refers to persons born in the Netherlands with at least one parent who was born outside the Netherlands. Because the education level is the main explanatory variable for the labour market participation, individuals for whom the level of education was unknown (26.7 thousand Sub-Saharan Africans, see Appendix 2) or for whom job information was missing were excluded from the selected population. This category included fulltime students, the self-employed without personnel and persons under 15 or over 64. In this newly constructed database, the remaining population consists of about 24 thousand Sub-Saharan and 1.9 million native Dutch persons.
3.1. Dependent variables
The dependent variable consists of the labour market participation. This variable distinguishes between the economically active and inactive populations. The economically active group includes persons who are employed and for whom work represents their main source of income. The self-employed are excluded from the research population as self-employment is marginal among Sub-Saharan Africans and amounts to about 0.1% (according to our own calculations) versus 15% in the case of the native Dutch in 2012 (Statistics Netherlands Citation2012). The inactive population are persons without paid work or whose main income comes from social security benefits, such as old age pensions or unemployment, disability or sickness benefits.
3.2. Independent variables
The independent variables consist of the human capital and individual variables, education level, age, gender, generation, and duration of stay in years as proxy for language skills. We included controls for household composition, ethnic origin, province of residence, immigration motive (status). These variables are expected to be causally related to attaining a job. The native Dutch population functions as the reference group. The education level of the individual is based on the highest diploma obtained.
Persons with foreign degrees may submit a request to the credential evaluation information centre (IDW) for recognition of their diplomas or an evaluation of their level of education. The evaluation, according to the Dutch education system, is based on the international Lisbon Recognition Convention. Subsequently, the recognised level of education is registered in the education administration database, which is matched with the SSB database. For most young persons, there are integral observations of registrations at schools or universities. Data from surveys such as labour force market surveys is used to complete missing education information in the SSB database. The file is continuously supplemented with the most recent data. In the absence of a credentials request or when no education has been followed in the Netherlands, the level education is registered as unknown in the national education register.
One might argue that the level of education is unknown for 27.5 thousand Sub-Saharan Africans, which is not negligible. This is 52.8% of the research population. And a third is from South Africa and Cape Verde. We realise that the number is large but let’s not forget that the limited amount of quantitative research on the labour market position of Sub-Saharan Africans in the Netherlands is related to the poor information on their education level (Van Heelsum and Hessels Citation2006) and the small size of the samples for whom the education is known. Information about education level is registered and provided by national education registers. Statistics Netherlands enriches this information with education information from the most recent surveys in order to increase the population for whom the education level is known. Therefore it is improbable that the coverage of the known education would have been higher than for this study. In addition, none of the previous studies have taken into account such a large Sub-Saharan population. So a coverage of 47.2% is undoubtedly a big step forward. This data reinforces the quality of the present study and makes it unique for this hitherto undescribed ethnic group.
The highest level of education is measured in three categories: lower education (less than secondary level), secondary education (secondary vocational, general and post-secondary) and higher education (college or university).
Gender: the small size of some immigrant groups in the sample, i.e. Eritreans, means that running two separate models for men and women leads to problems for quantitative analysis and to privacy issues. Therefore, only one model has been displayed for both genders.
Household composition is represented by seven groups of variables: singles, singles with children, not married without children, married without children, not married with children, married with children and others, including the institutionalised population.
The place of residence is a twelve categorical variable distinguishing the Dutch provinces. Four age groups are compared to account for the influence of age (15–34; 35–44; 45–54 and 55–64 years). We do not use age as an indirect measure of labour market experience. Note that this measure for potential work experience falls short for new immigrants and women as they have not had a continuous labour market activity in the host country. It is common that new immigrants need some time before they can integrate into a new labour market or that women stop paid work temporarily to give priority to the family responsibilities.
Generation: the immigrants’ generation is identified by their place of birth as indicated before. Two categories identify generation: first and second. We are aware that the two chosen identities oversimplify matters. Immigrants who immigrated at a young age have experiences closer to second generation immigrants. They are as socialised as immigrants born in the host country, they go to school in the host country and probably have the same language fluency as their peers.
Length of stay: we introduce nine categories for the length of stay. It is measured in years since someone’s arrival in the Netherlands. As stated before, generation and the length of stay are also used as a proxy of language skills accumulation. The ethnic origin of the Sub-Saharan Africans is represented by the eleven countries cited above and the native Dutch.
3.3. Method
A conventional decomposition technique widely used is the Blinder (Citation1973)-Oaxaca (Citation1973). This technique decomposes the gap in labour market attainment between two (demographics) groups into the disparity a) accounted for by differences in measured characteristics, and (b) those resulting from unmeasured characteristics (e.g. discrimination or labour segmentation).
The dependent variable in this study is a binary variable that distinguishes the economically active and inactive populations. However, the conventional Blinder-Oaxaca decomposition method cannot be implemented if the outcome is binary and the coefficients are from a logit or probit model (Fairlie Citation2005). In the same line as Gomulka and Stern (Citation1990), Fairlie (Citation2005) proposed an alternative decomposition method, where the coefficient estimates from a logit or probit model can be used directly in the decomposition specification. Concerns exist about the ordering of variables and the robustness of the method because of the non-linearity of the decomposition (Fortin, Lemieux, and Firpo Citation2010, 49). These are addressed by Fairlie (Citation2005, Citation2017).
Fairlie suggests to first use the pooled coefficient estimates in order to calculate predicted probabilities for each black (Immigrants) and white (Natives) observation in the sample. Subsequently, it is sought to draw a random subsample of Natives equal in size to the full immigrants sample (NB). Each observation in the native subsample and full immigrant sample is then separately ranked by the predicted probabilities and matched by their respective rankings. This procedure matches natives, who have characteristics placing them at the bottom (top) of their distribution with immigrants. The decomposition estimates obtained from this procedure depend on the randomly chosen subsample of natives. In practice, Fairlie advice is to draw a large number of random subsamples of natives, match each of these random subsamples of natives to the black (immigrant) sample, and calculate separate decomposition estimates.
The effect of ordering variables in the decomposition may lead to variation in the results (Fortin, Lemieux, and Firpo Citation2010, 49). This is known as the index problem. In order to control the robustness and solve the index problem, Fairlie (Citation2017) suggests randomising the ordering of variables. By using a large number of simulations, the procedure approximates the averaged composition across all possible orderings of variables. Following Fairlie, we used a random ordering of the variables in addition to the 1000 random subsamples.
3.3.1. Fairlie method
The decomposition of the non-linear-differences in the expected labour market participation, non-linear equation , where Y is the average value of the dependent variable, can be written as:
(1)
(1) where,
is the average probability of the binary outcome for race j and
is a row vector of average values of the independent variables and
is a vector of coefficient estimates for race j.
The first term in brackets on the right-hand side represents the contribution of the observed characteristics (age, gender, education, generation, household composition, ethnic origin and residence). The second term in brackets represents the contribution of the coefficients of the difference in the expected labour market participation between natives and immigrants. The second term also reflects the contribution of the gap due to unobserved characteristics. It captures the unexplained part, which can be the result of unobservable characteristics and/or discrimination between natives and immigrants. The standard errors for the estimates can be written as follows:(2)
(2) The variance can be approximated as:
(3)
(3) Where
is a row vector of average values of the independent variables and
is a vector of coefficient estimates for race and f is the logistic probability function.
NB: immigrant sample and Nw: native sample
We assume that NB = Nw;
: calculate predicted probabilities, for each black (Immigrants) and white (Natives) observation.
4. The gap in labour market attainment: descriptive analysis
shows the comparison of the labour market participation of Sub-Saharan Africans and Dutch natives. The descriptive analyses aim to identify any gap (sub-question 1). The results show that only 27.6% of the Sub-Saharan immigrants are active on the labour market versus around 81% of natives. The highly educated are more often employed than the less educated, but highly educated Sub-Saharan Africans suffer a greater penalty than their native-born peers. There is a greater difference in labour market participation among the highly educated natives and immigrants (51% points) than among the less educated (47% points).
Table 1. Labour market participation of natives and Sub-Saharan Africans in the Netherlands, 2012.
The outcomes show stark contrasts across age categories. Native individuals aged 15–34 and 35–44 have a higher activity rate (about 86%) than individuals aged 55–64 (74%). Among immigrants, the older individuals have the highest activity rate (about 52%). Another key result is the deviation among age categories: among young and older immigrant groups it ranges from 6.8% to 51.9%, while among natives it is a more modest 73–85%. In other words, being older is more favourable for immigrants than for natives.
Other interesting findings are the variation in employment participation with respect to the presence of children. More than two children substantially increases the inactivity rate. In the reference group, the activity rate ranges from 77% to 62% with more than three children. With fewer than three children, the observed occupation rates are about 82%. Striking differences were found when there are no children. While the labour activity is the highest among natives without children (82%), immigrants with no children have an even lower participation rate (24%) than the group with three children (28%). Age and duration of stay could be the explanation. Immigrants without children are often young. Their short duration of stay and limited experience on the Dutch labour market hamper them.
Marital status is not relevant to the activity rates of either group, but the presence or absence of a partner and children hampers the participation rate of both. Compared to households with children and a partner (range 32–38% for immigrants), the participation rate of single-parent households drops to 24%. Among natives, 63% of the single-parent households have paid work versus 53% of households with children and a partner.
The place of residence is also key. The highest activity rates – about 84.5% for natives – are found in the provinces Utrecht, Noord-Holland, Zuid-Holland and Brabant. For Sub-Saharan Africans, Noord – and Zuid-Holland offer the best job prospects (33.6% and 39%). displays large variations by Sub-Saharan ethnic origin (sub-question 2). South Africans and Cape Verdeans have participation rates of 55% and 61%. Among the remaining groups, it varies from 44% (Ghanaians) to 5.1% (Eritreans and Sierra Leone). Interestingly, the gap in participation rates with natives gradually disappears after an extended stay: from about 78% points after five years to 10% points after thirty years. Second generation Sub-Saharans almost reach parity with natives, with an activity rate of more than 72% – three times higher than that of the first generation. Another finding is that economic migrants participate more often than refugees or immigrants for family reunification. However, the migration motive is known only for 10% of the immigrants because the Dutch Immigration and Naturalisation Service (IND) only started recording it in 1999. So this is not representative for immigrants who arrived earlier.
Table 2. Labour market participation of Sub-Saharan Africans by demographic characteristics, 2012.
5. The explained part
The gap in labour market disparities is addressed on the basis of the hypothesis formulated in section two. The first analysis dealt only with the variable ‘level of education’ whilst in the second analysis the variable ‘level of education’ is extended with the differences in accumulated language skills between natives and Sub-Saharan Africans.
5.1. Human capital
Literature research reveals the importance of human capital as the main factor explaining the disparity between demographic groups. The hypothesis is whether and to what extent level of education and the individual and control variables i.e. gender, age, household composition and place of residence contribute to the gap. shows the labour market participation estimates using the non-linear decomposition technique. The gap between natives and Sub-Saharans is 53%. What comes as a surprise is that all explanatory variables mentioned before account for just 8.9% of that gap. Although low education is the major cause of poor labour market attainment among immigrants, education contributes an estimated −0.0072 (13.6%) to the explanation of ethnic disparities. Age contributes about 7.2% (0.03823) to ethnic disparity. The rest of the variables scarcely contribute. This limited contribution of the human capital variables suggests that they cannot explain the position of new migrants on the Dutch labour market.
Table 3. Fairlie non-linear decomposition of Native Dutch and Sub-Saharan Africans in labour market attainment, 2012.
The comparison by ethnic origin reveals that the smallest gap in labour market participation is found for Cape Verdeans (0.1954) and South Africans (0.2583). The gap for the others varies from 0.4124 to 0.6644. Unexpectedly, ethnic origin only plays a limited role in explaining the gaps (0–15.3%). The highest contribution is found for Cape Verdeans (15.3%). But even for this group, education level (14.1%) is the main explanatory factor. Cape Verdeans have a much longer migration history in the Netherlands and elsewhere in Northwest Europe than any of the other Sub-Saharan group. None of the selected variables can explain the gap for South Africans.
5.2. Language skills
The next analysis pertains to differences in language skills accumulation between natives and Sub-Saharan Africans. Sub-Saharan Africans are grouped by duration of stay and generation to be used as a proxy for the accumulation of language skills resources.
When the immigrant population is grouped by generation, the outcomes () reveal some interesting findings. To start, differences in labour market attainment between the first generation (0.5178) and natives are larger than for the second generation (0.0831) and natives. The explanatory variables account for 7.7% of the gap for the first generation and for 44.7% of the gap for the second generation. The gap for the first generation is mainly caused by the lower education level (15.4%), while that for the second generation is predominantly explained by age (49.2%). The second generation of Sub-Saharans is in fact a relatively young group with little labour market experience.
Table 4. Fairlie non-linear decomposition of Native Dutch and Sub-Saharan Africans by generation and duration of stay in labour market attainment, 2012.
The first generation Sub-Saharan population was also sampled by duration of residence. One major finding of the non-linear decomposition is that the gap decreases with the duration of stay. For migrants whose stay was shorter than 25 years, the native/sub-Saharan gap ranges from 0.7834 (78%) to 0.3193 (32%). For migrants whose stay exceeded 25 years, the gap ranges from 0.1782 to 0.0611. Immigrants almost reach parity with natives after 40 years of residence, the gap is then only 6%. A second finding is that the human capital variables are important explanatory factors for migrants who have lived in the Netherlands for more than 15 years explaining 25.8–66.8% of the gap with natives. For immigrants whose stay is shorter than 15 years, the included variables explain less than 0.3% of the gap.
For the 15+ year group, the largest contributors to the difference in labour market attainment between natives and immigrants are education level, gender and age. The importance of these variables varies depending on the duration of stay. Only education level is relevant for immigrants residing in the country between 15 and 25 years, as it contributes to 24.4% of the gap. For the 25–40 year residence group, almost half of the native/immigrant gap is attributed to education, whilst gender accounts for 15.8%. The 40 year+ residence group almost reached parity with natives (contributions gap 0.0611). Age seems to play a more salient role than education in explaining the gap for this 40 year+ residence group, accounting for a third thereof. Another third is explained by education and gender together. However, conclusions for this group should be drawn with caution because of the small sample size.
6. Discussion
The hypothesis is that low education is positively related to a low attainment of jobs. The results reveal that only a minor part of the variations in job participation between natives and immigrants are explained. Even when all variables are included in the analysis, the human capital model explains only 9% of the gap. Analysing closer, the importance of the human capital variables turns out to differ among Sub-Saharan groups. When the human capital is extended with accumulated language skills, the explanatory power of the model becomes slightly stronger.
We started from the assumption that higher education increases the likelihood of having a job. However, Venturini (Citation2017) questions whether it would not be better to refer in terms of ‘having a good job match’. If higher education is positively related to having a job, Venturi warns that over-education is an element which should not be overseen. In fact, over-education among immigrants decreases the likelihood of having a good job match, while not having higher education increases the likelihood of having a better job match. For the highly educated immigrants, the years they studied in the host country helps them to align their human capital to the local demand on the labour market, which enhances their job match.
For more recent immigrants, about 80% of the first generation in this study, education does not explain their position on the labour market. Probably, at this early stage, other non-measurable factors play a more important role as mentioned earlier in section two. Results show that the 25+ years resident group experiences less language skills disadvantages. This means that new immigrants who invest in language proficiency at an early stage will benefit from education in the long-term. But it will still take more than 25 years for them to significantly reduce the gap with natives. Even so, it is worth to promote language command as early as possible.
Another interesting result is the small gap between long-term migrants and natives. Previous research identified the low return of human capital variables for Sub-Saharan Africans. Research conducted in the UK (Clark and Drinkwater Citation2008) revealed that the gap in the probability of employment between immigrants and natives is due to differences in return of human capital characteristics. For the same employment differentials between immigrants and natives, the return of their human capital variables is higher among Chinese immigrants than among Sub-Saharan Africans and Pakistanis. The question is why does a higher age of the immigrant seem to reduce the employment gap between immigrants and natives? The human capital theory states that the higher the age is, the more job experience is acquired. However, age enhances more than just professional knowledge among immigrants. In addition this group acquires cultural knowledge about the Dutch labour market and social institutions, favouring their job prospects (Edin, Lalonde, and Aslund Citation2000; Venturini Citation2017). The variable age measures the accumulation of human capital and professional knowledge among immigrants. This accumulation of human capital reduces the labour market differentials with their natives in the same age category.
We departed from the logical inference that human capital will account for a significant part of the gap. However, the explanatory power of these variables appears to be rather poor. This has a compelling implication for the residual that is now large: 90% of the gap remains unexplained. The existence of a gap is a familiar finding in labour market analyses (Andriessen, Dagevos, and Iedema Citation2008; Fortin, Lemieux, and Firpo Citation2010; Kogan Citation2010), who have reported an unexplained gap of about 35% between natives and Turks/Surinamese. The significant unexplained part of 90% makes the case of Sub-Saharan Africans intriguing.
The literature suggests that discrimination is in play, whether or not related to group preferences. However, the residual between natives and Sub-Saharan immigrants is too large (a difference between 35% and 90%), to credibly attribute it only to discrimination. We find it more likely that other unobserved factors impact the size of the gap.
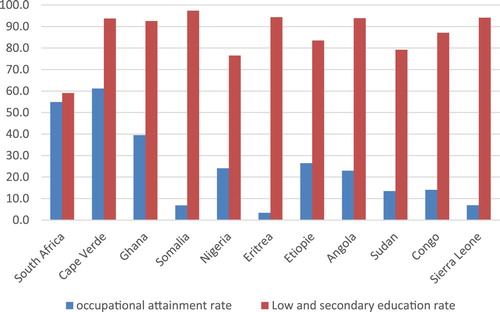
The large size is not the only remarkable finding. The differences across the groups are equally intriguing. displays the labour market participation of Sub-Saharan Africans with low and secondary education levels by country of origin. As expected, ethnic groups with larger numbers of lower educated individuals have the lowest rate of labour market attainment. South Africans have the fewest low and secondary education levels, accounting for about 60%, and the highest rate of active persons. One interesting aspect of is the exceptional position of Cape Verdeans, who have the lowest education level, of about 93.7%, while displaying the highest rate of labour attainment (60%). South Africans also contrast favourably with other groups, but their education level is higher, while their labour attainment is slightly lower compared to the Cape Verdeans. At the other extreme, we find Somalians, Eritreans, Sudanese, Congolese, and Sierra Leoneans. Their human capital as well as their labour attainment contrast negatively with the South Africans and Cape Verdeans.
Figure 1. Occupational attainment of low and secondary education of Sub-Saharan Africans, 2012.
Since an explanation in terms of ‘capital’ does not suffice, we wonder what other alternative explanations are available. We have the following three suggestions. The first relates to the specific properties of the researched groups. Note that immigrants from Somalia, Eritrea, Sudan, Congo, and Sierra Leone have been fleeing from war zones. That may have affected their social way of life in the Netherlands, for example, by forming closed groups or conversely, by seeking social isolation. Since the allocation of labour is accounted for from a market perspective, these historical and contextual factors are hardly considered. Also the size of the community seems relevant for their integration. Previous research has confirmed the negative relation between large communities and labour market integration. de Palo, Faini, and Venturini (Citation2006) showed that less contact with natives due to large communities limits the opportunities to learn the native language and to enlarge a network. Still, the role of the ethnic community is not obvious as it depends on the case study. In the study of Strøm, Venturini, and Villosio (Citation2013), the number of workers and non-workers have been measured in order to assess the size of the community. The researchers found a positive effect between the size of the community and the economic integration of members of the community in the UK. Research in Sweden conducted by Edin, Fredriksson, and Åslund (Citation2003) found that living in an enclave plays a positive role on labour market outcomes for less-skilled immigrants in Sweden. So, the large community of Cape Verdeans in the city of Rotterdam (where about 60% of Cape Verdeans in the Netherlands live) might improve the integration of its members.
A second explanation is provided by Gowricharn (Citation2002), who suggests the concept of cultural norm images in the labour market. He argues that the members of an ethnic group are accepted by employers when they fit a culturally desired profile, including work ethos, dress, manners, and other properties, not all necessarily relevant for the job. From this perspective, the labour market inclusion of Cape Verdeans is comprehensible since this group is the oldest among the Sub-Saharan groups and better assimilated. Since we do not know whether South Africans consist of whites or blacks, it is unclear whether cultural norm images account for their favourable position.
A third possible explanation is raised by Spörlein and van Tubergen (Citation2014), who suggest that the society of destination may account for differences in acceptance. Dutch people, for instance, give more credit to people from societies they are familiar with, such as Europe, the USA, South Africa and former Dutch colonies. This variable is often not considered but needs to be included in a credible account of labour market disparities.
7. Conclusion
This paper addressed the issue of gaps in labour market performance between the indigenous Dutch population and Sub-Saharan Africans. These gaps predominantly consist of differences in education and command of the language. Consequently, conventional approaches account for this disparity in terms of differences in human capital, notably differences in education. We extended this human capital model by including both duration of stay and generation as indicators for the degree of language control. Individual characteristics, such as age and gender, and control variables have been added to the model. This model has been used to account for the differences between the native Dutch and Sub-Saharan Africans, expecting that a significant part of the disparity would be accounted for by these two variables. Using nation-wide data, the results of our test revealed that the independent variables hardly accounted for the gap and that the unexplained part was about 90%, an astonishingly large size.
This outcome is at odds with most research, including Dutch studies that report an unexplained part hovering around 35% (Andriessen, Nievers, and Dagevos Citation2012; Dagevos and Huijnk Citation2016). Since the explanatory power of the independent variables is inversely related to the residual, the question comes up as to why the independent account for so little. We suggest three explanations that may apply differently for the researched groups: specificities of the ethnic groups, i.e. that many of them come from African war zones; the operation of cultural norm images; and the impact of the societies of origin. The precise explanation for these concepts is in the dark, hence we suggest them as directions to look for explanations. To these suggestions, we can add the impact of sectoral and regional concentration of the Africans, the state of the economy and differential access to the labour market.
From our results, we suggest two lessons. First, the strong deviations from conventions suggest that the human capital accounting for labour market participation requires specification. There is too much research corroborating these relations to reject them. But this relationship may not be valid in all places, at all times, under all circumstances or for all ethnic groups. Second, large residuals sensitise at variables not included. This is conventional wisdom, but in the case of the labour market participation of ethnic minorities, some crucial variables are often omitted. In our view, all three suggested additional explanations, group specificities, societies of destination and cultural norm images, contribute to a better explanation. Future research will corroborate whether our belief is true.
Disclosure statement
No potential conflict of interest was reported by the authors.
References
- Andriessen, I., J. Dagevos, and J. Iedema. 2008. “Onbekend of ongemeten? Over de betekenis van discriminatie als factor in de werkloosheid van niet-westerse allochtonen.” Mens en Maatschappij 83 (3): 279–301.
- Andriessen, I., H. Fernee, and K. Wittebrood. 2014. Perceived Discrimination in the Netherlands. The Hague: The Netherlands Institute for Social Research (SCP).
- Andriessen, I., E. Nievers en J. Dagevos. 2012. Op achterstand. Discriminatie van niet-westerse allochtonen op de arbeidsmarkt. Den Haag: SCP.
- Arrow, K. J. 1973. “The Theory of Discrimination.” In Discrimination in Labor Markets, edited by O. Ashenfelter, and A. Rees, 3–33. Princeton, NJ: Princeton University Press.
- Atkinson, A. B. 1970. “The Measurement of Inequality.” Journal of Economic Theory 2: 244–263. doi: 10.1016/0022-0531(70)90039-6
- Ballafkih, A. 2017. “Qualifications, Skills and More! Characteristics Employers Look for When Hiring Newly Graduated Applicants for a Higher Occupational Level.” PhD thesis, University of Amsterdam.
- Becker, Gary S. 1962. “Investment in Human Capital: A Theoretical Analysis.” Journal of Political Economy 70: 9–49. doi: 10.1086/258724
- Becker, Gary S. 1975. Human Capital: A Theoretical and Empirical Analysis with Special Reference to Education. 2nd ed.New York: Columbia University Press for the National Bureau of Economic Research.
- Bevelander, P., and H. S. Nielsen. 2001. “Declining Employment Success of Immigrant Males in Sweden: Observed or Unobserved Characteristics?.” Journal of Population Economics 14: 455–471. doi: 10.1007/s001480000036
- Blau, F. D. 2012. Gender, Inequality and Wages. Oxford: Oxford University Press.
- Blinder, A. S. 1973. “Wage Discrimination: Reduced Form and Structural Estimates.” The Journal of Human Resources 8: 436–455. doi: 10.2307/144855
- Borjas, G. J. 1999. “The Economic Analysis of Immigration.” In Handbook of Labor Economics. Vol. 3., edited by O. Ashenfelter and D. Card, 1697–1760. North-Holland: Elsevier.
- Bovenkerk, F. M., J. I. Gras, and D. Ramsoedh. 1995. Discrimination Against Migrant Workers and Ethnic Minorities in Access to Employment in the Netherlands. Genève: ILO.
- Choenni, C. 2004. “Kaapverdianen in Nederland.” Maandstatistiek van de Bevolking 52 (3): 85–89.
- Clark, K., and S. Drinkwater. 2008. “The Labour-market Performance of Recent Migrants.” Oxford Review of Economic Policy 24 (3): 495–516. doi: 10.1093/oxrep/grn023
- Dagevos, J. 1998. Begrensde mobiliteit. Over allochtone werkenden in Nederland. Assen: Van Gorcum.
- Dagevos, J., and W. Huijnk. 2016. “Summary Integration in Sight?” In A Review of Eight Domains of Integration of Migrants in the Netherlands, 1–21. The Hague: The Netherlands Institute for Social Research (SCP).
- de Palo, D., R. Faini, and A. Venturini. 2006. “The Social Assimilation of Immigrants.” IZA Discussion Paper 2493. Accessed 20 July 2016. http://ftp.iza.org/dp2439.pdf.
- Doeringer, P., and M. Piore. 1971. Internal Labour Markets and Manpower Analysis. Lexington, MA: Lexington Books.
- Dourleijn, E., and J. Dagevos. 2011. “Vluchtelingengroepen in Nederland.” In Over de integratie van Afghaanse, Iraakse, Iraanse en Somalische migranten, 81–125. Den Haag: Sociaal en Cultureel Planbureau.
- Duleep, H. O., and M. C. Regets. 1999. “Immigrants and Human-capital Investment.” American Economic Review 89 (2): 186–191. doi: 10.1257/aer.89.2.186
- Edin, P. A., P. Fredriksson, and O. Åslund. 2003. “Ethnic Enclaves and the Economic Success of Immigrants: Evidence from a Natural Experiment.” The Quarterly Journal of Economics 118 (1): 329–357. doi: 10.1162/00335530360535225
- Edin, P.-A., R. Lalonde, and O. Aslund. 2000. “Emigration of Immigrant and Measures of Immigrant Assimilation: Evidence from Sweden.” Swedish Economic Policy Review 7: 163–204.
- Engbersen, G. 2003. “Spheres of Integration: Towards a Differentiated and a Reflexive Ethnic Minority Policy.” In Identity Integration: Immigrants in Western-Europe, edited by Rosemarie Sackmann, Bernhard Peters, and Thomas Faist, 59–76. Aldershot/Burlington: Ashgate.
- Esser, H. 2004. “Does the ‘New’ Immigration Require a ‘New’ Theory of Intergenerational Integration?” The International Migration Review 38 (3): 1126–1159. doi: 10.1111/j.1747-7379.2004.tb00231.x
- Fairlie, R. W. 2005. “An Extension of the Blinder-Oaxaca Decomposition Technique to Logit and Probit Models.” Journal of Economic and Social Measurement 30: 305–316. doi: 10.3233/JEM-2005-0259
- Fairlie, R. W. 2017. “Addressing Path Dependence and Incorporating Sample Weights in the Nonlinear Blinder-Oaxaca Decomposition Technique for Logit, Probit and Other Nonlinear Models.” SIEPR Discussion Paper No. 17-013. Stanford Institute for Economic Policy Research Stanford University Stanford, April.
- Fortin, N., T. Lemieux, and S. Firpo. 2010. “Decomposition Methods in Economics.” NBER Working papers 16045. Massachusetts: National Bureau of Economic Research.
- Geurts, N., and M. Lubbers. 2017. “Dynamics in Intention to Stay and Changes in Language Proficiency of Recent Migrants in the Netherlands.” Journal of Ethnic and Migration Studies 43 (7): 1045–1060. doi:10.1080/1369183X.2016.1245608.
- Gomulka, J., and N. Stern. 1990. “The Employment of Married Women in the United Kingdom 1970–83–.” Economica 57: 171–199. doi: 10.2307/2554159
- Gowricharn, R. 2002. “Integration and Social Cohesion: the Case of the Netherlands.” Journal of Ethnic and Migration Studies 28 (2): 259–273. doi: 10.1080/13691830220124323
- Gowricharn, R., and S. Çankaya. 2017. “Policing the Nation: Acculturation and Street-Level Bureaucrats in Professional Life.” Sociology 51 (5): 1101–1117. doi: 10.1177/0038038515601781
- Hartog, J., and A. Zorlu. 2009. “How Important is Homeland Education for Refugees: Economic Position in the Netherlands.” Journal of Population Economics 22: 219–246. doi: 10.1007/s00148-007-0142-y
- Holland, J. A., and H. A. G. De Valk. 2017. “Differences in Labour Force Participation by Motherhood Status among Second-generation Turkish and Majority Women across Europe. 2017.” Populations Studies, 1–16. doi:10.1080/00324728.2017.1319495 [Google Scholar].
- Kanas, A., and F. Van Tubergen. 2009. “The Impact of Origin and Host Country Schooling on the Economic Performance of Immigrants.” Social Forces 88 (2): 893–915. doi: 10.1353/sof.0.0269
- Kogan, I. 2010. “New Immigrants- old Disadvantages Patterns? Labour Market Integration of Recent Immigrantss into Germany.” IMIG International Migration no. 609: 1–27.
- Lang, K., and J. Y. K. Lehman. 2011. “Racial Discrimination in the Labor Market: Theory and Empirics.” Working paper 17450. National Bureau of Economic Research.
- McGinnity, F., and M. Gijsberts. 2017. “The Experience of Discrimination among Newly Arrived Poles in Ireland and the Netherlands.” Journal of Ethnic and Racial Studies, 1–19. doi:10.1080/01419870.2017.1332376.
- Mincer, J. 1974. Schooling, Experience and Earnings. New York: National Bureau of Economic Research.
- Oaxaca, R. 1973. “Male-female Wage Differentials in Urban Labor Markets.” International Economic Review 14 (3): 693–709. doi: 10.2307/2525981
- Phelps, E. S. 1972. “The Statistical Discrimination of Racism and Sexism.” American Economic Review 62 (4): 659–661.
- Spörlein, C., and F. van Tubergen. 2014. “The Occupational Status of Immigrants in Western and non-Western Societies.” International Journal of Comparative Sociology 55 (2): 119–143. doi: 10.1177/0020715214534702
- Statistics Netherlands (CBS). 2012. Jaarrapport Integratie 2012. Den Haag/Heerlen: Centraal Bureau voor de Statistiek.
- Statistics Netherlands (CBS). 2016. Annual Report 2015. Den Haag/Heerlen: Centraal Bureau voor de Statistiek.
- Strøm, S., A. Venturini, and C. Villosio. 2013. “Wage Assimilation: Migrants Versus Natives and Foreign Migrants Versus Internal Migrants.” EUI working papers, RSCAS 2013.
- Van Beek, K. 1993. “To be Hired or not to be Hired: The Employer Decides.” Unpublished PhD thesis, Amsterdam University.
- Van Heelsum, A., and T. Hessels. 2006. Nigerianen, Afrikanen uit Angola, DR Congo, Ethiopië, Eritrea, Nigeria en Sudan in Nederland. Den Haag: Ministerie van Justitie, pp. 73.
- Van Ours, J. C., and J. Veenman. 2004. “From Parent to Child: Early Labor Market Experiences of the Second-generation Immigrants in the Netherlands.” De Economist 152 (4): 473–490. doi: 10.1007/s10645-004-2475-1
- Veenman, J. 1995. Onbekend maakt onbemind [ Unknown, Unloved]. Assen: van Gorcum.
- Veenman, J. 2006. “Integrating Migrants in the Netherlands: The Role of Education, Employment, and the Media.” International Seminar for Experts “Integrating migrants in Europe”, Cicero Foundation in the series Great Debates, Paris, June 15–16.
- Veenman, J. 2010. “Measuring Labor Market Discrimination.” American Behavioral Scientist 53 (12): 1806–1823. doi: 10.1177/0002764210368098
- Venturini, A. 2017. “Immigrant Assimilation in the Labour Market: What Is Missing in Economic Literature.” In Migrant Integration between Homeland and Host Society, edited by A. Weinar et al., Global Migration Issues 7 (1): 21–42. doi:10.1007/978-3-319-56176-9_2.
- Vermeulen, C. J. J., and M. J. A. Penninx. 1994. Het democratisch ongeduld: de emancipatie en integratie van zes doelgroepen van het minderhedenbeleid. Amsterdam: Het Spinhuis.
- Widmaier, S., and J. C. Dumont. 2011. “Are Recent Immigrants Different? A New Profile of Immigrants in the OECD (Dioc 2005/2006).” OECD Social Employment and Immigration, Working Papers, No 126. Paris: OECD. doi:10.1787/5kg3ml17nps4-en.