
 ?Mathematical formulae have been encoded as MathML and are displayed in this HTML version using MathJax in order to improve their display. Uncheck the box to turn MathJax off. This feature requires Javascript. Click on a formula to zoom.
ABSTRACT
While much of the ethnic and racial segregation literature concentrates on residential neighbourhoods, a growing body of research demonstrates how levels of inter-ethnic mixing vary between home and other spaces, including workplace environments. Using alternative population bases from the 2011 Census for England and Wales, we explore how levels of ethnic segregation and diversity compare for working-age people in residential (‘nighttime’), workday (‘daytime’) and workplace (‘employment’) environments. Analyses of Middle Layer Super Output Areas reveal that a larger number of these zones had low residential ethnic diversity than had low workday or workplace diversity. We also find higher levels of residential segregation than workplace segregation for all ethnic groups, including the White British (majority) and minoritised groups. Notable differences in segregation between residential and workplace spaces for the Pakistani and Bangladeshi ethnic groups, for example, demonstrate that more commonly applied measures of residential segregation fail to capture the extent of inter-ethnic mixing across spaces, and at different times of the day. Commuting data are analysed to explore the role of daily mobilities in shaping these patterns. The findings nuance understandings of levels of ethnic mixing, and emphasise the need for segregation analyses across multiple spatio-temporal contexts.
Introduction
Scholars of ethnic and racial segregation have largely focussed on where people live, but there have been calls for greater consideration of inter-ethnic mixing within and across non-residential activities and domains (Kwan Citation2013; Tammaru et al. Citation2021; van Ham and Tammaru Citation2016; Wong and Shaw Citation2011). In the UK, as elsewhere, a considerable body of research has documented the nature and extent of ethnic residential segregation and diversity. Neighbourhood segregation has reduced for people in racially minoritised groups (Catney Citation2016a; Finney and Simpson Citation2009; Johnston, Poulsen, and Forrest Citation2013), alongside growing ethnic diversity within, and beyond, urban areas (Catney Citation2016b; Catney, Wright, and Ellis Citation2020; Johnston, Poulsen, and Forrest Citation2015). Considerably less attention has been paid to workplace geographies of ethnicity than residential (and, indeed school; e.g. Burgess, Wilson, and Lupton Citation2005; Harris and Johnston Citation2020) environments. Given that most employed people spend a large proportion of their time where they work, the residential geographies of the working population may mask important dynamics of inter-group interactions between spaces, and at different times of the day.
In response to this gap, we compare the geographies of work-based and residential ethnic segregation and diversity. 2011 Census data for England and Wales offer considerable analytical potential to explore the extent of integration both where people live and work, by providing information on the workday (‘daytime’), workplace (‘employment’) and working age usual resident (‘nighttime’) populations (definitions of each population base are provided in the Data section). As with the ‘usual’ (residential) population base, data for these alternative (workday and workplace) bases are provided by ethnic group, and for relatively small geographical areas. To compare local-level data for the three bases, we use data aggregated to the geography of Middle Layer Super Output Areas (MSOAs), which we also refer to as zones (our reasons for selecting this geography are discussed in the Data section). The data do not enable an assessment of the level of interactions within the workplace, or the extent that social contacts are formed through working together (Ellis, Wright, and Parks Citation2004). However, they do offer insights into levels of ‘mixing’ between ethnic groups in the workplace locale. Our findings concur with, and expand, the limited but growing body of research exploring the multiple spatial contexts in which people of different ethnic and racial groups might mix and interact.
The geographies of home and work
Assessing the degree of inter-group mixing within the population across residential geographies alone is unlikely to fully reflect the extent of interactions between people of different ethnic and racial groups (Blumen and Zamir Citation2001; Lan, Kandt, and Longley Citation2020; Wong and Shaw Citation2011), particularly when we consider what proportion of people’s time is spent, and activities are undertaken, outside the home environment. ‘Daytime’ geographies – including employment and educational spaces – are likely to offer opportunities for interactions with a wider pool of people compared to ‘nighttime’ (residential) geographies. The extent to which these interactions beyond the residential neighbourhood are ultimately between people of the same sociodemographic and/or ethnic or racial groups has been the subject of increasing attention (Hedman et al. Citation2021; Moya-Gómez et al. Citation2021; Silm and Ahas Citation2014; Xu Citation2021; Yip, Forrest, and Xian Citation2016). Kwan’s (Citation2013, 1079) call for more temporally integrated geographies emphasises the importance of paying attention to the everyday (im)mobilities that shape experiences of segregation and exclusion as people’s ‘daily lives unfold’, while Tammaru et al.’s (Citation2021, 65) ‘vicious circles of segregation’ framework highlights the spatial and temporal ‘connectedness’ of segregation across life domains such as residential, school, workplace, and leisure spaces.
Ellis et al.’s (Citation2004) comparison of employment and residential segregation in Los Angeles found that although some immigrant and racial groups had high work-based clustering, they were more spatially concentrated residentially. They argue that "When workers commute, ... the tract of residence of one group often becomes the tract of employment of others. It follows that an exclusive focus on the residential geographies of racial groups erases the presence of others who work in those neighborhoods. Not only does this analytical orientation create a false impression of a city's racialized spaces as fixed, but it also misleadingly characterizes neighborhoods as the domain of those who live, rather than work, in them." (Ellis, Wright, and Parks Citation2004, 620). Their research (see also Wright, Ellis, and Parks Citation2010) paved the way for future scholarship on the relationships between segregation in employment and residential geographies (e.g. Hu, Moayyed, and Frank Citation2020; Marcińczak et al. Citation2015), and similar findings have been made elsewhere. For example, Strömgren et al. (Citation2014) showed greater residential than workplace segregation in Sweden, between immigrants and the Swedish-born population. A separate longitudinal study of Middle Eastern, Asian, African and South American immigrants in Sweden found that, although immigrants were more exposed to people born in Sweden residentially than at work, five years after arrival levels of workplace exposure had increased, whilst immigrants were less exposed residentially to the Swedish-born population (Tammaru et al. Citation2016). In the United States, Hall, Iceland, and Yi (Citation2019) demonstrated that segregation in ‘workhoods’ was considerably lower than in residential environments, but that workhood segregation was higher in more residentially segregated metropolitan areas. Ray (Citation2008) highlighted spatial variations in residential and workplace representation of immigrants and visible minority ethnic groups in several major Canadian cities. Although most of these studies found evidence that people from minority ethnic groups were less segregated from the rest of population outside of the residential neighbourhood (Hall, Iceland, and Yi Citation2019; Hu, Moayyed, and Frank Citation2020; Marcińczak et al. Citation2015; Silm and Ahas Citation2014), Glitz (Citation2014) reported greater workplace segregation than residential segregation in Germany, in part explained by employment niching.
Both language proficiency and sharing a language can play a role in how integrated people from ethnic and immigrant groups are at work (Andersson et al. Citation2014; Glitz Citation2014; Hellerstein and Neumark Citation2008). In research into workplace concentration in the United States, Andersson et al. (Citation2014) suggested that English language skills helped explain why immigrants were more likely to work together. Also in the United States, Hellerstein and Neumark (Citation2008) observed that Hispanic workers who did not speak English well were more segregated from non-Hispanic workers (with low levels of English language proficiency) than they were from other Hispanic workers (with greater proficiency in English). In Germany, Glitz (Citation2014) noted that people from different countries with languages in common appeared to be less segregated in the workplace.
Several studies have highlighted why diverse social contacts and networks are important, especially for people from minoritised groups (e.g. Cheung Citation2014; Muttarak Citation2014; Peters, Finney, and Kapadia Citation2019; Putnam Citation2000; Silm et al. Citation2021), with increased interactions between people from different (ethnic) groups potentially leading to greater trust, and reduced intolerance (Allport Citation1954). Sturgis et al. (Citation2014) showed that neighbourhood ethnic diversity was positively associated with perceived social cohesion in London, while the reverse was true for residential segregation. In relation to mixing beyond residential environments, Pickering (Citation2006) observed that in Bosnia in the late 1990s and early 2000s, contact at work between people from different ethnic groups led to positive out-of-work socialising. Relatedly, research on individuals born in the 21 countries included in the European Social Survey found that people who were ‘native-born’ were more likely to have friends who were immigrants if they had immigrant co-workers (Kokkonen, Esaiasson, and Gilljam Citation2015). Mixing in a number of activities, including at work, may increase opportunities for people to have friends from different ethnic groups (Muttarak Citation2014). Whether those who are employed socialise and engage in activities beyond paid employment in spaces outside of their residential environment will of course depend on their familial and other responsibilities and commitments (Yip, Forrest, and Xian Citation2016; see also Hilbrecht et al. Citation2013; van Ham and Tammaru Citation2016), as well as factors such as the distance from their workplace (Champion, Coombes, and Brown Citation2009) and the nature of employment (Marcińczak et al. Citation2015). For example, those in managerial roles may have limited interactions with people employed in lower-skilled occupations (van Ham and Tammaru Citation2016).
In recognition of the different experiences of segregation and diversity between spaces across the working day, we take advantage of an under-utilised dataset that allows us to compare residential (nighttime) ethnic segregation with segregation in daytime and workplace environments; we also compare the geographies of ethnic diversity for the three population bases. Finally, we consider how the movement of people, between their homes and places of work, may contribute to patterns of ethnic segregation and diversity.
Data
We use data for 11 major ethnic groups from the 2011 Census for England and Wales (). The residential, workday and workplace population bases () each include many of the same people of working age, with population sizes reflecting the contexts in which people were (or were not) counted: (i) the usual resident (residential) population aged 16–74 (Office for National Statistics [ONS], Citation2019c) includes both people in employment and who are unemployed; these are considered the ‘nighttime’ population, as the data are based on where people lived; (ii) the workday population are considered the ‘daytime’ population (ONS Citation2019d). This population differs from the residential population in that people in employment (aged 16+) were recorded in the area in which they worked. The workday population additionally included people who lived in the area who were not employed (such as children under the age of 16 and people who were retired) (ONS Citation2019d; ONS Citation2014); (iii) the workplace (or ‘employed’) population (ONS Citation2019e) relates to where people aged 16–74 and in employment worked in England and Wales in 2011 (ONS Citation2014). The age ranges for the workday and workplace populations used in this study reflect those available from the published data.
Table 1. 2011 Census ethnic groups and aggregated categories for analyses.
Table 2. Number and percentage of people in each ethnic group for each population base, England and Wales, 2011.
shows the number and percentage of people from each ethnic group within the residential (aged 16–74), workday (all people aged 16 + in employment, plus residential population (all ages) not in employment) and workplace (aged 16–74 in employment) population bases. Reflecting their composition, the workday population (around 55.96 million people) was larger than the residential population (around 41.13 million people), and the workplace population was the smallest (around 26.41 million people) of the three population bases. The proportion of the total workplace population who identified as White British (81.44 percent) was slightly larger than both the residential (80.62 percent) and workday (80.49 percent) populations. Of the ten minority ethnic groups, only the Other White and Indian groups had larger percentages within the workplace population compared to the residential and workday population bases. The differences in percentages reflect the varying levels of labour market participation between ethnic groups (Kapadia, Nazroo, and Clark Citation2015; Clark and Shankley Citation2020).
Insights into daily mobilities (which we consider in the final aim of this paper) are provided through analysis of safeguarded 2011 Census origin-destination data (ONS Citation2019b), which provide information on where people aged 16 and over in employment lived (origin) and where they worked (destination). Only individuals whose area of residence and workplace were within England and Wales were included in the data. For confidentiality purposes, the total population for areas (either at origin or destination) with a population count of less than three is rounded to zero (UK Data Service Census Support Citation2020).
Our analyses are presented for the aggregate populations of Middle Layer Super Output Areas (MSOAs, also referred to as zones; n = 7,201), a statistical Census geography developed by the ONS designed to contain relatively consistent counts of people (5,000–15,000) and households (2,000–6,000) (ONS Citation2019a). Unlike the residential and workday bases, the smallest geography workplace data are published for is Workplace Zones (ONS Citation2019a). However, by aggregating data for each of the three bases to a shared higher geography of MSOAs, it is possible to compare segregation and diversity across these three population bases. Each zone has also been assigned to one of three types of area (shown in Figure A1, with key cities labelled): conurbations (large urban areas including Birmingham, London, Manchester, Newcastle, and Nottingham), cities and towns (including Exeter, Middlesbrough, Norwich, and Southampton in England, and most of Cardiff and Swansea in Wales), and rural areas (Rural-Urban Classification Consortium [RUCC], Citation2013).
Methods
Segregation
To explore whether segregation within workday and workplace populations differs from segregation within the residential population, we use the Index of Dissimilarity (D). A widely used measure of segregation (specifically, unevenness) (Massey and Denton Citation1988; Plane and Rogerson Citation1994), here D indicates the overall extent of ethnic group segregation within each of the three population bases. D quantifies the proportion of a given ethnic group that would need to live, or work, in another zone for an even population distribution to be achieved across England and Wales (Massey and Denton Citation1988).
The index is the sum of the difference between the zone (MSOA) population for a given ethnic group (as a proportion of the England and Wales population for that group), compared to the remaining zone population, as a proportion of the remaining England and Wales population.
is the count of people in ethnic group j in zone i and
is the count of people in ethnic group j in England and Wales.
is the count of all other ethnic groups in zone i,
is the count of people in all other ethnic groups in England and Wales, and there are r MSOAs. D is multiplied by 0.5, to give a range between 0 and 1. A D value of 0 indicates that there is no segregation because the proportion of each ethnic group is the same in each zone. A D value of 1 indicates that an ethnic group population is completely separated from the rest of the population – i.e. all zones are populated exclusively by one group or the other.
Ethnic diversity
We use the Interaction Index (S) to analyse the geographies of ethnic diversity within the three population bases. S values are calculated for each zone, measuring the extent to which each of the 11 ethnic groups are equally represented within the total population (see Plane and Rogerson Citation1994; White Citation1986). S has been applied in labour market research to measure diversity amongst employees (Suedekum, Wolf, and Blien Citation2014; Niebuhr Citation2010).
For each zone, S is equal to the square of the proportion of ethnic group j (
) within the total population
, with the proportions for all n (11) ethnic groups summed and subtracted from 1. A score closer to 1 suggests there is a higher likelihood of two people being from different ethnic groups (White Citation1986, 201). Plane and Rogerson (Citation1994, 303) note that the maximum value of the Interaction Index cannot reach 1. For all three populations, the highest value a zone could have if all 11 ethnic groups were represented equally would be 10/11 (therefore maximum S = 0.91).
Distance travelled to work
Finally, we examine mobility as a potential contributor to work-based segregation. It has been shown that people in racially minoritised groups make greater use of public transport than the White population, which can limit travel-to-work distances (Owen and Green Citation2000; see also Kwan Citation2013). Cebollada (Citation2009) found that people without access to private transport, and/or living in areas with inadequate public transport links, may face greater limitations in where they can seek – and engage in – employment. For each zone (MSOA), the average distances travelled to work by ethnic group (T), between zone of residence and zone of work, were computed with:
In each zone, the proportion of the total ethnic group population in employment (
) who travelled to a zone for work (
) was multiplied by the Euclidean distance
; that is, the distance in metres between the centroids of the residential and work zones. The values were summed, then divided by 1,000 to report the average distance in kilometres (T). The information illuminates how daily mobilities away from residential zones to workplace environments may contribute to the differing levels of segregation in home and workplace spaces.
The extent to which people were working locally in the zone in which they lived may also contribute to differences in patterns of segregation. Owen and Green (Citation2000) found that in Great Britain, people in minority ethnic groups were more likely to travel shorter distances to work than White employees. Not only does living and working in the same zone reduce the distance travelled to work, it may involve alternative forms of transport compared to longer distance commutes, potentially creating different types of opportunities for interaction between people from different ethnic groups (Boterman and Musterd Citation2016; Kwan Citation2013; van Ham and Tammaru Citation2016).
Results
Comparing segregation between residential and work-based environments
shows Index of Dissimilarity (D) values comparing ethnic group unevenness in each of the residential, workday and workplace populations. Residential segregation is pronounced for the Pakistani (D = 0.69) ethnic group. Similarly, more than three-fifths of 16–74 year olds in the Bangladeshi (D = 0.66) and Black Caribbean (D = 0.61) ethnic groups would have to move zone (MSOA) in order for their respective proportions of the total residential population base to be the same across every zone. The comparatively higher levels of neighbourhood-level concentration experienced by these three ethnic groups can be explained by historic migrant settlement patterns, targeted recruitment for employment in industry, and widespread inequalities in the housing and labour markets (Amin Citation2002; Clark and Shankley Citation2020; Peach Citation1998; Portes Citation2019; Virdee Citation2010), as well as social explanations including preferences for proximity to family or community-focussed services (Peach Citation2006; Phillips Citation1998; Simpson, Gavalas, and Finney Citation2008). Meanwhile, the lowest levels of residential segregation were found for the ethnic groups White Irish (D = 0.32), with a long history of immigration to Britain, and Mixed (D = 0.33), with typically higher rates of spatial ‘integration’ (Catney Citation2016a).
Figure 1. Index of Dissimilarity: Evenness of ethnic group population distributions in residential (16 to 74), workday and workplace population bases, England and Wales, 2011. Sources: Census of England and Wales 2011 (Tables DC2101EW; WD201EW; WP201EW) (ONS Citation2019c; Citation2019d; Citation2019e). Authors’ own calculations.
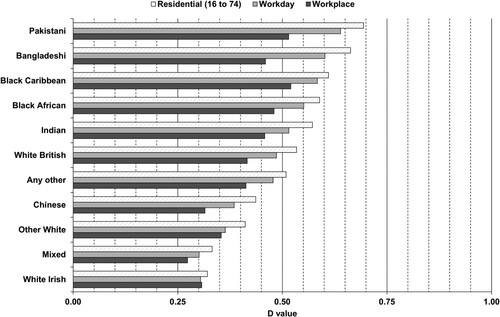
For the daytime (workday) population base, segregation is again highest for the Pakistani ethnic group (D = 0.64), followed by the Bangladeshi (D = 0.60) and Black Caribbean ethnic groups (D = 0.58). As with residential segregation, levels of unevenness are lowest for the Mixed (D = 0.30) and White Irish (D = 0.30) ethnic groups. However, for all 11 ethnic groups, levels of daytime segregation (all people in a zone aged 16 and above in employment, plus the total residential population not in employment) were lower than residential segregation (all people aged 16–74). As further examples, daytime segregation values for the Chinese (D = 0.39) and Indian (D = 0.52) ethnic groups were lower than residential segregation levels (D = 0.44 and 0.57, respectively). Consistent with the residential and daytime geographies, for the workplace population base (16–74 year olds in employment, within the zone in which they work), segregation was greatest for the Black Caribbean (D = 0.52) and Pakistani (D = 0.52) ethnic groups and least for the Mixed (D = 0.27), White Irish (D = 0.31), Chinese (D = 0.31) and Other White (D = 0.35) ethnic groups, but lower than residential segregation for all groups.
It is clear that relative levels of ethnic segregation differ, sometimes quite considerably, between residential and work-based geographies. For all ethnic groups bar White Irish, segregation is highest in residential zones, lower in daytime (workday) zones, and lowest for workplace zones. The differences between segregation in the residential neighbourhood and segregation in the zone of employment, are considerable. People of all ethnic groups are thus more exposed to people of different ethnic identities to their own in the daytime, compared to their home area (nighttime) spaces.
Comparing ethnic diversity between residential and work-based environments
Maps of Interaction Index (S) values () illustrate the geographies of (a) nighttime, (b) daytime, and (c) workplace ethnic diversity. All zones (MSOAs; n = 7,201) were grouped into five categories based on their S values (<0.20; > = 0.20 to <0.40; > = 0.40 to <0.60; > = 0.60 to <0.80; > = 0.80), with higher S values indicating greater ethnic diversity. The maximum S value was 0.88, for the daytime population of a zone in the district of Newham in London.
Figure 2. (a-c): Interaction Index: Ethnic diversity within the residential (16 to 74), workday and workplace populations (number of zones in brackets), England and Wales, 2011. Sources: Census of England and Wales 2011 (Tables DC2101EW; WD201EW; WP201EW) (ONS Citation2019c; Citation2019d; Citation2019e). Authors’ own calculations.
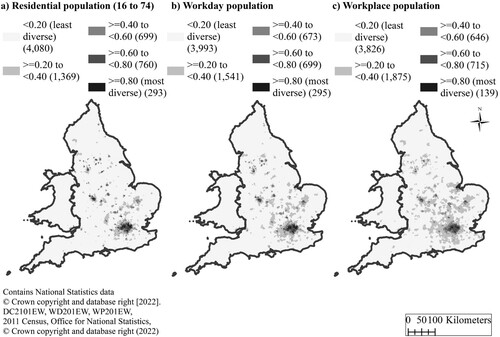
a shows that zones with highly ethnically diverse nighttime populations (S > = 0.80) were, unsurprisingly, mainly located in conurbations (large urban areas), including London and Birmingham. However, the mean residential S value for zones in conurbations was 0.43, reflecting the high variability in levels of ethnic diversity within large urban areas. By contrast, more than half of zones (4,080, or 56.66 percent) in England and Wales had very low levels of residential ethnic diversity (S <0.20). The mean residential diversity level for zones located in cities and towns was just 0.21, and 0.10 for rural areas.
The zones with the most ethnically diverse daytime (workday) populations (b) were mostly those with highly ethnically diverse nighttime (residential) populations. As with the residential population, zones with the highest levels of workday diversity were primarily found in large English cities. In addition to there being slightly more highly-diverse zones (S > = 0.80) in the workday (295 of 7,201) compared to residential (293) geography, fewer zones were in the least diverse category (S <0.20) in the workday (3,993) than residential (4,080) geography. Comparisons between nighttime and daytime ethnic diversity (a) indicate that variations in S values could be minor (within +/– 0.10 of the residential S value). However, many of the zones with much greater workday ethnic diversity than residential diversity were located outside of conurbations.
Figure 3. (a-b): Differences between residential (16 to 74) and work-based S values. Sources: Census of England and Wales 2011 (Tables DC2101EW; WD201EW; WP201EW) (ONS Citation2019c; Citation2019d; Citation2019e). Authors’ own calculations.
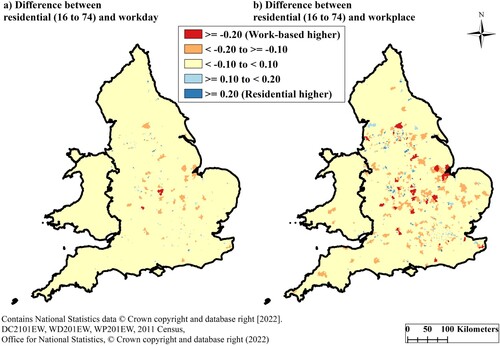
Within the workplace population (employed 16–74 year olds) (c), there were fewer zones with highly diverse (S > = 0.80) workplace populations (139) compared to workday (295) and residential (293) populations. Yet there were also fewer zones (MSOAs) with low (S <0.20) workplace diversity (3,826) compared to the residential (4,080) geography. Instead, there were a greater number of workplace zones with intermediate levels of ethnic diversity (S > = 0.20 to <0.80) compared to the other two population bases (3,236 workplace zones, compared with 2,913 workday zones and 2,828 residential zones). Zones in which workplace ethnic diversity was much greater than residential diversity (b) were primarily located in rural and smaller urban areas. In the next section we explore the likely role that commuting has in creating daily temporal variations in ethnic mixing, particularly within these more rural spaces.
Distance between home and work spaces
The differences in segregation and diversity observed between the residential and workplace environments are suggestive of the role of daily mobilities in shaping inter-ethnic mixing. Knowing more about the distance people travelled between activity spaces (Kwan Citation2013; Owen and Green Citation2000) might provide insight into why workplace segregation was lower than residential segregation, as well as why the extent of ethnic diversity in some zones changed considerably between day- and nighttime geographies. presents the mean average distance travelled (in kilometres) between home and work zones, for people aged 16 and over, for each ethnic group. The values are shown for three area types (‘Conurbation’, ‘City and Town’, ‘Rural’) (RUCC Citation2013).
Table 3. Mean average distance travelled (km) from place of residence to place of work, by ethnic group, for Rural Urban Classification categories, England and Wales, 2011.
For all but one ethnic group (Black Caribbean), people living in rural zones, unsurprisingly, travelled the longest mean average distances to work from their place of residence. The White British population had the longest mean commute of all ethnic groups (13.52 km for rural areas). People in the Bangladeshi and Pakistani ethnic groups living in rural areas also, on average, travelled over 10 km to their place of employment. However, whilst around a fifth of the White British population lived in rural areas in 2011, less than 2 percent of the Bangladeshi population and less than 1 percent of the Pakistani population resided in rural locales (Supplemental data). The number of people undertaking these daily flows is, of course important in the context of considering the mechanisms behind the changing patterns of mixed spaces between day- and nighttime. For example, people from the Black Caribbean ethnic group who lived in conurbations travelled longer mean distances to work (6.39 km) than for other area types, and this ethnic group also had the largest percentages, of all groups, of people living and working in conurbations (80.17 and 78.37 percent respectively; see Supplemental data). Over half of people in each minority ethnic group were either living in conurbations, or present in conurbations during the daytime or for employment. Eight of the ten minority ethnic groups had smaller percentages of people working in conurbations compared to living in them (the two exceptions were the White Irish and Chinese ethnic groups). The larger percentage of White British people working in conurbations (33.50 percent) than living in them (31.06 percent) are likely to have contributed to a more evenly distributed population during the day than at night.
The extent to which people were living and working within the same zone may be an indication of smaller or overlapping activity spaces (Silm et al. Citation2021; Tammaru et al. Citation2021). presents the mean average of the percentages of each total ethnic group population in a zone who worked locally.
Table 4. Mean percentages of employees working and living in the same zone, by ethnic group, for Rural Urban Classification categories, England and Wales, 2011.
Across all area types, a larger mean proportion of people in minority ethnic groups than the White British ethnic group worked locally. On average, only 7.24 percent of White British conurbation residents, and 11.96 percent of White British city and town residents, lived and worked in the same zone. In rural areas, on average 91.28 percent of people in the Pakistani ethnic group worked locally, a percentage slightly higher than that of Black Caribbean (89.49 percent) and Chinese (88.02 percent) ethnic groups. By comparison, on average 18.65 percent of rural residents from the White British ethnic group lived and worked in the same zone. That larger mean percentages of people from each ethnic group were working locally in rural zones compared with urban zones is not surprising, given that MSOAs were designed to have constant population sizes and thus they are larger in sparsely populated rural areas.
Discussion and conclusions
Motivated by emerging frameworks for segregation research across space and time (e.g. Kwan Citation2013; Tammaru et al. Citation2021; van Ham and Tammaru Citation2016), this paper has explored variations in ethnic segregation and diversity between residential, workday and workplace population bases in England and Wales. We find more evenly distributed populations in work-based than residential zones (Middle Layer Super Output Areas), for all ethnic groups. This suggests that, for those in employment at least, there is greater inter-ethnic ‘mixing’ in the working day than as suggested by analyses that solely focus on residential spaces. Our findings have commonalities with international research into workplace geographies (Ellis, Wright, and Parks Citation2004; Marcińczak et al. Citation2015; Strömgren et al. Citation2014).
For each population base, we find that the Pakistani, Bangladeshi, Black Caribbean and Black African ethnic groups were more unevenly distributed than other ethnic groups. However, noticeable differences between residential and workplace segregation levels were observed. For example, compared to the residential population, around 20 percent fewer people from the Bangladeshi ethnic group, and around 18 percent fewer people from the Pakistani ethnic group, would need to work in a different zone for there to be an even population distribution. In relation to ethnic diversity, we find that in some spaces, the diversity of the nighttime population is notably different to that of the daytime and/or workday populations. Our findings tentatively support a hypothesis of greater inter-ethnic group interactions in daytime activities, such as travelling to and engaging in employment (Silm and Ahas Citation2014; van Ham and Tammaru Citation2016; Wong and Shaw Citation2011).
The nature of commuting flows sheds some light on the reasons behind the differences between ethnic segregation and diversity by residence, workday and workplace. The mean average travel-to-work distances and local employment patterns ( and ) showed that people in the White British ethnic group travelled further, on average, to their place of employment and were less likely to live and work in the same zone, compared with each minority ethnic group. These commuting patterns, and the dominant size of the White British ethnic group, suggest greater inter-ethnic mixing between the White British population and people in minoritised ethnic groups in workplace settings than is evidenced by analysis of residential patterns alone. Compared with other ethnic groups, across all area types (Conurbation, City and Town, Rural) the mean distances show that a large proportion of people who identified as Chinese or Bangladeshi worked locally, or lived and worked in the same zone. For the Chinese group, this might reflect occupational niching within smaller urban areas, such as in catering and food service industries (Chan and Chan Citation1997; Luk Citation2009). The relatively localised geographies of employment of people from the Bangladeshi ethnic group in urban areas are likely to relate tothe population’s uneven residential distribution (Catney Citation2016a; Peach Citation1998).
The commuting trends may seem, at first sight, contradictory when the segregation and diversity analyses are considered. The Pakistani group, for example, has high levels of unevenness compared to other groups across all population bases, but the group also has large differences between segregation levels. However, this group has large mean percentages of people who live and work in the same MSOA, thus suggesting that the difference in segregation by residence and workplace, for example, would be relatively smaller than for other groups whose members were less likely to live and work in the same MSOA. In practice, these results are explained by the comparatively higher residential segregation levels for this group, which means that even numerically small commuting flows out of the area of residence would lead to relatively lower segregation levels for workplace (and workday) than for residence. In short, residential segregation levels for a given ethnic group are a good predictor of the degree to which workplaces may be more mixed than residential areas.
Taken together, the findings suggest that there is greater potential for inter-ethnic mixing as a result of ‘everyday’ daytime activities within workplace spaces, such as buying lunch or using public transport, which, in turn, could feasibly create more opportunities for more diverse social networks (Ellis, Wright, and Parks Citation2004; Hall, Iceland, and Yi Citation2019; Kokkonen, Esaiasson, and Gilljam Citation2015; Kwan Citation2013; van Ham and Tammaru Citation2016 and see also Martin, Cockings, and Leung Citation2015). Of course, the level of ethnic diversity in a workplace locale is not necessarily indicative of the nuanced interactions between people within the same workplace (Glitz Citation2014; Marcińczak et al. Citation2015), and it is important not to over-play the potential for daytime diversities to signify meaningful interactions between people of different ethnic and racial backgrounds. Our research provides insights into differences in mixing in the locales in which people work, but not within their workplace – in shared offices, in the staff common room. Further research on the extent of diversity within British workplaces, similar to that undertaken in Sweden by Bygren (Citation2013) and in the United States by Andersson et al. (Citation2014) and Smith and Elliott (Citation2002), would increase understanding of workplace interactions. Our analyses also cannot reveal what types of interactions people have in work environments, and whether these interactions have any influence on people’s home lives (Ellis, Wright, and Parks Citation2004; Strömgren et al. Citation2014), friendship groups (Muttarak Citation2014), or feelings of social cohesion or trust (Allport Citation1954; Sturgis et al. Citation2014; Valentine and Sadgrove Citation2012, Citation2014).
There are potentially important inequalities of opportunity for these interactions, which may vary by factors such as social class and income (Hu, Moayyed, and Frank Citation2020; Muttarak Citation2014). The observed differences in segregation and diversity between residential and work-based populations, as well as the noticeably greater extent of local working by people from minoritised ethnic groups compared to the White British group, may be reflective of established minority ethnic (under-)representation within and between types of employment (Blumen and Zamir Citation2001; Wright, Ellis, and Parks Citation2010; Li and Heath Citation2010). There may also be important gender differences in work-based mixing. For example, lower economic activity rates for Bangladeshi and Pakistani women, partly due to differences in caregiving ‘norms’ (Clark and Shankley Citation2020), might mean that, for these ethnic groups, the difference between residential and workplace segregation might be lower for women. Unfortunately, it was not possible to explore this line of analysis in this paper, given that published Census workplace and workday data were not disaggregated by both ethnic group and sex.Footnote1
Our explorations of distance travelled to work, and the relatively lower rates of White British people who are employed in their local neighbourhood, raise questions as to whether people who travel further to work would spend less time networking and socialising in their work zone, compared with people working in closer proximity to their residential neighbourhood (Boterman and Musterd Citation2016; Champion, Coombes, and Brown Citation2009; Kwan Citation2013; van Ham and Tammaru Citation2016). Interactions may depend on how journeys are made to work, such as mode of transport, and distance and length of time spent commuting (van Ham and Tammaru Citation2016; see also Boterman and Musterd Citation2016; Cebollada Citation2009; Kwan Citation2013; Moya-Gómez et al. Citation2021; Owen and Green Citation2000).
To summarise, the findings of this paper act to complicate dominant understandings of the ethnic geographies of England and Wales. The analyses of workspace inter-ethnic mixing reveal greater levels of ethnic diversity, and lower levels of ethnic segregation, than analyses of residential patterns alone. A next step might be to explore the inter-relation of work-based and residential segregation across the lifecourse (Tammaru et al. Citation2021). Future research into opportunities for work-based mixing should consider how Britain leaving the European Union (Brexit) may have an impact on ethnic group distributions within occupations and industries. For example, the greater representation of the Other White ethnic group in the rural workplace population compared to the residential population (Supplemental data) was likely to be due to the employment of people from (principally Eastern) Europe in rural food-based industries (McGuinness Citation2017; McGuinness and Garton Grimwood Citation2017), yet the proportion of EU nationals in paid employment has been falling (e.g. by 6% between 2019 and 2021) (ONS Citation2022c). In recent years, the COVID-19 pandemic has had a profound impact on the UK labour market. Ethnic inequalities have been noted in terms of job losses and furlough (Hu Citation2020), with people from minority ethnic groups more likely to have changed job in the year following the commencement of the first COVID-19 lockdown, compared to people from White ethnic groups (Crossley et al. Citation2021). Inequalities were also observed in employment in sectors unable to operate due to pandemic-related restrictions (Blundell et al. Citation2020; Platt and Warwick Citation2020). Analysis of the Understanding Society COVID-19 study (Marzec, Nandi, and Patel Citation2021) found that during January 2021, people from Mixed and Bangladeshi and Pakistani ethnic groups were significantly less likely to work at home all of the time, compared to people from the White UK ethnic group. The potential implications of large-scale working from home implemented during the pandemic for the kinds of inter-ethnic contact considered in this study are potentially significant. As De Fraja, Matheson, and Rockey (Citation2021, 1) suggest, "When a person works from home rather than at the office, their work-related consumption of goods and services provided by the locally consumed service industries will take place where they live, not where they work. Much of the clientèle of restaurants, coffee bars, pubs, hair stylists, health clubs, taxi providers and the like located near workplaces is transferred to establishments located near where people live". A potentially important avenue for future research lies in considering how far the longer-term impacts of the pandemic have disrupted the dynamics of ethnic and racial mixing within and between residential and work-based environments.
Supplemental Material
Download PDF (77.5 KB)Supplemental Material
Download PDF (45.5 KB)Supplemental Material
Download JPEG Image (2.2 MB)
Acknowledgements
The authors would like to thank the ESRC for their support for the PhD studentship which enabled the writing of this article. We thank John Murray for using Fusion Data Science Spatia software to calculate the Euclidean distance from residential MSOAs to workplace MSOAs. We also thank the anonymous reviewers of this paper for their feedback.
Disclosure statement
No potential conflict of interest was reported by the author(s).
Data availability statement
The following 2011 Census data were publicly accessible from Nomis (https://www.nomisweb.co.uk/): Table DC2101EW (usual resident population), Table WD201EW (workday population), Table WP201EW (workplace population). Origin-destination data (Table WU08BEW) were extracted from WICID (https://wicid.ukdataservice.ac.uk/). The origin-destination data were safeguarded, meaning that researchers were required to log in through their University and agree to the terms of the UK Data Service End User Licence before accessing information.
Additional information
Funding
Notes
1 It may be possible to explore these gender differences in future research via commissioned tables for 2011 data (ONS Citation2022a; note that, at the time of writing, it is not known if such analyses will be possible for Census 2021 data (ONS Citation2022b)).
References
- Allport, G. W. 1954. The Nature of Prejudice. Cambridge, Massachusetts, United States: Addison-Wesley Publishing Company, Inc.
- Amin, A. 2002. “Ethnicity and the Multicultural City: Living with Diversity.” Environment and Planning A: Economy and Space 34 (6): 959–980. doi:10.1068/a3537.
- Andersson, F., M. García-Pérez, J. Haltiwanger, K. McCue, and S. Sanders. 2014. “Workplace Concentration of Immigrants.” Demography 51 (6): 2281–2306.
- Blumen, O., and I. Zamir. 2001. “Two Social Environments in a Working Day: Occupation and Spatial Segregation in Metropolitan Tel Aviv.” Environment and Planning A: Economy and Space 33 (10): 1765–1784. doi:10.1068/a3452.
- Blundell, R., M. Costa Dias, R. Joyce, and X. Xu. 2020. “COVID-19 and inequalities*.” Fiscal Studies 41 (2): 291–319. https://doi-org.liverpool.idm.oclc.org/10.11111475-5890.12232.
- Boterman, W. R., and S. Musterd. 2016. “Cocooning Urban Life: Exposure to Diversity in Neighbourhoods, Workplaces and Transport.” Cities 59: 139–147. doi:https://doi.org/10.1016/j.cities.2015.10.018.
- Burgess, S., D. Wilson, and R. Lupton. 2005. “Parallel Lives? Ethnic Segregation in Schools and Neighbourhoods.” Urban Studies 42 (7): 1027–1056. doi:10.1080/00420980500120741.
- Bygren, M. 2013. “Unpacking the Causes of Segregation Across Workplaces.” Acta Sociologica 56 (1): 3–19. doi:10.1177/0001699312468802.
- Catney, G. 2016a. “Exploring a Decade of Small Area Ethnic (de-)Segregation in England and Wales.” Urban Studies 53 (8): 1691–1709. doi:10.1177/0042098015576855.
- Catney, G. 2016b. “The Changing Geographies of Ethnic Diversity in England and Wales, 1991–2011.” Population, Space and Place 22 (8): 750–765. doi:10.1002/psp.1954.
- Catney, G., R. Wright, and M. Ellis. 2020. “The Evolution and Stability of Multi-Ethnic Residential Neighbourhoods in England.” Transactions of the Institute of British Geographers n/a. doi:10.1111/tran.12416.
- Cebollada, À. 2009. “Mobility and Labour Market Exclusion in the Barcelona Metropolitan Region.” Journal of Transport Geography 17 (3): 226–233. doi:https://doi.org/10.1016/j.jtrangeo.2008.07.009.
- Champion, T., M. Coombes, and D. L. Brown. 2009. “Migration and Longer-Distance Commuting in Rural England.” Regional Studies 43 (10): 1245–1259. doi:10.1080/00343400802070902.
- Chan, Y. M., and C. Chan. 1997. “The Chinese in Britain.” Journal of Ethnic and Migration Studies 23 (1): 123–131. doi:10.1080/1369183X.1997.9976579.
- Cheung, S. Y. 2014. “Ethno-religious Minorities and Labour Market Integration: Generational Advancement or Decline?” Ethnic and Racial Studies 37 (1): 140–160. doi:10.1080/01419870.2013.808757.
- Clark, K., and W. Shankley. 2020. “Ethnic Minorities in the Labour Market in Britain.” In Ethnicity, Race and Inequality in the UK: State of the Nation, edited by B. Byrne, C. Alexander, O. Khan, J. Nazroo, and W. Shankley, 127–148. Bristol: Policy Press.
- Crossley, T. F., P. Fisher, P. Levell, and H. Low. 2021. “A Year of COVID: The Evolution of Labour Market and Financial Inequalities through the Crisis.” SSRN Electronic Journal, doi:10.2139/ssrn.3955892.
- De Fraja, G., J. Matheson, and J. C. Rockey. 2021. “Zoomshock: The Geography and Local Labour Market Consequences of Working from Home.” SSRN Electronic Journal 64: 1–41. Advance online publication. doi:10.2139/ssrn.3752977.
- Ellis, M., R. Wright, and V. Parks. 2004. “Work Together, Live Apart? Geographies of Racial and Ethnic Segregation at Home and at Work.” Annals of the Association of American Geographers 94 (3): 620–637. doi:10.1111/j.1467-8306.2004.00417.x.
- Finney, N., and L. Simpson. 2009. Sleepwalking to Segregation'?: Challenging Myths About Race and Migration. Bristol, UK: Policy Press.
- Glitz, A. 2014. “Ethnic Segregation in Germany.” Labour Economics 29: 28–40. doi:https://doi.org/10.1016/j.labeco.2014.04.012.
- Hall, M., J. Iceland, and Y. Yi. 2019. “Racial Separation at Home and Work: Segregation in Residential and Workplace Settings.” Population Research and Policy Review, 1–24. doi:10.1007/s11113-019-09510-9.
- Harris, R., and R. Johnston. 2020. Ethnic Segregation Between Schools: Is it Increasing or Decreasing in England? Bristol University Press. doi:10.46692/9781529204797.
- Hedman, L., K. Kadarik, R. Andersson, and J. Östh. 2021. “Daily Mobility Patterns: Reducing or Reproducing Inequalities and Segregation?” Social Inclusion 9 (2): 208–221. doi:10.17645/si.v9i2.3850.
- Hellerstein, J. K., and D. Neumark. 2008. “Workplace Segregation in the United States: Race, Ethnicity, and Skill.” Review of Economics and Statistics 90 (3): 459–477. doi:10.1162/rest.90.3.459.
- Hilbrecht, M., S. M. Shaw, L. C. Johnson, and J. Andrey. 2013. “Remixing Work, Family and Leisure: Teleworkers’ Experiences of Everyday Life.” New Technology, Work and Employment 28 (2): 130–144. doi:10.1111/ntwe.12010.
- Hu, Y. 2020. “Intersecting Ethnic and Native–Migrant Inequalities in the Economic Impact of the COVID-19 Pandemic in the UK.” Research in Social Stratification and Mobility 68: 100528. doi:https://doi.org/10.1016/j.rssm.2020.100528.
- Hu, L., H. Moayyed, and N. Frank. 2020. “Racial/Ethnic and Class Segregation at Workplace and Residence: A Los Angeles Case Study.” Journal of Urban Affairs, 1–19. doi:10.1080/07352166.2020.1782224.
- Johnston, R., M. Poulsen, and J. Forrest. 2013. “Commentary: Multiethnic Residential Areas in a Multiethnic Country? A Decade of Major Change in England and Wales.” Environment and Planning A: Economy and Space 45 (4): 753–759. doi:10.1068/a4688.
- Johnston, R., M. Poulsen, and J. Forrest. 2015. “Increasing Diversity Within Increasing Diversity: The Changing Ethnic Composition of London's Neighbourhoods, 2001–2011.” Population, Space and Place 21 (1): 38–53. doi:10.1002/psp.1838.
- Kapadia, D., J. Nazroo, and K. Clark. 2015. “Have Ethnic Inequalities in the Labour Market Persisted?” In Ethnic Identity and Inequalities in Britain: The Dynamics of Diversity, edited by S. Jivraj, and L. Simpson, 161–179. Bristol, UK: Policy Press.
- Kokkonen, A., P. Esaiasson, and M. Gilljam. 2015. “Diverse Workplaces and Interethnic Friendship Formation—A Multilevel Comparison Across 21 OECD Countries.” Journal of Ethnic and Migration Studies 41 (2): 284–305. doi:10.1080/1369183X.2014.902300.
- Kwan, M.-P. 2013. “Beyond Space (as we knew it): Toward Temporally Integrated Geographies of Segregation, Health, and Accessibility.” Annals of the Association of American Geographers 103 (5): 1078–1086. doi:10.1080/00045608.2013.792177.
- Lan, T., J. Kandt, and P. Longley. 2020. “Geographic Scales of Residential Segregation in English Cities.” Urban Geography 41 (1): 103–123. doi:10.1080/02723638.2019.1645554.
- Li, Y., and A. Heath. 2010. “Struggling Onto the Ladder, Climbing the Rungs: Employment and Class Position of Minority Ethnic Groups in Britain.” In Spatial and Social Disparities: Understanding Population Trends and Processes, edited by J. Stillwell, P. Norman, C. Thomas, and P. Surridge, 83–97. Dordrecht: Springer.
- Luk, W. E. 2009. “Chinese Ethnic Settlements in Britain: Spatial Meanings of an Orderly Distribution, 1981–2001.” Journal of Ethnic and Migration Studies 35 (4): 575–599. doi:10.1080/13691830902765137.
- Marcińczak, S., T. Tammaru, M. Strömgren, and U. Lindgren. 2015. “Changing Patterns of Residential and Workplace Segregation in the Stockholm Metropolitan Area.” Urban Geography 36 (7): 969–992. doi:10.1080/02723638.2015.1012364.
- Martin, D., S. Cockings, and S. Leung. 2015. “Developing a Flexible Framework for Spatiotemporal Population Modeling.” Annals of the Association of American Geographers 105 (4): 754–772. doi:10.1080/00045608.2015.1022089.
- Marzec, P., A. Nandi, and R. Patel. 2021. Understanding Society COVID-19 Survey Briefing Note: Working at home. Retrieved from: https://www.understandingsociety.ac.uk/research/publications/547026.
- Massey, D. S., and N. A. Denton. 1988. “The Dimensions of Residential Segregation.” Social Forces 67 (2): 281–315.
- McGuinness, F. 2017. Employment of other EU nationals in the UK (Report No. 8069). House of Commons Library. https://commonslibrary.parliament.uk/research-briefings/cbp-8069/.
- McGuinness, T., and G. Garton Grimwood. 2017. Migrant workers in agriculture (Report No. 7987). House of Commons Library. https://commonslibrary.parliament.uk/research-briefings/cbp-7987/.
- Moya-Gómez, B., M. Stępniak, J. C. García-Palomares, E. Frías-Martínez, and J. Gutiérrez. 2021. “Exploring Night and day Socio-Spatial Segregation Based on Mobile Phone Data: The Case of Medellin (Colombia).” Computers, Environment and Urban Systems 89: 1–12. doi:https://doi.org/10.1016/j.compenvurbsys.2021.101675.
- Muttarak, R. 2014. “Generation, Ethnic and Religious Diversity in Friendship Choice: Exploring Interethnic Close Ties in Britain.” Ethnic and Racial Studies 37 (1): 71–98. doi:10.1080/01419870.2014.844844.
- Niebuhr, A. 2010. “Migration and Innovation: Does Cultural Diversity Matter for Regional R&D Activity?” Papers in Regional Science 89 (3): 563–585. doi:10.1111/j.1435-5957.2009.00271.x.
- Office for National Statistics. 2014. 2011 Census glossary of terms (Report No. V.10). https://www.ons.gov.uk/census/2011census/2011censusdata/2011censususerguide/glossary.
- Office for National Statistics. 2019a. Census geography. Retrieved from https://www.ons.gov.uk/methodology/geography/ukgeographies/censusgeography.
- Office for National Statistics. 2019b. 2011 SWS MSOA [location of usual residence and place of work by ethnic group (with ‘outside UK’ collapsed)] - WU08BEW - safeguarded [Data set]. Office for National Statistics, from the UK Data Service (WICID).
- Office for National Statistics. 2019c. DC2101EW - ethnic group by sex by age [Data set]. Office for National Statistics, from Nomis.
- Office for National Statistics. 2019d. WD201EW - ethnic group [Data set]. Office for National Statistics, from Nomis.
- Office for National Statistics. 2019e. WP201EW - ethnic group (workplace population) [Data set]. Office for National Statistics, from Nomis.
- Office for National Statistics. 2022a. 2011 Census ad-hoc tables. https://www.ons.gov.uk/census/2011census/2011censusdata/2011censusadhoctables.
- Office for National Statistics. 2022b, July 19. Release plans. https://www.ons.gov.uk/census/aboutcensus/releaseplans.
- Office for National Statistics. 2022c. Changes in payrolled employments held by non-UK nationals during the coronavirus (COVID-19) pandemic and EU Exit periods. https://www.ons.gov.uk/peoplepopulationandcommunity/populationandmigration/internationalmigration/articles/changesinpayrolledemploymentsheldbynonuknationalsduringthecoronaviruscovid19pandemicandeuexitperiods/2022-03-01.
- Owen, D., and A. E. Green. 2000. “Estimating Commuting Flows for Minority Ethnic Groups in England and Wales.” Journal of Ethnic and Migration Studies 26 (4): 581–608. doi:10.1080/713680500.
- Peach, C. 1998. “South Asian and Caribbean Ethnic Minority Housing Choice in Britain.” Urban Studies 35 (10): 1657–1680. doi:10.1080/0042098984097.
- Peach, C. 2006. “South Asian Migration and Settlement in Great Britain, 1951–2001.” Contemporary South Asia 15 (2): 133–146. doi:10.1080/09584930600955234.
- Peters, S., N. Finney, and D. Kapadia. 2019. “How is the Benefit of Mixed Social Networks Altered by Neighbourhood Deprivation for Ethnic Groups?” Journal of Ethnic and Migration Studies 45 (17): 3283–3300. doi:10.1080/1369183X.2018.1481002.
- Phillips, D. 1998. “Black Minority Ethnic Concentration, Segregation and Dispersal in Britain.” Urban Studies 35 (10): 1681–1702.
- Pickering, P. M. 2006. “Generating Social Capital for Bridging Ethnic Divisions in the Balkans: Case Studies of two Bosniak Cities.” Ethnic and Racial Studies 29 (1): 79–103. doi:10.1080/01419870500352397.
- Plane, D. A., and P. A. Rogerson. 1994. The Geographical Analysis of Population: With Applications to Planning and Business (International ed.). New York: John Wiley & Sons, Inc.
- Platt, L., and R. Warwick. 2020. “COVID-19 and ethnic inequalities in England and Wales.” Fiscal Studies 41 (2): 259–289.
- Portes, J. 2019. What do we Know and What Should we do About … ?: Immigration. London: SAGE Publications Ltd.
- Putnam, R. D. 2000. Bowling Alone: The Collapse and Revival of American Community. New York: Simon & Schuster Paperbacks.
- Ray, B. 2008. A description of the ethnic Segregation/Mixing within major Canadian metropolitan areas project. Citizenship and Immigration Canada, Government of Canada. https://www.canada.ca/en/immigration-refugees-citizenship/corporate/reports-statistics/research/description-ethnic-segregation-mixing-within-major-canadian-metropolitan-areas-project.html.
- Rural-Urban Classification Consortium. 2013. The 2011 rural-urban classification for small area geographies: A user guide and frequently asked questions. (Report No. Version 1.0). https://www.ons.gov.uk/methodology/geography/geographicalproducts/ruralurbanclassifications/2011ruralurbanclassification.
- Silm, S., and R. Ahas. 2014. “The Temporal Variation of Ethnic Segregation in a City: Evidence from a Mobile Phone use Dataset.” Social Science Research 47: 30–43. doi:https://doi.org/10.1016/j.ssresearch.2014.03.011.
- Silm, S., V. Mooses, A. Puura, A. Masso, A. Tominga, and E. Saluveer. 2021. “The Relationship Between Ethno-Linguistic Composition of Social Networks and Activity Space: A Study Using Mobile Phone Data.” Social Inclusion 9 (2): 192–207. doi:10.17645/si.v9i2.3839.
- Simpson, L., V. Gavalas, and N. Finney. 2008. “Population Dynamics in Ethnically Diverse Towns: The Long-Term Implications of Immigration.” Urban Studies 45 (1): 163–183. doi:10.1177/0042098007085106.
- Smith, R. A., and J. R. Elliott. 2002. “Does Ethnic Concentration Influence Employees’ Access to Authority? An Examination of Contemporary Urban Labor Markets.” Social Forces 81 (1): 255–279.
- Strömgren, M., T. Tammaru, A. M. Danzer, M. van Ham, S. Marcińczak, O. Stjernström, and U. Lindgren. 2014. “Factors Shaping Workplace Segregation Between Natives and Immigrants.” Demography 51 (2): 645–671.
- Sturgis, P., I. Brunton-Smith, J. Kuha, and J. Jackson. 2014. “Ethnic Diversity, Segregation and the Social Cohesion of Neighbourhoods in London.” Ethnic and Racial Studies 37 (8): 1286–1309. doi:10.1080/01419870.2013.831932.
- Suedekum, J., K. Wolf, and U. Blien. 2014. “Cultural Diversity and Local Labour Markets.” Regional Studies 48 (1): 173–191. doi:10.1080/00343404.2012.697142.
- Tammaru, T., D. Knapp, S. Silm, M. van Ham, and F. Witlox. 2021. “Spatial Underpinnings of Social Inequalities: A Vicious Circles of Segregation Approach.” Social Inclusion 9 (2): 65–76. doi:10.17645/si.v9i2.4345.
- Tammaru, T., M. Strömgren, M. van Ham, and A. M. Danzer. 2016. “Relations Between Residential and Workplace Segregation among Newly Arrived Immigrant men and Women.” Cities 59: 131–138. doi:https://doi.org/10.1016/j.cities.2016.02.004.
- UK Data Service Census Support. 2020. Flow data: Frequently asked questions. Retrieved from http://wicid.ukdataservice.ac.uk/cider/faq.php.
- Valentine, G., and J. Sadgrove. 2012. “Lived Difference: A Narrative Account of Spatiotemporal Processes of Social Differentiation.” Environment and Planning A: Economy and Space 44 (9): 2049–2063. doi:10.1068/a44491.
- Valentine, G., and J. Sadgrove. 2014. “Biographical Narratives of Encounter: The Significance of Mobility and Emplacement in Shaping Attitudes Towards Difference.” Urban Studies 51 (9): 1979–1994. doi:10.1177/0042098013504142.
- van Ham, M., and T. Tammaru. 2016. “New Perspectives on Ethnic Segregation Over Time and Space. A Domains Approach.” Urban Geography 37 (7): 953–962. doi:10.1080/02723638.2016.1142152.
- Virdee, S. 2010. “The Continuing Significance of ‘Race': Racism, Anti-Racist Politics and Labour Markets.” In Race and Ethnicity in the 21st Century, edited by A. Bloch, and J. Solomos, 62–92. Basingstoke, Hampshire, UK: Palgrave Macmillan.
- White, M. J. 1986. “Segregation and Diversity Measures in Population Distribution.” Population Index 52 (2): 198–221. doi:10.2307/3644339.
- Wong, D. W. S., and S. Shaw. 2011. “Measuring Segregation: An Activity Space Approach.” Journal of Geographical Systems 13: 127–145. doi:10.1007/s10109-010-0112-x.
- Wright, R., M. Ellis, and V. Parks. 2010. “Immigrant Niches and the Intrametropolitan Spatial Division of Labour.” Journal of Ethnic and Migration Studies 36 (7): 1033–1059. doi:10.1080/1369183X.2010.490064.
- Xu, W. 2021. “The Contingency of Neighbourhood Diversity: Variation of Social Context Using Mobile Phone Application Data.” Urban Studies, 1–19. doi:10.1177/00420980211019637.
- Yip, N. M., R. Forrest, and S. Xian. 2016. “Exploring Segregation and Mobilities: Application of an Activity Tracking app on Mobile Phone.” Cities 59: 156–163. doi:https://doi.org/10.1016/j.cities.2016.02.003.