
Abstract
Objective: The goal of this research was to quantify the association between pain severity and several health outcomes in a large sample of patients diagnosed with some form of pain.
Methods: Responses from patients who had been diagnosed with some form of pain (n = 14,459) were drawn from the 2013 EU National Health and Wellness Survey (NHWS; n = 62,000). Respondents reported their subjective pain severity in the past week on a numerical rating scale (0–10) as well as the Medical Outcomes Study Short Form (SF-36), Work Productivity and Activity Impairment Questionnaire (WPAI), and healthcare resource utilization in the past 6 months (healthcare professional (HCP) visits, emergency room (ER) visits, and hospitalizations). Associations between pain severity and health outcomes were examined via a series of regression models controlling for a set of demographic and health-related covariates.
Results: After controlling for demographics and comorbidities, pain severity in the past week was shown to be significantly negatively associated with Health Utilities (b = −0.022, p < 0.001) and positively associated with overall WPAI scores (b = 0.18, p < 0.001) and healthcare resource use (Hospitalizations: b = 0.13, p < 0.001; ER Visits: b = 0.14, p < 0.001; HCP Visits: b = 0.08, p < 0.001). The nature of these relationships (linear, curvilinear, etc.) is also explored.
Limitations: This study was a self-report cross-sectional study which may have biased the results and does not allow for causal inferences to be made. Finally, the regression models run were limited to available covariates and, hence, some potentially important covariates may not have been included in these models.
Conclusions: The findings suggest that reducing pain severity could result in an increase in patients’ quality-of-life and work productivity, and a decrease in healthcare resource use. The equations, linking pain and outcomes, were presented in an accessible format so they could be readily applied in healthcare decision-making.
Introduction
Ongoing pain leads to lowered physical and psychological functioning, impairment of daily activities, impaired work and work efficiency, substantial disability, and poor health-related quality-of-life (HRQoL)Citation1,Citation2. The Pain in Europe study—a large computer-assisted telephone survey (n = 46,394) that explored the prevalence, severity, treatment, and impact of chronic pain in 15 European countries and IsraelCitation3—found that one in five study respondents reported moderate-to-severe chronic pain. This study also highlights the impact of pain severity on healthcare resource use. Sixty per cent of European adults in the study, with moderate-to-severe pain, reported visiting their physician for their pain between two and nine times in the last 6 months, and 11% had visited at least 10 times. Moreover, ∼60% of respondents with moderate-to-severe pain reported they were less able or unable to work outside of the home, and one in five respondents with moderate-to-severe pain had lost their jobsCitation3. Furthermore, increasing pain severity also confers a greater burden on healthcare systems and the economy, including both direct and indirect costsCitation4. In European countries, pain has been estimated to cost economies between 1–10% of gross domestic product (GDP)Citation5. The GDP of the EU was estimated to be worth €14 trillion ($18.5 trillion USD) in 2014Citation6. Therefore, a conservative estimate of the economic burden of pain is at least €140 billion ($185 billion USD).
There has been previous research examining the burden of pain, and a full review of such studies is beyond the scope of this article. Furthermore, good resources on the impact of pain on workCitation7, costsCitation8, and the patient experienceCitation9 are already available in the literature. Nonetheless, it is important to continue to have up-to-date and precise estimates of these effects from multiple sources as a means of further understanding the complex nature of the relationship between pain severity and health outcomes. Large, population-based studies provide sufficient sample sizes for conducting sophisticated analyses, which can, in turn, produce results which could make a useful contribution to the decision-makers’ toolkit for evaluating healthcare interventions
One such large, population dataset that has been used to answer these questions about pain and pain severity in the past is the National Health and Wellness survey (NHWS), a nationally representative survey conducted across 10 different geographies. A previous study by Langley et al.Citation1 utilized data from the 2008 EU NHWS to estimate the relationship between the frequency and severity of pain and the outcomes of health-related quality-of-life and resource utilization. This study found that pain frequency and severity have a substantial impact on HRQoL and healthcare resource utilization. A more recent study by Vietri et al.Citation2 used data from the 2010 and 2011 NHWS in Japan to explore the association between pain severity, depression severity, and healthcare outcomes including the use of healthcare services. This study found that adults with depression combined with more severe physical pain showed greater disease burden from a variety of diagnosed pain conditions than those with depression combined with less severe pain.
It is clear that previously conducted studies using the NHWS have shown a substantial burden (both economic and humanistic) associated with pain. However, this previous work has a number of shortcomings that can be addressed by use of data from more recent fieldings of NHWS. The data used by Langley et al.Citation1 is now several years out-of-date (2008 EU NHWS) and severity was measured via three discrete levels (mild, moderate, and severe) without a specific timeframe. Such a coarse categorization may hide important differences throughout all levels of pain severity, and the lack of a time referent may affect the specificity of measurement required for accurate modeling. In the years since Langley et al.’s paper was published, the NHWS has been modified to include a finer-grained 0–10 pain rating scale for pain in the past week. For example, Vietri et al.Citation2 improved upon Langley et al.’s work by analyzing more recent data from the NHWS in Japan including this finer-grained severity rating scale (0–10), and with a specific timeframe. However, as this work was conducted in Japanese patients, it may not reflect the nature of the relationships between severity and outcomes in the European general populationCitation2. Finally, the regression equations applied in both cases were linearCitation1,Citation2, which might not be sufficiently accurate to capture the true nature of the relationship between pain severity and its impact on healthcare outcomes across the pain scale. Thus, it is time for an updated analysis of these questions in the EU NHWS so that the most recent and precise estimates of these associations are available in the literature.
To provide the most current and precise estimates of these effects to the literature, the current study used generalized linear models to predict cross-sectional associations between self-reported pain severity and health outcomes. This study assessed HRQoL, work productivity loss, and healthcare resource utilization as well as pain severity in the past week among a large sample of EU adults (n = 14,459) reporting a diagnosis of some form of pain. The nature of these relationships (linear, curvilinear, etc.) was also explored to provide a series of equations that yield a detailed and specific picture of the impact of pain severity on outcomes. The equations, linking pain and outcomes, were presented in an accessible format so they could be readily applied in healthcare decision-making. We are aware of no previous study that has quantified the relationship between pain and outcomes, from a European perspective, in a format that can readily applied to decision-making.
Methods
Sample
The data source of this report was the 2013 EU National Health and Wellness Survey (NHWS; n = 62,000). The EU NHWS is an annual, representative survey of adults administered to five European countries (UK, France, Spain, Germany, and Italy). Patients within each country are sampled by strata based on age and gender that are intended to be representative of each individual country’s overall population. This analysis focused specifically on those respondents who self-reported a diagnosis of pain (at any point in their life) and who reported experiencing pain in the past 12 months (n = 14,459, 23.32%); this included anyone who reported a diagnosis of the following pain types: arthritis, back problems, bladder pain, broken bones, cancer, carpal tunnel syndrome, dental problems, fibromyalgia, headache, joint pain, lower back pain, lumbar radiculopathy, menstrual cycle, migraine, neck, neuropathic, pelvic, phantom limb, plantar fasciitis, post herpetic neuralgia, ruptured/herniated disk, shoulder pains/shoulder stiffness, sprains or strains, surgery or medical procedure, or tendonitis. This study was approved by the Essex Institutional Review Board (Lebanon, NJ) and is in accordance with the Declaration of Helsinki (Seventh revision, 2013).
Measures
Patient characteristics
A number of patient characteristics were measured and analyzed for descriptive purposes and to be used as covariates in multivariable modeling. These included age (in years), sex, marital status, education (university degree vs less than university degree), income (in Euros), body mass index (BMI; calculated from self-reported height and weight), smoking and alcohol use (use, in general, coded as yes or no), exercise (% who exercised vigorously for 20+ min at least once in the past month for the purpose of improving or maintaining your health, with the purpose of losing weight, or for enjoyment), and the Charlson Comorbidity Index (CCI)Citation10. The CCI is a weighted index of comorbidities known to be predictive of mortality. Although the CCI was developed initially using medical charts, self-report versions of the index have been developedCitation11 and validated in the literature. This study used a self-reported version of the CCI based on self-reported medical diagnoses.
Pain severity
The primary independent variable was a measure of self-reported pain severity. Patients were asked “On a scale from 0–10, where 0 is ‘no pain’ and 10 is ‘pain as bad as you can imagine’, how much has your pain level been in the past week?”
Health-related quality-of-life
HRQoL was assessed via the Medical Outcomes Study 36-Item Short Form Survey Instrument version 2 (SF-36v2)Citation12. The SF-36v2 is a multi-purpose, generic health status instrument comprised of 36 questions. These questions are scored as two component summary scores: the physical component summary (PCS) and the mental component summary (MCS). This inventory can also be scored to yield a health utility score (Health Utilities) that has interval properties and theoretically ranges from 0–1, where scores closer to 1 equate to better health status.
Work productivity loss and activity impairment
Work productivity and activity impairment was assessed using the Work Productivity and Activity Impairment-General Health (WPAI-GH) questionnaireCitation13, a 6-item validated instrument which consists of four metrics: absenteeism (the percentage of work time missed because of one’s health in the past 7 days), presenteeism (the percentage of impairment experienced while at work in the past 7 days because of one’s health), overall work productivity loss (an overall impairment estimate that is a combination of absenteeism and presenteeism), and activity impairment (the percentage of impairment in daily activities because of one’s health in the past 7 days). Only respondents who reported being full-time or part-time employed provided data for absenteeism, presenteeism, and overall work impairment. All respondents provided data for activity impairment.
Healthcare resource utilization
Healthcare utilization was assessed by a few different items, specifically the reported number of traditional healthcare provider visits, the number of emergency room (ER) visits, and the number of times hospitalized in the past 6 months due to one’s own medical condition. The phrasing “own medical condition” is used in the NHWS to ensure that trips to accompany a friend or relative for their medical issues are not included in the calculation. The phrasing is intentionally vague so that all medical conditions are included (i.e. the NHWS does not collect condition-specific resource use).
Analytic plan
Descriptive statistics are provided for all measured variables. Continuous measures are presented via means and standard deviations, discrete measures are presented via counts and percentages. Before multivariate modeling, Pearson product-moment correlations were calculated between pain severity and potential covariates. Generalized linear models were used to analyze the association between health outcomes and pain severity, controlling for covariates. All variables except HRQoL used negative binomial link functions to account for the non-normality of the data. Regression slopes were tested for linear, quadratic, and cubic effects. Models proceeded in a step-wise fashion. In the first model, all covariates were included, as were all terms (linear, quadratic, cubic). If the cubic term was not significant, it was removed and the model was re-run. This proceeded until the highest term was significant. Estimates were retained from the model with the highest-order significant interaction term. Projected estimates for each outcome based on the regression model results are presented and graphed.
Results
contains the descriptive statistics for the total sample (n = 62,000), as well as separately for those who reported a diagnosis of pain (n = 14,459), and for those without a diagnosis of pain (n = 47,541). All differences between the Pain Diagnosis and No Pain Diagnosis were statistically significant for all variables examined. The largest observed differences between the groups were comorbidity burden (% ≥1 comorbidity: pain =32.5%, no pain =15.5%), BMI (% obese: pain =25.2%, no pain =15.2%), age (% over 35: pain =79.4%, no pain =70.6%), and smoking status (% current or former smokers: pain =63.8%, no pain =53.9%).
Table 1. Demographic characteristics.
Before inclusion in multivariable models, the associations between all variables listed in and pain severity were examined using Pearson product-moment correlations (continuous variables) and point-biserial correlations (dichotomous variables). Variance inflation factor (VIF) estimates were also calculated. The purpose of these analyses was to determine the degree of association between these variables and pain severity and to assess the potential of multicolinearity. The results of these analyses are included in . As can be seen in the table, all correlations were statistically significant at p < 0.001. The strongest correlates of pain severity were CCI score, exercise status, alcohol status, BMI, and age. VIF estimates were quite low (all <1.5), alleviating any concerns of multi-colinearity.
Table 2. Correlations between demographics and severity.
Next, we conducted a series of regression models in order to understand the association between pain severity and health outcomes. Pain severity was centered about its mean and included as a predictor in each model along with all the aforementioned covariates. However, after controlling for these covariates in the models, many were non-significant. Accordingly, age, percentage male, education, and CCI were retained in the final models. For normally distributed outcomes (all HRQoL measures) we used ordinary least squares regression and for skewed variables (all remaining outcomes) we used generalized linear models with a negative binomial distribution and log-link function. For each model, we tested for non-linearity using cubic and quadratic terms and retained the estimates from the model containing the highest order statistically significant term. The predicted values at each level of pain severity are presented graphically in .
Figure 1. Predicted health-related quality-of-life. Note: p-values reported are for highest order significant interaction term. These are cubic (health utilities), quadratic (mental component summary), and quadratic (physical component summary), respectively. All models included the following variables as covariates: age, gender, education, and CCI score (comorbidity burden).
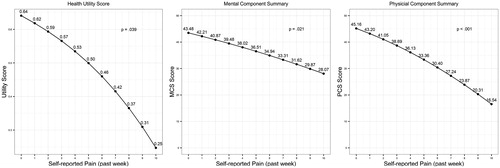
Figure 2. Predicted work productivity impairment by pain severity (past 6 months). Note: p-values reported are for highest significant interaction term. These are linear (absenteeism) and quadratic (presenteeism), respectively. All models included the following variables as covariates: age, gender, education, and CCI score (comorbidity burden).
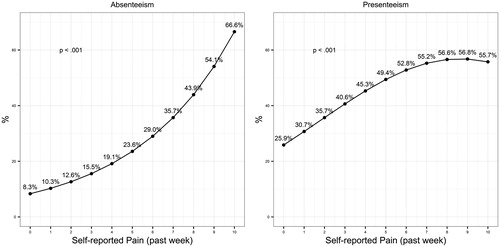
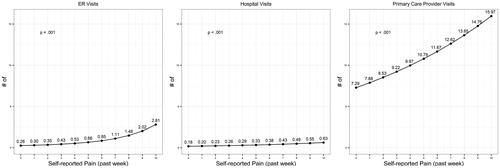
Figure 3. Predicted healthcare resource use by pain severity (past 6 months). Note: p-values reported are for the highest significant interaction term. These are quadratic (ER visits), linear (hospital visits), and linear (primary care provider visits), respectively. All models included the following variables as covariates: age, gender, education, and CCI score (comorbidity burden).
contains the estimated relationships between pain severity and health outcomes measures. In all three cases, the association was negative. The association was cubic in nature for health utilities (p = 0.039) and quadratic for both mental component (p = 0.021) and physical component (p < 0.001) summary scores. The general result suggests that at high and low levels of pain severity the decrements in quality-of-life are larger between two points on the scale relative to moderate levels of severity.
contains the estimated relationships between pain severity and work impairment. Despite appearances, the quadratic term for absenteeism was not significant (p = 0.177), suggesting a linear relationship (p < 0.001); however, the association between pain severity and presenteeism was quadratic (p < 0.001). The result for presenteeism suggests that, as pain severity increases presenteeism also increases, but when pain severity reaches high levels the net effect on presenteeism plateaus.
contains the estimated levels of healthcare resource use (over the past 6 months) for each level of pain severity. The nature of this relationship was linear and positive for both hospital visits (p < 0.001) and primary care provider visits (p < 0.001). However, this association was quadratic and positive for ER visits (p = 0.001), suggesting that at low levels of pain severity there are relatively small differences in the number of ER visits between any two given points on the pain scale, whereas at higher levels of pain severity the number of ER visits increases dramatically as pain severity increases.
Finally, this study produced a series of equations based on the survey data that demonstrate how to calculate estimated outcome scores given a reported level of pain severity in the past week. The general forms of the equations and the means are provided in , as well as the coefficients in . Furthermore, for convenience, these scores have been calculated for all study outcomes by level of pain severity in the past week and are presented in . Examples of how to use these equations to make estimates of patients’ outcomes with knowledge of their level of pain severity can be found in the supplementary materials.
Table 3. General form of equations.
Table 4. Unstandardized regression coefficients (b values) from multiple regression models by outcome.
Table 5. Adjusted/estimated means for all study outcomes by level of pain severity in the past week.
The equations not only demonstrate the impact of pain on certain health outcomes with increased severity, but also allow the quantification of the achievable improvement in outcomes through improved pain management. For example, if the patient had a pain score of 4, his or her absenteeism value would be:
This means that the estimated absenteeism value for an average person (average age, gender, education, and comorbidity burden) diagnosed with pain and who reported a severity score of 4 is estimated to be 19.32%. Further worked examples are provided in the supplementary materials.
Discussion
This study surveyed a large sample of European adults with diagnosed pain conditions to provide a comprehensive and quantitative review on the impact of pain severity on health-related quality-of-life, work productivity loss, and healthcare resource utilization. In line with previous research, increasing levels of pain severity consistently predicted poorer physical and psychological patient outcomes, and also consistently predicted greater burden on the workforce and healthcare systemsCitation1–3,Citation5. The average patient in our study was female, middle-aged, and married, without a university degree, which is typical of patients across many other pain studies.
Pain severity substantially interfered with work productivity. The predicted magnitude of work absenteeism, in particular, increased in the context of higher pain severity. For example, predicted absenteeism was eight times higher in patients reporting a severity score of 10 (anchor: “the worst pain imaginable”) during the past week relative to patients reporting a score of 0 (anchor: “no pain”) during the past week. Also the predicted increase in presenteeism was over 2-fold for patients reporting a severity score of 10 (anchor: “the worst pain imaginable”) during the past week relative to patients reporting a score of 0 (anchor: “no pain”). Predicted effects on the healthcare system were also striking. For example, patients reporting having experienced a pain score of 10 (anchor: “the worst pain imaginable”) during the past week had a predicted 11-times more emergency room visits in the past 6 months compared with patients reporting a pain score of 0 (anchor: “no pain”) during the past week. Moreover, patients reporting a pain score of 10 (anchor: “the worst pain imaginable”) also had a predicted 3-times more hospital visits and 2-times more primary care provider visits compared to those reporting 0 (anchor: “no pain”)
The results of this study are consistent with previous work using the NHWS. Langley et al.Citation1 found more-or-less a consistent pattern of higher burden (lower quality-of-life and higher resource use) in those patients reporting severe pain relative to those reporting moderate or mild pain. This study found the same pattern across all measured variables (Langley et al. did not report on work productivity loss and activity impairment). One improvement in this study, relative to Langley et al., was that it further explored these relationships and found many (e.g. health utilities, presenteeism) to be non-linear. Similarly, Vietri et al.Citation2 observed these patterns in patients with depression and pain diagnoses when examining pain severity in Japanese respondents to the NHWS in 2010 and 2011. Unlike this study, Vietri et al. did not find a significant effect for Absenteeism; however, as this study was conducted in Japan it is unclear whether this lack of significance was due to sample size or to cultural differences between Japan and the EU.
Several limitations are inherent to studies with cross-sectional, self-reported data, which we acknowledge here. First, study data were self-reported and retrospective and, thus, could not be clinically verified. Lost work productivity and medical visits were also self-reported, and recall bias may have resulted in over- or under-estimation. Second, the data are cross-sectional and, as such, no claims about cause and effect are possible. Third, although our generalized linear models controlled for significant available covariates, additional unmeasured covariates could have affected the results. For example, some patients were receiving pain treatments, and it is possible that treatment side-effects, although unmeasured, influenced findings. Fourth, this study only examined pain in general and it may be more helpful for decision-makers if a distinction were made between chronic and acute pain when examining these outcomes. Finally, given that the work impairment measures were only given to employed participants, the smaller sample size may have resulted in a large reduction of power that could have hampered the detection of effects in those measures.
In summary, this study offers updated, detailed quantitative information by which policy-makers can evaluate pain management in Europe. This could be beneficial for healthcare decision-makers when considering resource allocation decisions as it provides clear quantification of the impact of a patients’ pain level not only on their quality-of-life, but also on work productivity loss and the level of healthcare resource use. This allows decision-makers to not only calculate the potential improvements in a patient’s quality-of-life through improved pain management (i.e. a reduction in pain score), but also importantly calculate the economic impact of this improvement.
Transparency
Declaration of funding
This study was funded by Mundipharma International Ltd.
Declaration of financial/other relationships
WD and JK are employees of Mundipharma International Limited. EAW and GI are employees of Kantar Health. Mundipharma provided funding to Kantar Health for data access, analysis, and preparation of the manuscript. JME peer reviewers on this manuscript have no relevant financial or other relationships to disclose.
Supplementary_Materials.docx
Download MS Word (19 KB)Acknowledgments
The authors would like to thank Tammy Schuler for administrative assistance in the preparation of this manuscript.
Related Research Data
References
- Langley P, Müller-Schwefe G, Nicolaou A, et al. The societal impact of pain in the European Union: health-related quality of life and healthcare resource utilization. J Med Econ 2010;13:571-81
- Vietri J, Otsubo T, Montgomery W, et al. association between pain severity, depression severity, and use of health care services in Japan: results of a nationwide survey. Neuropsychiatr Dis Treat 2015;11:675
- Breivik H, Collett B, Ventafridda V, et al. Survey of chronic pain in Europe: prevalence, impact on daily life, and treatment. Eur J Pain 2006;10:287
- Schaefer C, Mann R, Sadosky A, et al. Health status, function, productivity, and costs among individuals with idiopathic painful peripheral neuropathy with small fiber involvement in the United States: results from a retrospective chart review and cross-sectional survey. J Med Econ 2014;17:394-407
- Breivik H, Eisenberg E, O’Brien T. The individual and societal burden of chronic pain in Europe: the case for strategic prioritisation and action to improve knowledge and availability of appropriate care. BMC Public Health 2013;13:1229
- International Monetary Fund (IMF). World economic outlook database. Washington DC: IMF, 2014. http://www.imf.org/external/pubs/ft/weo/2014/01/weodata/index.aspx. Accessed May 15, 2015
- Patel AS, Farquharson R, Carroll D, et al. The Impact and burden of chronic pain in the workplace: a qualitative systematic review. Pain Pract 2012;12:578-89
- Moore RA, Andrew R, Derry S, et al. The costs and consequences of adequately managed chronic non-cancer pain and chronic neuropathic pain. Pain Pract 2014;14:79-94
- Moore RA, Straube S, Aldington D. Pain measures and cut-offs – no worse than mild pain as a simple, universal outcome. Anaesthesia 2013;68:400-12
- Charlson ME, Pompei P, Ales KL, et al. A new method of classifying prognostic comorbidity in longitudinal studies: development and validation. J Chronic Dis 1987;40:373-83
- Chaudhry S, Jin L, Meltzer D. Use of a self-report-generated Charlson Comorbidity Index for predicting mortality. Medical Care 2005;43:607-15
- Ware JE. User's manual for the SF-36v2 health survey. Lincoln, RI: Quality Metric, 2007
- Reilly MC, Zbrozek AS, Dukes EM. The validity and reproducibility of a work productivity and activity impairment instrument. Pharmacoeconomics 1993;4:353-65