
Abstract
Objective: Apart from improved health outcomes, treatment convenience per se may have a value to individuals. This is sometimes referred to as process utility and can be estimated in terms of willingness-to-pay (WTP) or quality-adjusted life-years (QALYs). Previous research has produced multiple studies on QALY gains and WTP estimates of insulin-related attributes. There are, however, significant variations between studies, and it is not clear to what extent the value is a reflection of the true preferences or a consequence of the methodological approach. The aim of this study is to estimate the preferences for treatment attributes associated with basal insulin (administration frequency, administration flexibility, and treatment-induced weight gain) using both QALYs—elicited using time trade-off (TTO) and WTP—among a sample of the Swedish general population and among a sample of the Swedish diabetes population.
Methods: Data was collected using web-based surveys which were distributed to members of internet panels. The WTP survey presented five hypothetical scenarios with an offer to pay the incremental cost to receive basal insulin with improved attributes. The TTO survey presented six hypothetical scenarios where the respondent could choose between living for the rest of his/her life with diabetes and receiving treatment with a basal insulin with certain attributes or live for a shorter time with full health. The scenarios were combined with either a basal or a basal–bolus treatment regimen. Results from the TTO analysis were translated into monetary estimates using a threshold value of SEK500,000 per QALY.
Results: In total, 2012 responses were included. The ratings of the attributes were almost identical, irrespective of method for the general population, while it differed to some extent for the diabetes population. The methods produced the same value for flexibility, but the estimates generated with the TTO approach were higher for one less injection and avoided weight gain. The general population assigned a higher utility gain to convenience attributes, while the diabetes population assigned a higher utility gain to avoiding weight gain.
Limitations: About a quarter of the respondents did not accept the scenario in the WTP survey, i.e. protesters.
Conclusions: The ranking of the attributes was generally independent of evaluation method, but the TTO method resulted in similar or higher values compared to the WTP method.
Introduction
Insulin remains a cornerstone in the treatment of diabetesCitation1. Basal insulin keeps blood glucose levels at consistent levels during periods of fasting—and is usually administrated in the morning and/or in the evening—while bolus insulin keeps blood glucose levels under control following a meal—and is usually administrated before each meal (3–5 times per day)Citation2. Most persons with type 1 or type 2 diabetes treated at hospitals use both basal and bolus insulin, and 28% of all persons with type 2 diabetes in Sweden use at least basal insulinCitation3. Some basal insulins have equivalent effectiveness profiles regarding glucose control (HbA1c regulation), but differ in terms of the frequency of hypoglycaemic events and attributes such as administration frequency (once or twice daily), administration flexibility (whether the insulin has to be administered at fixed times or allows administration during a time frame), and treatment-related weight gainCitation4–6. Treatment convenience influences recipients’ treatment burden, which in turn impacts treatment adherence and is, thus, a determinant of real life clinical outcomes. Previous research has indicated that complicated and inflexible treatment regimens may cause non-adherenceCitation7–9, resulting in a sub-optimal treatment effectCitation10 such as elevated risks of diabetic complicationsCitation11. In other words, treatment convenience could affect recipients’ quality-of-life (QoL)Citation12,Citation13, i.e. utility, which is of interest in cost-effectiveness analyses (CEA) of medicinal products.
Apart from improved health outcomes, treatment convenience per se may have a value to individuals. This is sometimes called process utility and can be estimated in terms of quality-adjusted life-years (QALYs) to be applicable in a CEA framework or in terms of willingness-to-pay (WTP) for use in a cost-benefit analysis (CBA). Process utility is not always considered in health economic analyses, but it is becoming increasingly recognized that these outcomes do have a value which should be incorporated if the objective is to maximize well-beingCitation14.
Previous research has produced multiple studies on QALY gainsCitation12,Citation15–19 and WTP estimatesCitation20–23 of insulin-related attributes. Evans et al.Citation12 applied the time trade off (TTO) approach to elicit the QALY gain associated with flexibility and a reduction of injection frequency. Boye et al.Citation13 estimated the QALY gain associated with the same attributes using the standard gamble (SG) approach. Jendle et al.Citation22 applied the discrete choice (DC) approach to estimate the WTP for avoiding weight gain, reducing number of injections, increasing flexibility, and reducing the risk of hypoglycemic events. In accordance with reviews of studies on process utilityCitation14,Citation24, these studies show that there exists a value for these attributes. There are, however, significant variations between studies which mainly seem to depend on the methods used. It is, therefore, not clear to what extent the value is a reflection of the true preferences or a consequence of the methodological approach. SG and TTO are designed to capture utility of a certain health state and there remains some uncertainty regarding how to use these methods and how to interpret the results when applied to process utilityCitation24. The application of the WTP approach in healthcare has raised some concerns since interventions with relatively small benefits are valued disproportionately high—due to scope and scale effects—and since the interventions being evaluated are valued higher on its own than when evaluated together with a range of other interventions—due to “budget constraint bias”Citation25.
Another source for variation in process utility estimates is the studied population. Some studies rely on the preferences of the patient population, while others survey a sample from the general population. The evidence suggests that there is a variation in the estimates depending on the population usedCitation24. There are several reasons as to why these populations differ in their valuation. Patients are most familiar with the treatment and its consequences, but may act strategically and over-estimate the value to receive it. They could also have adapted to their treatment and no longer find it as burdensome as they would have at treatment initiation, which would reduce the value of process utility. The general population on the other hand have no vested interest in the treatment and might, therefore, not be induced to over-estimate the value. Since medical care is publicly funded, it could also be argued that it is more appropriate to elicit the preferences of the real payers. However, the general population might find it difficult to understand the implications of the disease and treatmentCitation26. Evans et al.Citation12 elicited the utility gain of insulin attributes among persons with diabetes and the general population using TTO and found some differences indicating that the general population place a higher value on convenience attributes compared to persons with diabetes. To our knowledge, there is no study which has done the same using WTP.
The available evidence provides estimates of the QALY gain and WTP for process utility in insulin treatment. However, there is, to our knowledge, no direct comparison of methods within a single study. Since different studies use different units of measurement and different framing it is difficult to tell if the methods produce similar ratings and estimates of preferences or not. The objective of this study is to apply both methods in order to estimate preferences for attributes associated with basal insulin which will enable a direct comparison of methods. The purpose is also to study preferences in the patient population and the general population to see if and how these differ, depending on the methods used.
Study sample and methods
Study design
This study estimates the value, both in terms of utility and WTP, of;
One less insulin injection per day;
Going from time-fixed injections to time-flexible injections that allow an administration window of ±3 h;
One less insulin injection per day + added time-flexibility of ±3 h;
Avoiding a 1 kg insulin-induced weight gain; and
Avoiding a 3 kg insulin-induced weight gain.
These types of attributes were selected since they could be associated with the profile of insulin glargine 300 IU/mL (Toujeo)Citation5,Citation27–29,Citation34. Different levels of avoided weight gain were used to reveal how preferences change with the level. The utility and WTP of a reduced number of hypoglycemic events were not elicited since it would make the survey too long and complicated. In addition, the value of hypoglycemic events is thoroughly discussed elsewhereCitation16,Citation18–23.
The TTO method is used to elicit the utility, or QoL, for each individual health state, which means that the respondent is asked to choose between a less than perfect health state for the remaining life time (t) and a perfect health state for a shorter period of time (t − x). The utility of the less than perfect health state (e.g. diabetes) is elicited by dividing the time with perfect health by the time with less than perfect health when the respondent is indifferent between the two. The “less than perfect” health states differ in a single basal insulin attribute. The attribute-related QoL gains are calculated by comparing the QoL of health states with and without the specific attribute.
The contingent valuation method (CVM) is used to elicit the WTP for each basal insulin attribute, which means that the respondent is asked to state the maximum amount she would pay to receive a certain benefit on a hypothetical market. The respondent was asked to assume that she had diabetes and was in need of intensified treatment with a new basal insulin. Two different insulins were presented to the respondent. One was (assumed to be) inferior (e.g. two injections per day) and the other was (assumed to be) superior (e.g. one injection per day). The inferior insulin was provided free of charge. To receive the superior insulin the respondent had to pay the incremental cost out of pocket.
Both the TTOCitation26 and WTPCitation30 approaches are scientifically accepted methodologies commonly used in scientific publicationsCitation12,Citation16–23. The TTO health states and WTP scenarios are presented in .
Table 1. Hypothetical health states included in the questionnaire.
The study was conducted through web-based surveys distributed both to the general population and to persons with diabetes identified in a web panel. In this paper the “general population” excludes persons with diabetes in order to clearly distinguish the attribute valuations of persons with and without personal experience of diabetes.
Questionnaire
Both the WTP and the TTO questionnaires were constructed in two versions where the preference-related questions assumed either a basal insulin treatment regimen or a basal-bolus insulin treatment regimen. The different versions were motivated by the expected difference in preference of one less injection depending on starting with two (basal) or five (basal-bolus) injections, a hypothesis based on findings by Evans et al.Citation12. Hence, there were four versions of the questionnaire; TTO basal, TTO basal-bolus, WTP basal, and WTP basal-bolus. Each individual respondent answered only one of the questionnaires to lower the risk of fatigue and improve response rates.
Each of the four questionnaire versions consisted of three sections; background information, hypothetical scenarios examining respondents’ utility (TTO) or respondents’ WTP, and a section to close up the survey.
The background information included respondent demographics and background (age, gender, educational attainment, household income, etc.) and whether the respondent had diabetes. Respondents with diabetes were asked about their diabetes-related health and experiences of diabetes treatment. Respondents without diabetes were asked whether a family member had diabetes. The age question worked as a screening question to exclude invalid respondents, i.e. respondents under the age of 18.
Following the background information, respondents were presented with detailed descriptions of baseline diabetes, based on patient questionnaires used in the study by Evans et al.Citation12. The definition was validated by a nurse with experience of treating persons with diabetes. The definition used in this study is presented in . Thereafter, respondents were asked to grade the baseline diabetes as well as their own current health state on a scale from 0 (representing death) to 100 (representing best possible health). TTO respondents also graded full health since it was included as part of the trade-off. The grading was not part of the main results, but rather served as a warm-up question to make respondents consider the implications of the health states.
Table 2. Description of health states as stated in questionnaire (partly based on a previous study by Evans et al.Citation12).
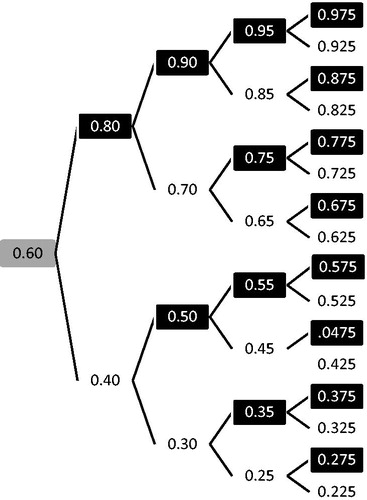
The TTO methodology applied in this study is similar to the approach applied by Evans et al.Citation12. In sum, the TTO method implies asking respondents to choose between a less than perfect health state for the remaining lifetime and a state of perfect health with a shorter lifetime. For example, the respondent could be asked to choose between the following scenarios; (i) you have diabetes and give yourself two insulin injections at a fixed time every day, and you will live for 30 years; or (ii) you will live in full health (i.e. no diabetes) for 24 years and do not need to take any injections. The length of the lifetime with full health was then altered and the same question was repeated until the respondent reached a point of indifference, i.e. where the respondent finds both alternatives equally acceptableCitation31. A maximum of four sequential questions per health state was applied and the procedure followed a standard bisectional methodology with a starting point at 0.6 (see ). For respondents who chose the diabetes-option, the presented lifetime in the full-health-option was adjusted upwards, while it was adjusted downwards for respondents who chose the full-health-option, in each iteration. If respondents chose the indifference alternative at any time, he/she proceeded directly to the following scenario. In the TTO questionnaires, each hypothetical health state is presented separately and sequentially (). Both respondents who chose to never trade any lifetime (“non-traders”) and respondents who were willing to trade the maximum amount of lifetime (“maximum-traders”) for full health were given follow-up questions. The purpose of these questions was to identify respondents who gave this answer without any legitimate reason.
Figure 1. Algorithm of the remaining lifetime (% of respondents expected remaining lifetime according to gender and current age) in the full-health-option of the iterations of the TTO scenarios. Grey box = starting point, black box = prefer diabetes-option, white box = prefer full-health-option, end-nodes = interpreted point of indifference depending on the respondents answer in the fourth, and final, iteration. If, at any point, the respondent was indifferent between the full-health and the diabetes option, he/she was assigned the utility proportion in that box, e.g. 0.6 for respondents indifferent in the first iteration.
In order for the scenarios to appear more relevant to the respondent, the applied time horizon in the diabetes health state was adjusted after the respondents stated age and gender and represented the individuals’ expected remaining lifetime according to Statistics SwedenCitation32.
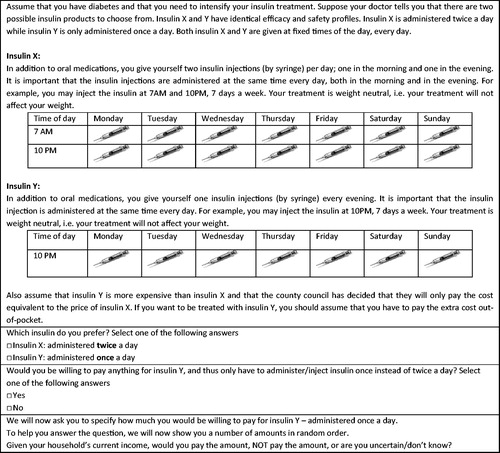
The WTP scenarios were designed to directly elicit the incremental value of reducing injection frequency, increasing time-flexibility, and avoiding treatment-related weight gain. The respondent was asked to assume that he/she had diabetes and that his/her insulin treatment was to be intensified. He/she could choose from two types of basal insulin labeled X and Y. Insulin Y had a “more preferred” attribute (e.g. one injection per day) compared to insulin X (e.g. two injections per day). Insulin X was, however, free of charge, while the respondent had to pay the incremental cost out of pocket to receive insulin Y. The respondent was first asked which of the insulin he/she would prefer. If the respondent chose insulin Y, he/she was then asked if he/she would be prepared to pay something to receive it.
To ensure valid WTP answers, methods shown to reduce biases common in CVM (e.g. hypothetical bias, starting point bias) were applied. Respondents were reminded to consider their real life budget constraint in order to ensure reasonable responses. Other validation methods included the “card-sorting procedure” and control question for non-payersCitation33. The card-sorting procedure consists of presenting different amounts (payments for 1 year, SEK10; 60; 200; 500; 900; 3000; 8000), one at a time, in a mixed order and then asking the respondent to answer whether he/she would be willing to pay the amount, would not be willing to pay the amount, or if he/she was unsure. Thereafter, the respondent was given an open-ended question of the maximum amount he/she would pay while presented with the highest and lowest amount that he/she had indicated in the card sorting procedure. Before presenting the first WTP-scenario, an introduction to WTP was presented to the respondent where it was emphasized that the hypothetical scenarios are not meant to reflect any changes in the real-world treatment and that respondents would not have to pay for their medication in the future.
To validate the functionality of the questionnaires, and to test whether the SGCitation13 or TTO method was best suited to estimate utility according to our research question, a pilot survey using the basal-only version of the TTO-, WTP-, and SG (based on the design in the study by Boye et al.Citation13) questionnaire was conducted. In total, 150 SG, 180 TTO, and 230 WTP surveys were distributed to panellists of a web panel with persons from the general population. The pilot study implied better comprehension of the TTO compared to the SG questionnaire as the response rate was higher and the respondents needed less time to complete the TTO survey. There were also more confusion and difficulties reported for the SG survey. The TTO approach was, thus, chosen for the final survey. In addition, the baseline diabetes health state (equal to all other health states except for no injections and no weight gain) was placed last instead of first in the final TTO questionnaires since it was shown that respondents did not rate it highest in the pilot when it was presented first. The WTP pilot indicated good comprehension and validity and only minor adjustments were made for the final questionnaires.
The final TTO and WTP questionnaires are exemplified in and , respectively.
Figure 2. Hypothetic TTO scenario 1: Diabetes and two fixed insulin injections per day. The presented scenario assumes a 35-year old woman from Sweden, implying an expected reaming life time of 49.58 years. The table presents the first iteration where the time trade-off is set to 0.6, i.e. a 60% reduction of in life time, which corresponds to a remaining life time of 29.75 years. Depending on the respondents answer, the time trade-off is adjusted according to the iterations in Figure 1. The diabetes health state was based on a previous study by Evans et al.Citation12.
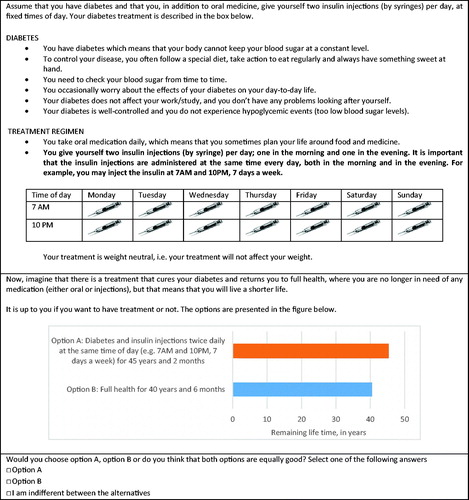
Figure 3. WTP scenario 1: WTP-question to avoid one insulin injection per day. Different amounts (payments for 1 year, SEK10, 60, 200, 500, 900, 3000, 8000) were presented one at a time in a mixed order. After responding to each amount, the respondent was presented with the highest amount that he/she would pay and the lowest amount he/she would not pay and was then asked to state the highest amount that he/she would pay in an open question.
Sample
A sample from the adult (18 years or older) Swedish general population and Swedish persons with diabetes were selected from the online panel Norstat and the panels in the Cint Panel Exchange (CPX). The selection was based on background information of whether the respondent had previously indicated a diabetes diagnosis. Norstat (total adult panel population, n = 400,000; total Swedish panel population, n = 99,000) is one of the leading providers of data collection in Europe. The CPX (total adult panel population, n = 170,000) is an online panel market place where panel owners can join and allow access to their panels to online sample buyers. Panels are recruited by different type of sources, including telephone, face-to-face, online and email. The respondents selected for this survey consisted of a stratified sample (selected on age, sex, and geography to resemble the general population) of existing panels.
The panel respondents were offered incentives for their time corresponding to points that can be transformed into cash, used for online purchases, or make payments to charity or other associations. The incentives have been set to encourage long-term participation and to discourage professional respondents who seek to respond to surveys only to obtain payment.
The sample size was set to enrol at least 250 respondents for each questionnaire and population, i.e. ∼2000 respondents in total (four questionnaires and two sub-groups).
Data collection
Approval for the study was retrieved from the Ethical Review Board (EPN) in Lund, Sweden.
Data was collected through web-based surveys. All respondents were invited to participate by email. To enter a survey the respondent had to give his/her informed consent to participate. The answers were collected automatically and could not be traced back to the individual respondent. No personally identifiable information was collected, i.e. all data was anonymous. Reminders were sent to those who did not answer the questionnaire in order to improve response rates. The survey was open from April 29–May 13, 2015 (15 days).
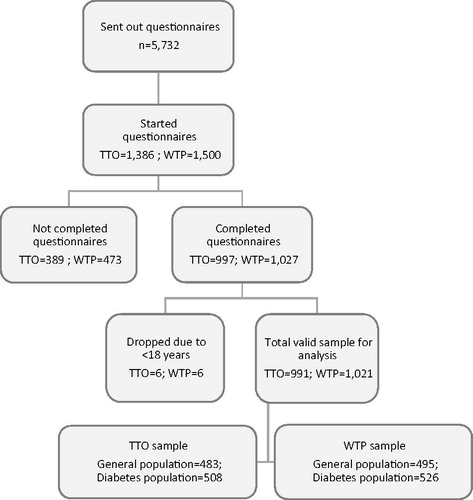
Only complete responses (i.e. where the respondent answered all questions and pressed the send button) were included in the analyses. A respondent flow chart is presented in .
Figure 4. Patient cohort flow chart.
Data analysis
Demographic characteristics were presented for persons with type 1 diabetes, persons with type 2 diabetes, and for persons without diabetes (general population) separately in order to make them comparable to their respective population.
TTO analysis
Respondents’ point of indifference of time in full health vs time in the sub-optimal health state was interpreted after a maximum of four TTO iterations. If, at any time, the respondent was indifferent between the presented health states, that iteration’s trade-off was interpreted as the point of indifference. For respondents who still stated a preference for one of the presented health states in the fourth iteration, the point of indifference was interpreted as the midpoint of the indifference interval derived—i.e. between the shortest lifetime in perfect health rejected and the longest lifetime in perfect health accepted (). The utility of the less than perfect health state (e.g. diabetes) was then elicited by dividing the time in perfect health by the time in sub-optimal health at the point of indifference (Equationequation 1(1) ).
(1)
where uh = utility of the imperfect health state; t = lifetime with imperfect health; and x = lifetime traded to gain perfect health.
“Non-traders” and “maximum-traders” who answered “I’m just clicking something at random since the situation is unreal” were classified as “protesters” and excluded from further analysis since they did not have a legitimate reason for their answer. However, non-traders who expressed a longing to live as long as possible regardless of health state and those who viewed the diabetes-option manageable enough to live with during their full life expectancy were included. Correspondingly, maximum-traders who said to value full health exceptionally high or who considered the diabetes-option absolutely intolerable were also included in the analysis.
A QoL was, thereby, assigned to each TTO health state using Equationequation (1)(1) . Attribute-related QoL gains were then calculated on an individual level by comparing the QoL of different health states for each respondent (i.e. the analyses only include individuals with valid responses in both TTO scenarios) and then calculating the mean difference (Equationequation 2
(2) ).
(2)
where Δ ui = mean utility gain of attribute i; uhi = the mean utility of health state h with attribute i; and uh = the mean utility of health state h (without the attribute i).
For example, subtracting the utility of TTO scenario 2 (baseline diabetes +1 fixed injection) from the utility of TTO scenario 1 (baseline diabetes +2 fixed injection) corresponds to the QoL gain of one less insulin injection per day. One QALY corresponds to 1 year with the QoL-weight 1. This means that the utility gain (Δ ui) represent the QALY gain of attribute i for 1 year.
Finally, a monetary value of the attributes were elicited by multiplying the attribute-related QALY gain with the monetary value of one additional QALY in the context of diabetes, set to SEK500,000Footnote†. For example, if an attribute was found to result in a QALY gain of 0.01, the monetary value of the same was estimated to SEK5000 (0.01*500,000) per year. This estimate was then divided by 12 to make it comparable to the WTP estimates which were elicited per month.
WTP analysis
The WTP scenarios were designed to directly elicit the incremental value of the examined attributes, and the answer to the open-ended WTP question was interpreted as the respondent’s WTP. However, a common problem when eliciting WTP is how to handle respondents who refuse to answer, give incomplete answers, state a zero WTP, or an implausibly high WTPCitation33.
The web-survey was constructed so that respondents were forced to give full answers to proceed through the questionnaire, and there was, thus, no need for methods to deal with incomplete responses. Zero responses were considered protest bids if their answer to the control question for unwillingness to pay was that the government should pay (so called “protesters”). The true valuation of these respondents was assumed not to be zero, but unknown, and they were, therefore, excluded from the analysis. Exclusion of protesters is a common and accepted procedure in WTP studiesCitation30. However, respondents who were unwilling to pay because of preferring insulin X (provided free of charge), or who could not afford additional treatment costs, or who simply did not think that the additional attribute had any value were included in the analysed sample. Implausible high WTP was defined as a WTP above the income of the respondent.
The WTP results were validated by testing whether they were related to income (transformed to a continuous variable by using the middle for each income group). The relationship was investigated by ordinary lest square (OLS) regression models with the logarithm of WTP as the dependent variable and age, gender, whether the respondent had diabetes, university education, and the respondents’ income per consumption unit (ICU) as explanatory variables. The respondents’ ICUs were retrieved by dividing each respondent’s household income by consumption units according to the number of individuals in each household indicated by the respondent. Consumption units were calculated in accordance with standard units from Statistics SwedenCitation37.
The implied value of a QALY (VQALY) was calculated by dividing the mean WTP for attribute i by the mean QALY gain per month for attribute i (Equationequation 3(3) ).
(3)
Both willingness to pay and the monetary transformation of TTO utility is reported in SEK (€1 = SEK9.27, $1 = SEK8.51, exchange rate January 28, 2016Citation38).
All statistical analyses were performed using STATA 13.1 (StataCorp. 2013. Stata Statistical Software: Release 13, College Station, TX). Differences were tested for statistical significance using t-tests, Wilcoxon signed-rank test, and Mann-Whitney-Wilcoxon tests when applicable. A p-value <0.05 was considered statistically significant.
Results
Respondent demographics
The patient flow chart is summarized in , including details of those who were excluded from further analysis. A total of 5732 surveys were sent out, 2886 questionnaires were started and 2024 were completed, corresponding to a 35% response rate. The majority of drop-outs of started questionnaires occurred when respondents were asked to grade diabetes and their own health state. Out of the complete responses, 12 were excluded because they were under 18 years old.
Demographic characteristics of the included respondents are summarized in . Compared to the entire Swedish adult population, the respondents had a slightly higher mean incomeCitation39 and a higher share with university educationCitation40. Approximately 35% of the general population had kin with diabetes and 17% had experience of self-injected medications (data not shown). Compared to the Swedish diabetes population, the respondents with diabetes had similar age, BMI, duration with the diagnosis, and share of womenCitation3. Fewer TTO respondents lived in a single household (p = 0.042), and more often had children in their household (p = 0.044) compared to WTP respondents. Otherwise, there were no significant differences between the TTO and WTP respondents.
Table 3. Demographic and background information.
TTO results
Between nine and 13 respondents in the TTO population were classified as protesters and excluded from analysis in each scenario. The number of protesters was similar between hypothetical health state and surveys, i.e. basal-only vs basal-bolus. Consequently, between 978–982 valid responses were analyzed in each TTO health state. Among the valid responses, between 17–25% were non-traders and between 5–7% were max-traders.
TTO utility levels of the TTO health states are presented in . In general, baseline diabetes generated the highest utility level among the health states, followed by diabetes with one flexible injection per day, diabetes with one fixed injection per day, and diabetes with 1 kg weight gain. Diabetes with two fixed injections per day and diabetes with a 3 kg weight gain were generally assigned the lowest utility level. The general population assigned a significantly higher utility to the health states with baseline diabetes, 1 kg, and 3 kg weight gain compared to diabetes respondents in the basal only questionnaire. Basal-only respondents assigned a significantly higher utility to baseline diabetes compared to basal-bolus respondents (general population p = 0.001; diabetes population p = 0.008). Respondents with type 2 diabetes generally ascribe lower utility values to weight gain scenarios and all scenarios in the basal-only questionnaire compared to other respondents (data not shown).
Table 4. Utility values of individual health states.
Resulting attribute-related utility gains are presented in . The utility gain associated with one less injection was statistically significant in both questionnaires for both diabetes respondents and respondents from the general population. For persons with diabetes, the utility gain of one less injection was higher in the basal-bolus version. The utility gain due to flexibility was only significant for respondents from the general population who also assigned a higher utility gain to flexibility compared to the diabetes population. The flexibility related utility gain was similar in the basal-only and the basal-bolus questionnaires. The utility gain of avoiding a 1 kg weight gain was only significant for the diabetes population and there was a utility loss for the general population in the basal only version (due to a higher rating of the health state with weight gain). The utility gain of avoiding a 3 kg weight gain was ∼3-times higher than the utility gain of avoiding a 1 kg weight gain, i.e. a proportional increase in utility gain. The general population assigned a higher utility to avoiding weight gain in the basal-bolus questionnaire, while the diabetes population assigned similar utility gains irrespective of survey version. The only significant difference between persons with type 1 and type 2 diabetes was for the attribute flexibility in the basal-bolus questionnaire, where persons with type 1 diabetes valued flexibility higher than persons with type 2 diabetes (0.024 vs 0.003, p = 0.017).
Table 5. Attribute-related utility gains.
WTP results
demonstrates WTP respondents in terms of protesters and valid responses. Between 16–30% were classified as protesters and excluded from the analysis. The share of protesters were higher in the general population for all scenarios. There were no implausibly high WTP answers. The scenario of avoiding 1 kg weight gain had the lowest fraction of respondents indicating a positive WTP, i.e. respondents willing to pay for the attribute. The most common legitimate reasons for not wanting to pay something was that the attribute did not add any value or that the respondent could not afford to pay.
Table 6. WTP responses.
In line with expectation, the card sorting procedures showed a negative relationship between the amount presented and the number of respondents willing to pay in all WTP scenarios (data not shown). In addition, the regression analyses demonstrate that the WTPs are significantly positively related to income in all but the 1 kg scenario (). The regression analyses also revealed that having diabetes was generally negatively correlated with WTP, as was age in scenario 1 and 3.
Table 7. Ordinary least square (OLS) regression analysis of (LOG) WTP results, per hypothetical WTP scenario.
The WTP for one less injection was higher in the basal-bolus questionnaire for both groups, i.e. a similar finding compared to the utility gains (). The general population assigned a higher value to all convenience attributes compared to the diabetes population. Consistent with the findings in the utility estimation, the WTP for flexibility was lower than the WTP for one less injection. The WTP for flexibility was also similar between the basal-only and basal-bolus questionnaire for the diabetes population, but higher in the basal-bolus version for the general population. The WTP for both one less injection and flexibility was lower than the combined WTP for each of these attributes valued on their own. The WTP for avoiding weight gain was higher in the diabetes population in the basal-only group, while the reverse relationship was true in the basal-bolus population. The WTP to avoid 3 kg weight gain was higher than the WTP of avoiding 1 kg weight gain, but the difference was not proportional. The basal-bolus respondents of the general population valued avoided weight gain higher than basal-only respondents, while the valuation of the diabetes population was independent of survey version. This also corresponds to the findings in the utility estimation. Respondents with type 1 diabetes had lower WTP for both weight attributes in both groups compared to respondents with type 2 diabetes, but the difference was only statistically significant for the 3 kg attribute in the basal only group (224 vs 300, p = 0.026).
Table 8. Results, in SEK per month.
The ranking of the attributes was generally independent of whether preferences were derived with WTP or TTO among the general population, placing the highest value among the single attributes on one less injection (). The ranking among persons with diabetes did, however, differ depending on the method used. In the WTP survey, one less injection was the single attribute rated highest, while that corresponding in the TTO survey was avoiding 3 kg weight gain.
The TTO values are in general of similar magnitude or higher than the WTP estimates. The translated TTO values are more than 3-times higher than the WTP values for one less injection. The methods do, however, produce similar estimates with respect to flexibility. Avoiding weight gain is in general valued a lot higher in the TTO approach, and the increase between 1–3 kg is proportional, while the increases in WTP estimates are diminishing.
The implied value of a QALY based on the utility gain and WTP for the attribute improvements ranges from SEK59,586 to SEK519,600 ().
Table 9. Implied value (in SEK) of a quality-adjusted life-year (QALY).
Discussion
This study estimated the preferences for insulin-related attributes among Swedish persons with diabetes and the Swedish general population using both TTO and WTP. The results show that both methods produce the same ordering of attributes among the general population; valuing one less injection highest and avoiding 1 kg weight gain lowest. The ordering of attribute among the diabetes population differed depending on methods.
The methods produced similar estimates with respect to flexibility, but the results based on the TTO approach were higher for one less injection and avoided weight gain. There are several reasons as to why the methods produce different results. First, there might be an income effect in the WTP estimates, i.e. respondents are limited in their valuation by their budget constraint. The WTP for both one less injection and flexibility was less than the combined WTP of these attributes valued separately which point to the existence of an income effect in the WTP estimates. Second, the TTO estimates are elicited by comparing the utility of different health states—requiring respondents to recall previous responses—while the WTP estimates are based on the direct responses to incremental changes. Furthermore, the WTP estimates are more precise since they are based on the answer to an open question while the TTO estimates are based on the answers to a number of pre-defined iterations. Finally, the utility gain for one less injection should perhaps only be interpreted as a utility gain during the part of the day when the injection would have been made, as proposed in other studiesCitation24. It should be noted that the TTO values were translated to WTP assuming that the value of a QALY is SEK500,000. There is currently no consensus regarding the value of a QALY and the comparisons should be interpreted with some caution.
The results also show that the preferences of persons with diabetes differ from those of the general population. The general population place a higher value on convenience attributes, i.e. a similar finding as in Evans et al.Citation12. This could indicate that the persons with diabetes have adapted to their insulin treatment and do not find it as burdensome, discounting the value of improvements in flexibility and reducing the number of administrations. The diabetes population, on the other hand, place a higher value on avoiding weight gain. This may be explained by the higher weight of diabetes respondents, which could make it more valuable to avoid additional weight. In general, both methods resulted in the same type of differences between the populations.
The response rate was relatively low but according to what can be expected with this kind of survey, which can be perceived as quite demanding for the respondents. The respondents were mostly representative of their respective population, but were—as is often the case in these kind of studies—more educated and had a higher income. This may have caused WTP values to be somewhat over-estimated. It is harder to establish the effect on TTO estimates. Since the respondents were asked to consider hypothetical health states (i.e. not their own), the effect may have been limited. Most results were according to expectations, e.g. baseline diabetes were assigned the highest utility and avoiding a 3 kg weight gain was valued higher than avoiding a 1 kg weight gain. However, some results were contrary to expectations, e.g. persons with diabetes stated a higher WTP for only one less injection than for both one less injection and flexibility in the basal-bolus version. The WTP results passed several tests of validity, including a significant relationship between income and WTP and a lower share preparing to pay when the amount to pay increases.
There was a significant share of respondents who did not want to trade any lifetime to avoid the health state. The share of non-traders are not always reported in TTO studies, which makes it difficult to compare our rate to what is usually reported. Since the lowest possible share of remaining life-time to trade was relatively high, the non-traders were only excluded if they indicated that they did not care for their answer in the follow-up question. Some of the non-traders included in the analysis could have been protesters to the scenario, which would over-estimate the utility values. However, this should not have an impact on the estimated utility gains if the share of protesters are similar in all health states. There were also a relatively large part of the respondents who were classified as protesters in the WTP survey. This is to be expected since the survey is performed in a setting where insulin is provided free of charge. Contrary to expectations, however, the rate of protesters was higher among the general population.
This study elicited the preferences for three insulin-related attributes; administration frequency, administration flexibility, and treatment-induced weight gain. Preferences for reduced HbA1c or reduced risk of hypoglycemic events were not studied. This would require a separate survey in order not to overload respondents.
The WTP for avoiding 1 kg weight gain was SEK265 in a study of 461 Swedish persons with type 2 diabetesCitation22, SEK296 in a study of 270 Danish persons with type 2 diabetesCitation20, and SEK268 among 252 British persons with diabetesCitation21. These results are similar to estimates presented in this study. The studies of Swedish and Danish persons with type 2 diabetes also presented the WTP for one less injection; SEK159 and SEK363, respectively. This study reports higher WTP estimates for one less injection. However, the comparator in the previous studies was self-defined—i.e. the respondent’s current number of injections per day—while the comparator in the current study was pre-defined (basal-only: two injections; basal-bolus: five injections). The WTP for flexibility was also lower in the Swedish and Danish study (SEK140 and SEK273, respectively). However, these studies applied a different definition of flexibility—”irrespective of meal”—which could account for the difference.
The utility loss of gaining a 3%, 5%, and 7% increase in body weight was 0.004, 0.046, and 0.105, respectively, in a TTO survey of 96 Canadian persons with type 2 diabetesCitation17. These estimates are not directly comparable to the utility gains estimated in this study, but indicate that the magnitude are of approximately the same size. Evans et al.Citation12 estimated the utility gain of one less injection and flexibility among the general population and diabetes population in several countries. The utility gain of one less injection was 0.039 among the general population and 0.042 among the diabetes population in the basal-only version of the questionnaire. The utility gain in the basal-bolus version of the questionnaire was 0.022 in the general population and 0.021 in the diabetes population. The estimates reported in this study are of similar size, but the study by Evans et al. reported higher estimates for the basal-only version, while the reverse is true for this study. There are reasons to explain both results. The higher utility gain for the basal-bolus version—which is found in this study—could be explained by the injection burden. One less injection could have a higher value to someone taking five injections each day compared to someone taking two injections each day. The higher utility gain in the bolus-only version—which was found in the study by Evans et al.Citation12—could be explained by the diminishing marginal burden of one more injection. Adding one injection to someone who currently only needs one injection could be perceived as a larger incremental burden than for someone who already takes five injections daily. The study by Evans et al. also estimated the utility of flexibility, although defined as any time of day. The utility gain was 0.016 among the general population and 0.013 among the diabetes population in the basal-only version. The utility gain in the basal-bolus version was 0.015 among the general population and 0.004 in the diabetes population. The present study reports somewhat lower estimates, which could be explained by the less beneficial definition of flexibility (±3 h). Both studies do, however, show a higher valuation among the general population and somewhat lower values in the basal-bolus versions.
Conclusions
This study indicates that both WTP and TTO are methods which can be used to elicit preferences for attributes related to insulin treatment. The ranking of attributes and the differences between study populations were generally independent of evaluation method, and the TTO method resulted in similar or higher values compared to the WTP method.
Transparency
Declaration of funding
This study was supported by Sanofi AB. The sponsor reviewed the manuscript, but had no influence on the final content and was not involved in the performance of the study.
Declaration of financial/other relationships
SO is an employee at IHE, who received funding for this study by Sanofi. HN is an employee at IHE, who received funding for this study by Sanofi. UP is the CEO of IHE, who received funding for this study by Sanofi. JME peer reviewers on this manuscript have no relevant financial or other relationships to disclose.
Notes
†There are no established values of a QALY in the literature, and the Swedish Pharmaceutical and Benefits Agency (TLV) does not apply explicit threshold values for a QALY. However, TLV considers the severity of diabetes to be moderate-to-severeCitation35. For this disease severity, TLV have approved applications with a cost per QALY of SEK500,000Citation36,Citation37.
References
- World Health Organization (WHO). About diabetes. http://www.who.int/diabetes/action_online/basics/en/. Accessed February 19, 2015
- 1177 Vårdguiden Stockholms Läns Landsting. Läkemedel vid Typ 1-diabetes. www.1177.se Accessed March 3, 2016
- The Swedish National Diabetes Register (NDR). Årsrapport - 2014 års resultat. 2015
- Yki-Jarvinen H, Bergenstal R, Ziemen M et al. New insulin glargine 300 units/mL versus glargine 100 units/mL in people with type 2 diabetes using oral agents and basal insulin: glucose control and hypoglycemia in a 6-month randomized controlled trial (EDITION 2). Diabetes Care 2014;37:3235–43
- Ritzel R, Roussel R, Bolli GB, et al. Patient-level meta-analysis of the EDITION 1, 2 and 3 studies: glycaemic control and hypoglycaemia with new insulin glargine 300 U/ml versus glargine 100 U/ml in people with type 2 diabetes. Diabetes Obes Metab 2015;17:859–67
- Goldman J, White JR Jr. New insulin glargine 300 U/mL for the treatment of type 1 and type 2 diabetes mellitus. Ann Pharmacother 2015;49:1153–61
- Davies MJ, Gagliardino JJ, Gray LJ et al. Real-world factors affecting adherence to insulin therapy in patients with Type 1 or Type 2 diabetes mellitus: a systematic review. Diabet Med 2013;30:512–24
- Peyrot M, Rubin RR, Khunti K. Addressing barriers to initiation of insulin in patients with type 2 diabetes. Prim Care Diabetes 2010;4(1 Suppl):S11–S8
- Peyrot M, Barnett AH, Meneghini LF, et al. Insulin adherence behaviours and barriers in the multinational Global Attitudes of Patients and Physicians in Insulin Therapy study. Diabet Med 2012;29:682–9
- Donnelly LA, Morris AD, Evans JM, et al. Adherence to insulin and its association with glycaemic control in patients with type 2 diabetes. QJM 2007;100:345–50
- Morris AD, Boyle DI, McMahon AD, et al. Adherence to insulin treatment, glycaemic control, and ketoacidosis in insulin-dependent diabetes mellitus. The DARTS/MEMO Collaboration. Diabetes Audit and Research in Tayside Scotland. Medicines Monitoring Unit. Lancet 1997;350:1505–10
- Evans M, Jensen HH, Bogelund M, et al. Flexible insulin dosing improves health-related quality-of-life (HRQoL): a time trade-off survey. J Med Econ 2013;16:1357–65
- Boye KS, Matza LS, Walter KN, et al. Utilities and disutilities for attributes of injectable treatments for type 2 diabetes. Eur J Health Econ: HEPAC 2011;12:219–30
- Higgins A, Barnett J, Meads C et al. Does convenience matter in health care delivery? A systematic review of convenience-based aspects of process utility. Value Health 2014;17:877–87
- Bagust A, Beale S. Modelling EuroQol health-related utility values for diabetic complications from CODE-2 data. Health Econ 2005;14:217–30
- Evans M, Khunti K, Mamdani M, et al. Health-related quality of life associated with daytime and nocturnal hypoglycaemic events: a time trade-off survey in five countries. Health Quality Life Outcomes 2013;11:90
- Lane S, Levy AR, Mukherjee J, et al. The impact on utilities of differences in body weight among Canadian patients with type 2 diabetes. Curr Med Res Opin 2014;30:1267–73
- Levy AR, Christensen TL, Johnson JA. Utility values for symptomatic non-severe hypoglycaemia elicited from persons with and without diabetes in Canada and the United Kingdom. Health Quality Life Outcomes 2008;6:73
- Shingler S, Fordham B, Evans M, et al. Utilities for treatment-related adverse events in type 2 diabetes. J Med Econ 2015;18:1-11
- Bogelund M, Vilsboll T, Faber J, et al. Patient preferences for diabetes management among people with type 2 diabetes in Denmark - a discrete choice experiment. Curr Med Res Opin 2011;27:2175–83
- Guimaraes C, Marra CA, Colley L, et al. A valuation of patients' willingness-to-pay for insulin delivery in diabetes. Int J Technol Assess Health Care 2009;25:359–66
- Jendle J, Torffvit O, Ridderstrale M, et al. Willingness to pay for health improvements associated with anti-diabetes treatments for people with type 2 diabetes. Curr Med Res Opin 2010;26:917–23
- Lloyd A, Nafees B, Barnett AH, et al. Willingness to pay for improvements in chronic long-acting insulin therapy in individuals with type 1 or type 2 diabetes mellitus. Clin Therapeut 2011;33:1258–67
- Brennan VK, Dixon S. Incorporating process utility into quality adjusted life years: a systematic review of empirical studies. Pharmacoeconomics 2013;31:677–91
- Cookson R. Willingness to pay methods in health care: a sceptical view. Health Econ 2003;12:891–4
- Brazier J, Ratcliffe J, Salomon JA, et al. Measuring and valuing health benefits for economic evaluation. New York: Oxford University Press, 2007
- Riddle MC, Bolli GB, Home PD, et al. Efficacy and safety of flexible versus fixed dosing intervals of insulin glargine 300 U/mL in people with type 2 diabetes. Diabetes Technol Ther 2016;18:252–7
- Home PD, Bergenstal RM, Bolli GB, et al. New insulin glargine 300 Units/mL versus glargine 100 Units/mL in people with type 1 diabetes: a randomized, phase 3a, open-label clinical trial (EDITION 4). Diabetes Care 2015;38:2217–25
- Yki-Jarvinen H, Bergenstal RM, Bolli GB, et al. Glycaemic control and hypoglycaemia with new insulin glargine 300 U/ml versus insulin glargine 100 U/ml in people with type 2 diabetes using basal insulin and oral antihyperglycaemic drugs: the EDITION 2 randomized 12-month trial including 6-month extension. Diabetes Obes Metab 2015;17:1142–9
- Bateman I, Carson R, Day B, et al. Economic Valuation with Stated Preference Techniques - A Manual UK Department for Transport. Cheltenham, UK: Edward Elgar Publishing Inc.; 2002
- Torrance GW, Furlong W, Feeny D. Health utility estimation. Expert Rev Pharmacoecon Outcomes Res 2002;2:99–108
- Statistics Sweden [Swedish: Statistiska Centralbyrån (SCB)]. Återstående livslängd efter kön och ålder. Prognosår 2013–2110. www.statistikdatabasen.scb.se. Accessed February 2, 2016
- FASS. Produktresumé (SPC), Toujeo, Injektionsvätska, lösning i förfylld injektionspenna 300 enheter/ml. 2015; www.fass.se. Accessed January 28, 2016.
- Dental and Pharmaceuticals Benefits Agency [Swedish: Tandvårds-och läkemedelsförmånsverket (TLV)]. Genomgång av läkemedel vid diabetes. 2010;76
- Svensson M, Nilsson FO, Arnberg K. reimbursement decisions for pharmaceuticals in sweden: the impact of disease severity and cost effectiveness. PharmacoEconomics 2015;33:1229–36
- Hugosson K, Engström A. Threshold value for a QALY - correlation with disease severity and decision uncertainty. Value Health 2008;11:A49 PHP67
- Tyc K, Steitz JA. A new interaction between the mouse 5' external transcribed spacer of pre-rRNA and U3 snRNA detected by psoralen crosslinking. Nucleic Acids Res 1992;20:5375–82
- The Riksbank [Swedish: Riksbanken]. http://www.riksbank.se/sv/Rantor-och-valutakurser. Accessed April 14, 2016
- Statistics Sweden [Swedish: Statistiska Centralbyrån (SCB)]. Sammanräknad förvärvsinkomst för boende i Sverige den 31/12 resp år (antal personer, medel-och medianinkomst samt totalsumma) efter region, kön, ålder och inkomstklass. År 1991-2013 (Urval: Medelinkomst, riket, båda köonen, totalt 20 år+, alla inkomstklasser, 2014). 2015. www.statistikdatabasen.scb.se. Accessed February 23, 2016
- Statistics Sweden [Swedish: Statistiska Centralbyrån (SCB)]. Utbildningsnivå för befolkningen efter inrikes/utrikes född, kön och åldersgrupp 2014 (urval: Population: Befolkningen 2014, 20-74 år). 2015. www.statistikdatabasen.scb.se Accessed December 15, 2015