
Abstract
Objective: This retrospective cohort study utilized real-world claims data to assess the clinical and economic burden of peripheral T-cell lymphoma (PTCL) over the continuum of care in the US.
Methods: Data were extracted from US administrative claims databases to identify adult patients with PTCL (ICD-9-CM code 202.7X) diagnosed between October 2007 and June 2011. Patients had to have ≥6 months of continuous enrollment before and ≥12 months of continuous enrollment after their index date (date of first PTCL diagnosis). PTCL patients were matched (1:5) by age, sex, region, plan type, payer type, and length of continuous enrollment, to a control group of randomly selected patients without PTCL. Patient-level healthcare resource utilization data and associated costs (in US dollars) were measured. Mean costs per patient per month were determined.
Results: Of 2820 patients with PTCL, 1000 met all inclusion criteria (median age = 57 years; 57.5% male) and were matched to the control group (n = 5000). On an average monthly basis, PTCL patients were hospitalized more frequently (0.07 vs 0.01 admissions; p < 0.0001) and had a longer length of hospital stay (6.4 vs 4.0 days; p < 0.0001) compared with controls. PTCL patients also had higher monthly utilization of pharmacy services (2.85 vs 0.97 prescriptions; p < 0.0001), office visits (1.35 vs 0.34 visits; p < 0.0001), ER visits (0.07 vs 0.02 visits; p < 0.0001), hospice stays (0.05 vs 0.01 stays; p < 0.0001) and other patient services/procedures. Overall, PTCL patients incurred higher average monthly costs per patient compared with control patients ($6327.84 vs $388.39; p < 0.0001), driven mainly by hospitalizations (32.2% of overall costs) and pharmacy services (19.6%).
Conclusions: This is the first real-world study to quantify healthcare resource utilization, costly treatment, and overall medical expenditure in commercially insured PTCL patients. Better tolerated and more effective treatments may improve disease management and reduce the clinical and economic burden of PTCL.
Introduction
Peripheral T-cell lymphoma (PTCL) is an aggressive form of non-Hodgkin lymphoma (NHL) comprising multiple histologically and clinically classified sub-types, the most common of which are PTCL-not otherwise specified (PTCL-NOS) (25.9% of all PTCL cases), angioimmunoblastic T-cell lymphoma (AITL) (18.5%) and systemic anaplastic large cell lymphoma (sALCL) (12%)Citation1–3. According to recent SEER estimates, PTCL accounts for ∼4% of all new NHL diagnoses annually in the US, equating to ∼9500 new cases of PTCL each yearCitation4.
Overall, PTCL is associated with poor prognosis when compared to most forms of aggressive B-cell NHL due to advanced disease and poor performance status at presentation, as well as lower response rates and higher rates of relapse, which result in limited survivalCitation5–7. Treatment for PTCL often follows that of B-cell lymphomas, yet this generally results in poor outcomesCitation3. Anthracycline-containing regimens such as CHOP/CHOEP or CHOP-like combinations have been used in the front-line treatment of PTCLCitation1,Citation7,Citation8, with stem cell transplantation (SCT) often recommended as consolidation in eligible patientsCitation1,Citation8,Citation9; however, relapse is commonCitation3,Citation8 and no standard of care has been established for patients with relapsed/refractory disease. Until the more recent introduction of rationally designed therapies (e.g. brentuximab vedotin [in sALCL], romidepsin, and belinostat) and novel chemotherapies (e.g. pralatrexate)Citation1,Citation9, outcomes for relapsed/refractory PTCL patients were particularly poor, with a median overall survival of 5.5 months among non-SCT patientsCitation10, suggesting a significant unmet medical need for more effective treatments.
Although a study of US medical costs associated with NHL has been previously undertakenCitation11; to date, there have been no published studies directly assessing the overall clinical and economic burden of PTCL, and literature estimates for this are lacking. With this in mind, we conducted a retrospective cohort study using real-world claims data to assess the clinical and economic burden of PTCL over the continuum of care in the US. Specific objectives were to characterize patients with PTCL, and to measure their healthcare resource utilization and associated costs.
Patients and methods
Data sources
Data were utilized from the Truven MarketScan commercial claims database, which comprises fully adjudicated medical and pharmaceutical claims for over 100 million unique patients (equating to ∼17 million covered lives per year) across the US. Data were also extracted from the MarketScan Medicare Supplemental database, which represents 6.4 million lives, and provides details of healthcare claims for elderly patients (aged > = 65 years) and disabled persons with supplemental Medicare insurance (Medigap coverage). The Medicare Supplemental database provides a comprehensive and longitudinal view of the insured elderly population that includes the older population with PTCL.
Available data across both databases included inpatient and outpatient diagnoses (International Classification of Diseases, Ninth Edition, Clinical Modification [ICD-9-CM] format) and procedures (Current Procedural Terminology, Revision 4 [CPT-4] and Healthcare Common Procedure Coding System [HCPCS] formats), prescription records (National Drug Code [NDC] and J-code [code for injectable drugs that cannot normally be self-administered] formats, as well as quantities of medications dispensed), demographic variables, provider specialties, and eligibility dates related to plan enrollment and participation.
In compliance with the Health Insurance Portability and Accountability Act, all unique patient data were anonymized. As a retrospective cohort analysis of de-identified patient data, this study was exempt from Institutional Review Board review.
Sample selection
This study used a retrospective longitudinal cohort design. Patients with a diagnosis of PTCL (ICD-9 codes 202.70–202.78) between October 1, 2007 and June 30, 2011 (the index window) were considered for inclusion in the study. For each patient, the date of their first recorded PTCL diagnosis code during the index window was defined as the index date. Patients whose first diagnosis of PTCL was recorded before the index window were not captured in this study. All patients were required to be aged ≥18 years as of the calendar year in which their index date occurred, to have had ≥6 months of continuous enrollment before their index date (the pre-index period), and ≥12 months of continuous enrollment after the index date (the post-index period). A second confirmatory PTCL diagnosis code within 12 months after each patient’s index date was also required. Patients were excluded if their birth year and sex were missing from the MarketScan dataset, or if they had undergone SCT during the pre-index period.
A matched control group was used in this study. A control group of non-PTCL patients, enrolled over the same study period, were randomly selected from the MarketScan datasets and represented the average insured patient population from the US payer perspective. As required for PTCL patients, all control patients had to be aged ≥18 years on the index date, with ≥6 months of continuous enrollment before their index date, and ≥12 months of continuous enrollment after their index date. The control group was matched (1:5) based on sex, age (5-year category), region, plan type, payer type, and length of continuous enrollment using a greedy nearest neighbor matching without replacement. The index date for the controls was assigned as the same date as their matched cases.
Study measures and analysis
Patient-level healthcare resource utilization and associated costs were measured for both the PTCL and matched control groups. Cost estimates (reported in 2013 US dollars) were based on net payments received by the providers, as reported by the insurance carrier, excluding deductible, coinsurance, and co-ordination of benefits (COB). Healthcare costs included inpatient hospitalizations, outpatient pharmacy services, outpatient office visits, emergency room (ER) visits, hospice care, first SCT, and other patient-related costs (such as laboratory tests, radiology/imaging procedures, blood transfusions, intravenous injections, secondary SCT, and other ancillary procedures). Mean costs per patient per month were estimated; the total cost for each resource category during the follow-up period was divided by the number of patients in the cohort and then divided by 12 to obtain mean cost per month.
Descriptive summary statistics were used throughout. Statistical differences between cohorts were assessed using a two-sided t-test for continuous variables and Pearson’s Chi-square test for categorical variables. The regression-adjusted total resource utilization cost per month and across the study period were estimated using a generalized linear model assuming a gamma distribution and a log-link function. Sex, age, region, plan type, payer type, length of enrollment, and Charlson/Deyo Comorbidity Index (CCI) were included as covariates in the model. In all formal statistical comparisons, a p-value <0.05 was considered statistically significant. All analyses were undertaken using SAS version 9.3 (SAS Institute Inc., Cary, NC).
Results
Patients
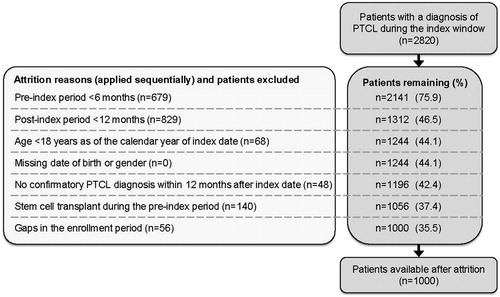
Of 2820 patients with an ICD-9 code for PTCL identified during the index window, 1000 met all of the inclusion criteria and were matched to the control group of non-PTCL patients (n = 5000). Reasons for attrition of PTCL patients are provided in . The most common reasons for exclusion of PTCL patients were an insufficient post-index follow-up (<12 months; n = 829) and an insufficient pre-index period (<6 months; n = 679).
Figure 1. Selection of PTCL patients. PTCL, peripheral T-cell lymphoma.
Patient demographics and baseline characteristics are presented in . Overall, PTCL patients and their matched controls were comparable in terms of age, sex, region, payer type, and duration of follow-up. Patients’ median age was 57 years and 57.5% were male. Over half of the patients resided in the north central and southern regions of the US. Fifty-nine percent of patients had either Preferred Provider Organization (PPO) or Exclusive Provider Organization (EPO) health plans, and only 27% of patients had Medicare Supplemental coverage.
Table 1. Patient demographics and baseline characteristics.
PTCL patients had a higher incidence of comorbidities than control patients, as reflected in a significantly higher mean CCI score (1.72 vs 0.39, respectively; p < 0.0001). The most common comorbidities reported in PTCL patients were hypertension (31%), hypercholesterolemia and hyperlipidemia (22%), pain in joint (13%), diabetes mellitus without complication (12%), and diseases of the lung (12%).
Resource utilization and costs
PTCL patients had significantly higher resource utilization than their matched controls (). On an average monthly basis, PTCL patients were hospitalized more often, and had a longer duration of stay in hospital compared with control patients. In addition, PTCL patients had a higher utilization of pharmacy services, outpatient office visits, ER visits, hospice stays, and other patient services/procedures (all p < 0.0001 vs control patients). One hundred and fourteen (11.4%) PTCL patients underwent SCT over the course of follow-up; none of the control patients underwent this procedure.
Table 2. Healthcare resource utilization rates and costs.
In line with the increase in resource utilization, PTCL patients incurred significantly higher total average monthly healthcare costs per patient compared with control patients ($6327.84 [$4349.80, regression adjusted] vs $388.39 [$329.16, regression adjusted], respectively; p < 0.0001) (). Higher costs in PTCL patients were driven mainly by hospitalizations (32.2% of overall costs), pharmacy services (19.6% of overall costs), and other patient services/procedures (35.4% of overall costs). The mean cost per transplant patient (including both inpatient and outpatient costs post-transplant) in the PTCL cohort was $126,093.58 (standard deviation [SD] = $101,294.70).
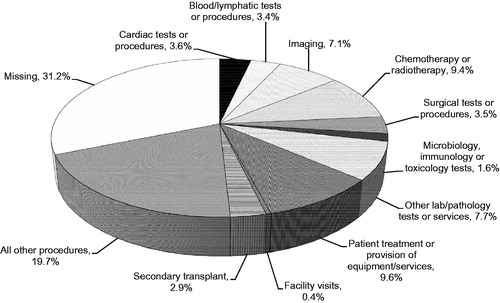
The distribution of other patient services based on cost contribution is shown in ; other patient procedures/services associated with the greatest cost contribution (>5% of costs) were patient treatment or provision of equipment/services, administration of chemotherapy or radiotherapy, other laboratory/pathology tests or services, and imaging investigations.
Figure 2. Breakdown of “other” patient services based on cost distribution.
Hospitalization data
The distribution of the most frequent diagnosis codes and procedures associated with hospitalization are shown in and , respectively. Almost half of PTCL patients were hospitalized for general symptoms of fever or malaise (49%), respiratory/chest symptoms (48%), or other/unspecified procedures and aftercare (45%) (). Other common diagnoses among PTCL patients (>30% of patients) were fluid/electrolyte/acid-base balance disorders, essential hypertension, other and unspecified anemias, and other diseases of the lung. The most frequent procedures performed in the hospital setting were imaging investigations, cardiac monitoring, chemotherapy injections, transfusion-related procedures, and surgical pathology ().
Table 3. Most common diagnosis codes associated with hospitalizations.
Table 4. Patient-level breakdown of the top 20 most common procedures associated with hospitalization.
Discussion
The present analysis of “real-world” claims data quantifies healthcare resource utilization rates and overall costs in PTCL patients. Among patients in this study, total average monthly costs amounted to $6327.84 ($4349.80, regression adjusted) per PTCL patient, compared with $388.39 ($329.16, regression adjusted) for matched patients (p < 0.0001). Hospitalizations, in particular, represented a large proportion of the clinical and economic burden in PTCL, although PTCL patients had significantly higher utilization of all measured healthcare services (hospital admissions, pharmacy services, outpatient office visits, ER visits, hospice stays, SCT) compared with controls. PTCL patients had a particularly high utilization of pharmacy (drug) services and other patient procedures and services, especially those pertaining to patient treatment or provision of equipment/services, administration of chemotherapy or radiotherapy, other laboratory/pathology tests or services, and imaging investigations. SCT was performed in 11.4% of PTCL patients, and was also a significant contributor to cost. PTCL represents a potentially significant economic burden in the US when considering the annual rate of new PTCL diagnoses in the US (∼9500 new cases per year based on recent SEER estimates)Citation4.
Higher healthcare resource utilization in PTCL patients likely reflects a less healthy population compared with controls, as suggested by the higher rate of comorbidities in the former. However, it may also reflect the complexity of PTCL management and administration of intravenous drugs and radiotherapyCitation9. Many PTCL patients, particularly older, sicker patients with more advanced disease, may experience disease- and treatment-related complications (as suggested by the distribution of the most common diagnosis codes associated with hospitalizations), especially when intensive chemotherapy is administered.
Utilization of SCT in this PTCL patient population is important to highlight. The expense of SCT (mean cost of $126 093.58 per transplant patient) in this PTCL cohort was considerable. However, results of a large prospective phase 2 studyCitation12 suggest that SCT is associated with relatively modest improvements in survival over historical results in patients treated with anthracyclines aloneCitation13. While autologous SCT for the frontline treatment of PTCL is endorsed by practice guidelines and clinical expertsCitation9,Citation14, only a small proportion of patients (11.4%) in this cohort underwent this procedure. This was surprising, since the average patient age in this cohort is younger than that observed in historic PTCL cohorts (median 57 vs 62 years)Citation2. Taken together, the low utilization of SCT in a real-world population and modest expected benefit suggest that SCT may have little overall influence on disease prognosis across the PTCL patient population, despite its high cost. In turn, this highlights the need for better management of PTCL, including more widespread use of, and development of additional, effective, and less toxic treatments (e.g. immunotherapies and novel targeted treatments) requiring lower resource utilization in order to reduce the clinical and economic burden.
This study is the first dedicated analysis exploring the burden of disease associated with PTCL, although a recent publication has reported the costs of intravenous administration of chemotherapy for this indication in a similarly designed retrospective cohort analysis of US administrative claims data (2007–2012)Citation15. Consistent with our findings, the costs associated with administration of intravenous chemotherapy to PTCL patients and associated visit-related services were considerable (mean of US $5735 per visit [$127–$794 for administration alone] and $9356 per patient per month [$594–$1808 for administration alone], 2012 prices). While not specifically in PTCL, a retrospective study, also utilizing data from US MarketScan claims databases (1999–2000), reported the direct burden of aggressive or indolent NHL during the first 2 years of treatmentCitation11. As in our study, patients with aggressive or indolent NHL had significantly greater healthcare resource utilization and related costs than control patients. Mean monthly costs were $5871 for aggressive NHL and $3833 for indolent NHL, with the key cost drivers cited as hospitalizations and outpatient office visitsCitation11. It is worthwhile considering our findings in the context of costs associated with other cancers. A previous retrospective study using data from 1998–2000 administrative databases including claims and employment-related information on individuals insured by private or Medicare supplemental plans estimated the costs of different cancers, with costs for brain cancer ($6364), ovarian cancer ($6373), lung cancer ($6520), and pancreatic cancer ($7616) and aggressive NHL ($5873)Citation16. Our findings suggest that PTCL is similar to other more common cancers.
Retrospective analyses such as this are subject to a number of limitations. There were a number of gaps in the treatment/pharmacy claims data, potentially due to patients taking part in clinical trials (as recommended by NCCN treatment guidelines)Citation9. It was, therefore, not possible to longitudinally follow patient therapy completely, which may have resulted in an overall under-estimation of costs. Two hundred and ninety-two patients included in this analysis also had a diagnosis code for mycosis fungoides of unknown staging (ICD-9 code: 202.1), and it is unclear whether these patients had indolent or transformed (aggressive) PTCL. However, in a sensitivity analysis excluding these patients, overall per patient per month costs were shown to be higher, at $7521 (n = 708). Hence, our results may under-estimate the true clinical and economic burden of PTCL. The post-index year timeframe in the present analysis was ≥12 months, which may have excluded patients with the most aggressive disease. However, as the 1-year survival of patients with the most common PTCL sub-types of PTCL-NOS, AITL, and sALCL is 70–80%Citation2, the selected post-index year timeframe of ≥12 months is unlikely to have had a major influence on the overall findings. In addition, there is a possibility of misclassification of PTCL due to the inherent complexity of the diseaseCitation2, which may have resulted in misdiagnosis in some patients. In an effort to reduce PTCL misdiagnosis, a requirement of this study was secondary confirmation of PTCL diagnosis after index—a technique that has previously been used to improve diagnostic accuracy in other malignanciesCitation17. Further, as our analysis was based on observations from transactional claims data, it was not possible to measure disease severity, disease progression/relapse, or the specific treatments that were administered during hospitalization. Also, the index window in this study would not have captured more recently approved drugs now indicated for the treatment of PTCL, e.g. belinostatCitation18. Finally, the study cohorts comprised commercially insured patients in the US, and as such the results cannot be generalized to other PTCL patient populations.
Conclusions
This retrospective cohort analysis is the first study to quantify resource utilization rates, treatments, and overall medical expenditure in the commercially insured US PTCL population. Hospitalizations, in particular, represent a major cost driver. There continues to be a need for treatments that can help improve disease management and patient outcomes, and reduce the economic burden of PTCL.
Transparency
Declaration of funding
This study was sponsored by Millennium Pharmaceuticals, Inc., a wholly owned subsidiary of Takeda Pharmaceutical Company Limited. Employees of Millennium Pharmaceuticals, Inc. were involved in the data analysis and interpretation, and in the preparation of the manuscript.
Declaration of financial/other relationships
HML, VB, and YZ are employees of Millennium Pharmaceuticals, Inc. CB, WW, and AS were contracted by Millennium Pharmaceuticals, Inc. to conduct this study. KRC is a consultant/advisor for Celgene, Millennium Pharmaceuticals, Inc. and Spectrum Inc., has received grant/research funding from Spectrum, Inc., Kyowa Hakko Kirin Pharma, Inc., Millennium Pharmaceuticals, Inc., Celgene, and sponsorship from Millennium Pharmaceuticals, Inc. JME peer reviewers on this manuscript have no relevant financial or other relationships to disclose.
Acknowledgments
The authors would like to acknowledge Emma Landers of FireKite, an Ashfield company, part of UDG Healthcare plc, for writing support during the development of this manuscript, which was funded by Millennium Pharmaceuticals, Inc.
References
- Karlin L, Coiffier B. The changing landscape of peripheral T-cell lymphoma in the era of novel therapies. Semin Hematol 2014;51:25-34
- Vose J, Armitage J, Weisenburger D: International peripheral T-cell and natural killer/T-cell lymphoma study: pathology findings and clinical outcomes. J Clin Oncol 2008;26:4124-30
- Foss FM, Zinzani PL, Vose JM, et al. Peripheral T-cell lymphoma. Blood 2011;117:6756-67
- Howlader N, Noone A, Krapcho M, et al. SEER Cancer Statistics Review, 1975-2011. http://seer.cancer.gov/csr/1975_2011 (based on November 2013 SEER data submission, posted to the SEER website Apri 2014 Accessed March 31, 2015
- Escalon MP, Liu NS, Yang Y, et al. Prognostic factors and treatment of patients with T-cell non-Hodgkin lymphoma: the M. D. Anderson Cancer Center experience. Cancer 2005;103:2091-8
- Gallamini A, Stelitano C, Calvi R, et al. Peripheral T-cell lymphoma unspecified (PTCL–U): a new prognostic model from a retrospective multicentric clinical study. Blood 2004;103:2474-9
- Lunning MA, Horwitz S. Treatment of peripheral T-cell lymphoma: are we data driven or driving the data? Curr Treat Options Oncol 2013;14:212-23
- Dreyling M, Thieblemont C, Gallamini A, et al. ESMO Consensus conferences: guidelines on malignant lymphoma. part 2: marginal zone lymphoma, mantle cell lymphoma, peripheral T-cell lymphoma. Ann Oncol 2013;24:857-77
- National Comprehensive Cancer Network (NCCN). NCCN clinical pracrtice guidelines in oncology: Non-Hodgkin's Lymphoma. Version 2. 2015 https://www.tri-kobe.org/nccn/guideline/hematologic/nhl/english/bcel.pdf [Accessed March 31, 2015]
- Mak V, Hamm J, Chhanabhai M, et al. Survival of patients with peripheral T-cell lymphoma after first relapse or progression: spectrum of disease and rare long-term survivors. J Clin Oncol 2013;31:1970-6
- Kutikova L, Bowman L, Chang S, et al. Medical costs associated with non-Hodgkin's lymphoma in the United States during the first two years of treatment. Leuk Lymphoma 2006;47:1535-44
- d'Amore F, Relander T, Lauritzsen GF, et al. Up-front autologous stem-cell transplantation in peripheral T-cell lymphoma: NLG-T-01. J Clin Oncol 2012;30:3093-9
- Abouyabis AN, Shenoy PJ, Sinha R, et al. A systematic review and meta-analysis of front–line anthracycline–based chemotherapy regimens for peripheral T-cell Lymphoma. ISRN Hematol 2011;2011:623924
- Moskowitz AJ, Lunning MA, Horwitz SM. How I treat the peripheral T-cell lymphomas. Blood 2014;123:2636-44
- Kruse GB, Potashman MH, Stavrakas S, et al. Administration costs of intravenous chemotherapy in treating peripheral T-cell lymphoma. J Med Econ 2014;17:446-58
- Chang S, Long SR, Kutikova L, et al. Estimating the cost of cancer: results on the basis of claims data analyses for cancer patients diagnosed with seven types of cancer during 1999 to 2000. J Clin Oncol 2004;22:3524-30
- Setoguchi S, Solomon DH, Glynn RJ, et al. Agreement of diagnosis and its date for hematologic malignancies and solid tumors between medicare claims and cancer registry data. Cancer Causes Control 2007;18:561-9
- Spectrum Pharmaceuticals Inc. BELEODAQ® (belinostat) for injection, for intravenous administration. Full prescribinginformation (July 2014). Spectrum Pharmaceuticals Inc., Handerson, NV, 2014 http://www.accessdata.fda.gov/drugsatfda_docs/label/2014/206256lbl.pdf. Accessed March 31, 2015