
Abstract
Objective: Complications contribute largely to the economic gravity of diabetes mellitus (DM). How they arise and are treated differs substantially between countries. This paper assesses the total annual, direct, and indirect cost of severe hypoglycemia events (SHEs) in nine European countries: Bulgaria, Croatia, the Czech Republic, Greece, Hungary, Macedonia/the former Yugoslav Republic of Macedonia (MK), Poland, Slovenia, and Spain.
Methods: Data was collected on epidemiology, treatment structure, SHE-driven resource consumption, and unit costs. Two systematic reviews—on the SHE rates and the resources used for treatment—and data on the days-of-work lost due to SHE along with salaries and employment rates were used. The total SHE cost in each country was calculated and how the differences are driven by individual parameters was analysed.
Results: The annual costs of SHEs varied in absolute terms from €379,951.25 in MK up to €58,429,684.40 in Spain, or—when expressed per one drug-treated DM patient—from €5.47 in Bulgaria up to €17.74 in Spain. Indirect cost constituted between 6.01% (MK) and 26.49% (Hungary) of the total cost. The differences between countries are driven mostly by the cost of treating a single event, and this is related to general differences in prices.
Limitations: The main limitation is the lack of good quality data in some parts, and the necessity to use mean-value imputations, experts’ opinions, etc. Additionally, we only considered DM treatment as the SHE driver, while other elements, e.g. style of living, may contribute substantially.
Conclusions: A common framework can be applied to estimate the economic burden of SHE in various countries, allowing one to identify the drivers of differences in cost. Treating DM is complex, and so no resolute conclusions ought to be drawn as to whether SHE management is better in one country than another.
Introduction
Diabetes mellitus (DM) prevalence and related costs, including the management of complications, represent a growing concern for public healthcare systems. Hex et al.Citation1 estimated the total (direct—i.e. associated to medical resources: drugs, medical procedures, etc.; and indirect—i.e. an opportunity cost of patients not being productive) cost to amount to £23.7 billion in the UK annually in 2010/2011 and forecasted its increase (in real terms) up to £39.8 billion in 2035/2036, with the majority (58%) being the indirect cost. According to their estimates, DM consumes 10% of the total health resource expenditure, and this ratio will rise to as much as 17% in a quarter of a century. Kanavos et al.Citation2 presented the results of a comparative study in five Western European countries: France, Germany, Italy, Spain, and the UK. According to their results, the direct cost amounts to between €5.45 billion in Spain and €43.2 billion in Germany, but the absence of credible data on prevalence and cost and the possibility of the true cost being under-estimated or unmeasured are stressed.
Not only is diabetes an expensive medical condition, but it is also a multi-dimensional one, leading to a wide range of complications that themselves are associated with high resource consumption. This is confirmed, e.g. by the following two studies. The total cost of type 2 DM in Croatia amounted to €351.7 million in 2009, i.e. 11.49% of the national insurer’s budgetCitation3. This cost included €50.2 million for care and medications used directly in DM treatment (14.28%) and €301.5 million stemming from diabetes-related chronic complications (85.72%). In Hungary the estimated total direct cost of DM therapies and related severe adverse events amounted to €605 million in 2008, or 13% of the total healthcare expenditureCitation4. The annual costs of anti-diabetic medication were €83 million, i.e. 14% of total costs of DM-related treatments.
Hypoglycemia is one of these complications, often related to anti-diabetic drugs and possibly affecting patient compliance, quality-of-life, and treatment outcomes. Although most hypoglycemic events are not documented, some are severe, defined as events that need assistance of another person, and can be even fatal, although rarely. Anti-diabetic drugs are associated with various risks of hypoglycemia, thus current burden of hypoglycemia is determined mainly by drug use patterns, patients’ adherence, diet, and exercise. A review of the importance of hypoglycemia from the perspective of the clinical process (clinical inertia, patient’s adherence) and the list of possible causes and risk factors can be found, e.g. in AhrénCitation5. The expert-based cost-of-illness analysis conducted in the Czech Republic demonstrated how the cost of hypoglycemia changes with its severity: mean total costs of mild, moderate, and severe event amounted to €6.56, €127.66, and €893.51, respectivelyCitation6. Direct cost constituted the majority of overall cost (direct cost accounted for 76% of the overall cost for moderate SHEs, i.e. was 3-times larger than the indirect cost, and for 85.1% in case of severe SHEs). Indirect costs were estimated to amount only to €4.6 million (1.32%).
Assessing the cost of severe hypoglycemias (within the overall burden of diabetes) may be important due to various reasons. First, the intuition behind the actual severity of this condition may be misleading. Assessing the actual expenditures would provide a synthetic measure capturing the gravity of the problem. The total economic cost of hypoglycemia would combine various aspects: epidemiology, treatment schemes, resource usage, and unit costs; and would reduce this multi-faceted phenomenon to a single number. This could then be used to make international comparisons, in order, e.g. to try to make policies evaluations or discover the determinants. From the applied research perspective, the assessed costs of hypoglycemia can become an element of health technology assessment reports in diabetes. More and more cost-effectiveness studies already include hypoglycemia, often as its crucial elementCitation7–11. Finally, managing the cost of DM care is complicated, as the patterns of resource usage are very heterogeneous (see, e.g. van Dijk et al.Citation12). Understanding more fully how the cost of a single component can be measured may also help to refine the methodology of estimating the total burden of diabetes. In the literature there are some results on the estimated cost of hypoglycemia, for a review see e.g. FrierCitation13. We present a broad analysis for nine European countries, for most of which costs analysis has not been done.
We base our methodology on the inspiring approach presented by Jönsson et al.Citation14 for type 2 DM in Sweden, but we believe we make several important contributions (apart from applying it to both type 1 and type 2, T1 and T2 diabetes mellitus). First, in their study, Jönsson et al. assumed the rates of SHE based on only five studiesCitation15–19. We refined this assumption by using the results of a systematic review (SR) of observational studiesCitation20. We believe this adds credibility to the final values, and also using observational studies drives the estimated values closer towards reality. Second, we use the results of another SR in order to assess the structure of resource consumption for a single SHE (Jönsson et al. based their approach on a single study)Citation21. Third, we applied an identical analytical approach to nine European countries (however, the exact methods of data collection differ depending on the data availability), and this international scoping permits (i) between-countries comparisons; (ii) determination of main drivers that differentiate the overall SHE costs; and (iii) validation of the data collection process (if important discrepancies arise). Collecting information in parallel in several countries within a single modeling framework allows one to cross-validate the estimated values and obtain a warning signal should the data in any country differ substantially from those obtained in other countries.
Methods
General modeling framework
We include T1 and T2 DM patients. We used the SHE definition proposed by Jönsson et al.Citation14, as it directly relates to resource usage: an event of low plasma glucose level when a patient requires help from another person to manage. In order to determine the resource consumption more closely, we divide SHEs into three types: hospital-treated SHE (HT); medical professional treated (PT); and family (room-mate, passerby, etc.) treated (FT). They were defined as events requiring hospitalization, requiring assistance from a medical professional with no hospitalization, and requiring assistance from no medical professional only, respectively.
We aimed to calculate the direct medical costs from the public payer’s perspective and indirect costs (costs of lost productivity), presented separately. We decided to omit costs incurred by the patient in general, as they would consist mostly of buying a sugar or such, and so would be difficult to estimate and relate to SHE and would most likely contribute little to the overall cost. We still collected data on patient-perspective cost in some countries, and that confirmed our expectations: there was little or no cost for the patient in many countries. The patient perspective costs seemed to be more important only for Macedonia/the former Yugoslav Republic of MacedoniaFootnote†, due to high co-payment for medical services, and so were included in the analysis.
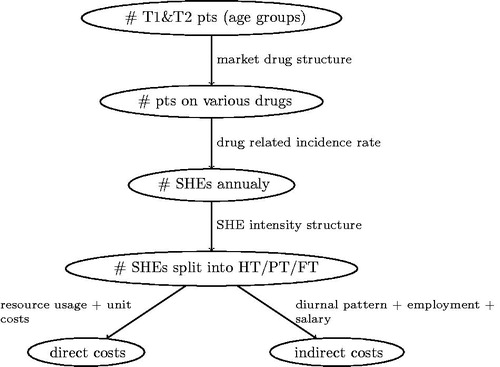
In order to estimate the final SHEs costs, several subsequent steps and type of data are used (cf. ). First, epidemiological data in each country dictate the number of patients and also the split between various age groups (important for indirect cost estimation). Then, treatment patterns structure (also country-specific, based mostly on data obtained from IMS Health) is used to calculate the total number of patients on various medications (more details below). Subsequently, applying the drug-varying SHE rate (identical for all the countries, based on the SR) allows one to estimate the total number of events. We then apply the structure of SHE levels of intensity (again, identical for all the countries, based on the SR) so as to split all the events into HT, PT, and FT. Using the country-specific information on resource usage for each type of SHE along with unit prices allows us to estimate the direct cost. In parallel, focusing on SHEs among people 20–64 years old (accounting for the workforce participation rate) allows us to measure the number of work-days lost and so the indirect cost. When estimating the public payer cost, we decided to neglect costs that were difficult to causally link to SHEs (e.g. costs generated by general practitioner, GP, visit on the next day after SHE, as it was unclear if the SHE was the only reason for the visit) or resources that are financed as a lump sum (like GP visits in some of the countries), and so do not contribute in marginal terms to the total cost. When assessing the indirect cost, we multiplied the estimated number of work-days lost by mean country-specific salary, correcting for a number of working days per month (assumed to amount to 21 for all the countries).
Figure 1. General modeling framework.
We used the medications groups so as to fit to data available from the previously published SRCitation20, i.e. in T1 DM: insulin pumps, basal-bolus insulin therapy with long-acting insulin analog as the basal component (BBA), basal-bolus insulin therapy with human insulin as the basal component (BBH), biphasic insulin analog, biphasic human insulin; and in T2 DM: sulfonylurea (SU) with or without other OADs and excluding insulin, other anti-diabetic medications (OADs excl. SU), basal long-acting insulin analog (BOTA), basal human insulin (BOTH), basal-bolus with long-acting insulin analog as the basal component (BBA), basal-bolus with human insulin as the basal component (BBH), biphasic insulin analog, biphasic human insulin (all insulin regimens could be in combination with oral drugs). We defined basal bolus insulin therapy as long acting insulin analog once or twice daily and short/ultrashort insulin at mealtimes (BBA).
Non-country-specific data
We used the results of a SR and meta-analysis estimating the annual rates of SHE related to various treatment regimensCitation20. We used the following treatment-related annual rates, i.e. average number of SHEs per one treated patient. In T1 DM, basal-bolus (basal insulin analog): 0.472, basal-bolus (basal human insulin): 1.084, insulin pump: 0.168, pre-mix insulin analog: 1.084, and pre-mix human insulin: 1.628. In T2 DM, BOT analog: 0.113, BOT human: 0.173, basal-bolus (basal insulin analog): 0.080, basal-bolus (basal human insulin): 0.554, pre-mix insulin analog: 0.092, pre-mix human insulin: 0.299, sulfonylureas: 0.045, OADs (excl. SU): 0.004.
We based the structure of SHE intensity (driving the resource consumption) on the results of another SR and meta-analysisCitation21. The SR was conducted in the Medline database and included studies evaluating the health resource consumption associated with SHEs split by type of resources. These studies were supposed to be performed in T1 or T2 DM patients and include at least 10 episodes of SH in total. The T1 and T2 DM data were estimated separately, but, due to small differences (and negligible accounting for estimation error) the joint results were used. Eventually, we assume that the structure of SHE episodes is as follows, HT: 9.97%, PT: 22.30%, and FT: 67.73%.
Based on the literature review, we assumed that FT SHE leads on average to the loss of 0.22 working daysCitation14,Citation22. In case of PT SHE, the work absenteeism was calculated based on the diurnal pattern of its occurrence. We assumed, based on Jönsson et al.Citation14 and Gold et al.Citation23, that 40% of PT SHEs happen between midnight and 8:00 AM (with a loss of 0.50 day of productivity), 16% happen between 8:00 AM and 1:00 PM (with a loss of 0.75 day of productivity), and 9% happens between 1:00 PM and 6:00 PM (with a loss of 0.25 day of productivity). The residual 35% happen between 6:00 PM and midnight (with no impact on work ability). The above assumptions result in an average loss of 0.34 day of productivity for a single PT SHE. HT SHE was associated with 6.6 days of hospital stayCitation14,Citation24 and a corresponding productivity loss.
Country-specific data
Country-specific data encompassed the epidemiology, treatment patterns, resource usage and unit prices, employment rate, and average salary. Below we present how these were calculated (and what was assumed in cases of a lack of data).
The epidemiology information in Bulgaria was extracted from the National Hospital Insurance Fund. The age structure is based on Borissova et al.’sCitation25 study and International Diabetes Federation dataCitation26,Citation27.
In Croatia all the information on epidemiology came from the reports issued by the Croatian National Diabetes Registry—CroDiab. This database is synchronized with the database of the Central Croatian health information system (CEZIH) and so can be treated as a valid and the most accurate data source for Croatia. The information on the number of treated and split between T1 and T2 DM came directly from the CroDiab. The split is further validated by the published epidemiological studiesCitation28–30. In order to obtain the breakdown between the age categories the general information on population age structure was used to add to CroDiab information, and so this split can only be treated as an approximation (most likely close).
In order to calculate parameters on epidemiology in the Czech Republic (incl. T1/T2 DM and age breakdown), the 15 official statistics from the Institute of Health Information and Statistics of the Czech Republic (UZIS) were usedCitation31.
The total number of diagnosed and treated T1 and T2 DM patients in Greece was calculated on the basis of Hellenic Statistical Authority, by applying the estimated prevalence of diabetes to the population in Greece at the beginning of 2014. The rates of T1 and T2 DM patients prevalence were based on the International Diabetes Federation dataCitation32. The age structure was derived from the systematic literature reviewCitation33 after consulting with experts.
Hungarian epidemiology data come from the real-world data analysis covering the National Health Insurance Fund Administration (NHIFA) data from 2013. The numbers of patients in respective age groups were approximated based on Hungarian data on different age groups derived from NHIFA.
Two epidemiological studies were used as data source for epidemiology assessment in PolandCitation34,Citation35. In addition, a panel of experts (professors of diabetology) was used to re-confirm epidemiological data.
In Slovenia the prescriptions database at the National Institute of Public Health of Republic of Slovenia (NIPHRS) was searched for the total number of patients who received at least one prescription for anti-hyperglycemic drug in 2011. That allowed us to estimate the total number of DM patients, but these data were further cross-validated with the Health Insurance Fund data. The age structure and therapy structure were obtained from the same source, with some elements (share of T1 within age groups) based on data from neighbouring Croatia (e.g. national registry). The split between T1 and T2 DM is an approximation done on the base of several assumptions about the share of patients with T1 diabetes, number of women with gestational diabetes, share of other types of diabetes, and shares of T1 and T2 patients in each of the age groups. Those assumptions are based on the interviews with prescribers and epidemiological data from neighbouring Croatia. Spanish epidemiology data were extracted from the National Institute of Statistics. The age structure for T2 DM is based on the Soriguer et al.Citation36 study. Incomplete data for epidemiology in the Czech Republic, Greece, Poland, and Spain were filled in with average values of four countries (Bulgaria, Croatia, Macedonia/the former Yugoslav Republic of Macedonia, and Slovenia), from where complete information was ensured. The overall epidemiology data are presented in .
Table 1. Number of diagnosed and treated type 1 and type 2 diabetes mellitus patients.
For defining shares of the pre-defined drug regimens in Bulgaria, the Doneva et al.Citation37 study was used. In Croatia, the Czech Republic, and Poland, shares of the pre-defined drug structure were calculated based on IMS Health data. The data for the Czech Republic were additionally compared to information from UZIS. Data concerning Greece were provided by conducting a survey among Greek specialists. Hungarian market share data came from the real world data analysis covering the NIHFA. For Slovenia the shares are approximations based on the comparison of two unpublished sources: data on drug consumption from IMS and data from NIPHRS on total number of patients who received at least one prescription for anti-hyperglycemic drug in 2011, split into pre-defined age groups and type of therapies. Spanish treatment pattern data is based on the Soriguer et al.Citation36 study, where missing values were filled in with appropriate average values of the other eight countries. Data of the market share of pre-defined drug regimens are presented in .
Table 2. Market share of pre-defined drug regimens (%) and annual SHE rate for every treatment pattern (episode per pt.).
For Bulgaria, resource usage was extracted from National Framework Contract data and appropriate unit prices were collected from National Framework Contract (NFC) 2014 data. The resource consumption in Croatia is based mostly on clinical expert opinions collected in an interview. The unit prices were taken from the price list and the codebookCitation38 and from a financial report of the national health insurer (HZZO) for 2011Citation39. In the Czech Republic, the local cost-of-illness study was used to provide all information on resource usageCitation6. So as to assign drug unit prices, the official list of reimbursed drugs by the State Institute of Drug Control was usedCitation40. Regarding the healthcare procedures, the unit prices were assigned on the basis of official information of the Czech Ministry of HealthCitation41.
For Macedonia/the former Yugoslav Republic of Macedonia resource use per category of SHEs was provided by survey conducted among specialists, diabetologists, working in diabetes centers, specialist endocrinologists at the clinic of endocrinology, and doctors at the emergency medical care. Unit costs were taken from the Ministry of Health tender price, Drug Bureau maximal prices pricelist, Health Insurance Fund service pricelist, and drug pricelist. In Greece, the resource usage and unit costs were assessed using a survey among hospitals and general practitioners. We used the survey results among clinical experts to decide about the resource use in Poland, and the official National Health Fund data, for unit pricesCitation42. In Slovenia, data for resources usage and costs were collected using analyses of hospitalization database and questionnaires sent to all healthcare centers with emergency medical services at primary level. The response rate was 23 out of 63 centers, serving 59% of the total Slovenian population. The data were estimated by the responsible contact people at the healthcare centers, while the estimation of parameters for FT SHEs did not seem possible.
Spanish resources costs are based on studies conducted in the countryCitation43–46, National Institute of Statistics, National Institute of Health, Health Center Carcaixent and Health Service of Castilla-La Mancha databases. Missing resources consumption data were filled in with adequate data achieved from Greece. Greece was found to be the most appropriate country as it is also a Mediterranean country with similar health expenditure in 2012 (Spain and Greece = 9.2% gross domestic product due to OECD dataCitation47 and Spain = 9.30%, Greece = 9.27% gross domestic product due to Eurostat dataCitation48). Resources usage is presented in , and costs per resources for each country in .
Table 3. Resources usage and quantity of units used per hospital, medical professional, and family treated SHE (% of cases, number of units used per patient).
Table 4. Resource unit prices for public payer (€).
We additionally used statistics on the employment rate in the age group between 20–64 (all based on Eurostat dataCitation49) and mean monthly earnings, Bulgaria: 63.5% and €412.00, Croatia: 57.0% and €710.38 (Croatian Bureau of StatisticsCitation50), the Czech Republic: 70.9% and €815.25 (form the International Monetary Fund, world Economic Outlook), Macedonia/the former Yugoslav Republic of Macedonia: 50.3% and €353.96 (from the Macedonia/the former Yugoslav Republic of Macedonia State Statistical Office), Greece: 52.9% and €1375 [from the Hellenic Statistical Authority—ELSTAT], Hungary: 66.7% and €783.05Citation52, Poland: 64.8% and €871.37Citation53, Slovenia: 68.4% and €1535.11Citation54, Spain: 59.9% and €1893.87Citation55, respectively. Currency exchange rates were correct for April 2015.
Results
Applying the treatment regimen structure (cf. ) to the number of diabetic patients (cf. ) and then accounting for the annual average number of SHEs for various therapies yields the following estimated expected total number of SHEs annually, Bulgaria: 56,327.0, Croatia: 16,746.3, the Czech Republic: 97,028.2, Macedonia/the former Yugoslav Republic of Macedonia: 6032.3, Greece: 40,453.1, Hungary: 106,311.6, Poland: 235,551.3, Slovenia: 8986.3, and Spain: 301,444.7. That means that, on average, a DM patient suffers for at least 0.077 (in Croatia), and at most 0.197 (in Hungary) SHE per year. Apparently, in Hungary drugs more related to hypoglycemia risk are used more frequently than in other countries (e.g. a large market share of BB with human basal and using SUs rather than OADs), and the opposite is the case in Croatia and Greece.
Basing on estimated resource usage (cf. ) and unit prices (cf. ) we can calculate the average cost of single SHE treatment, separately for HT, PT, and FT ones. The results are summarized in . The cost of HT SHE is the highest in Slovenia (€1175.78) and Spain (€1076.05) and the lowest in Bulgaria (€279.00). The cost of PT SHE is again clearly highest in two countries: Spain (€209.28) and Slovenia (€164.21), while in other countries the costs are between €22.25 (Macedonia/the former Yugoslav Republic of Macedonia) and €56.21 (Poland). The cost of a FT SHE was omitted altogether in Slovenia (it was not possible to either obtain data from existing databases or get the reliable data through the interviews with physicians), and in the remaining countries varied between €4.76 in Poland and €0.06 in Hungary. Using total annual costs, presenting expenses per one drug-treated DM patient was possible.
Table 5. Direct and overall societal costs per single SHE (€).
Indirect costs were calculated using the assumed structure of intensity of SHE and assumptions on the length of work absence, monthly salary, and employment rate. Therefore, the overall societal cost of a single SHE could be calculated by summing the mean direct and indirect cost. Results are shown in . The overall average societal cost of a single SHE was the lowest in Bulgaria (€42.36) and reached €193.83 in Spain.
Finally, country-specific overall societal costs of severe hypoglycemia were estimated by combining the information on the average annual number of SHEs and on the cost of a single event, the results are presented in . The highest, in absolute terms, severe hypoglycemia generated cost was found in Spain (€58,429,684.40), and the lowest in Macedonia/the former Yugoslav Republic of Macedonia (€379 951.25). In relative terms, expressing the overall cost per one drug-treated DM patient, the cost was found to be highest in Spain (€17.74) and Slovenia (€16.70) and to be lowest in Bulgaria (€5.47) and Macedonia/the former Yugoslav Republic of Macedonia (€5.61).
Table 6. Total costs of SHEs treatment in all countries (€).
Discussion
We estimated the total public-payer and patient direct medical and indirect (productivity loss) costs of severe hypoglycemia events in T1 DM and T2 DM patients in nine European countries. Our analysis included the differences between countries related to the structure of treatment schemes used, productivity data, and obviously resource usage and prices. Common elements encompassed the annual rates of SHEs for the analysed treatment schemes, structure of SHEs intensity, and impact of SHE on the lost days of work. The publication provides new insight into the cost of hypoglycemia in nine European countries, where (except for Spain) this kind of analysis was not conducted.
Hypoglycemia is only one of the DM complications but, comparing the results of the present study to the total costs of DMCitation56,Citation57, we see that it contributes to a non-negligible 1.3% of total medical and indirect DM cost in Poland, ∼0.9% of total costs in Hungary, and 0.6% in Spain.
Our results seem to be in line with other hypoglycemia cost analyses presented in the literature. Jönsson et al.Citation14, in 2006, came up with an average of €14 per patient with diabetes, while our results show that the cost varies between ca. €5.5 in Bulgaria and ca. €17.7 in Spain. Another study, conducted in Spain in 2010Citation58, concerns severe hypoglycemia costs in the same treatment patterns. The study revealed results separately for Type 1 and Type 2 diabetes: €33 and €57, €274 and €375, €1423 and €1404 for total costs of family/domestic, primary care, and hospital treatment respectively, which are similar (except for FT) to ours: €0.46, €209.28, and €1076.05, respectively. In the UK, the average financial burden of severe hypoglycemia event across treatment regiments, based on the 2013–2014 National Health Service tariffs, equates to £305 (ca. €438) for people aged ≤69 years, and £476 (ca. €685) for people aged ≥70. Concerning differences in prices and results in included countries, the study and our analysis, where appropriate costs vary between €42.36 and €193.83, results seem to be comparable.
Our analysis includes indirect costs, which are very important concerning hypoglycemia economic analysis. As we show, the indirect costs may constitute as much as 26.5% of total SHEs costs, so including those into the analysis seems important. There is, however, a limitation due to calculation of indirect costs in which we included only costs associated with absenteeism. That leaves another expenditure such as reduced productivity, possible early retirement, and reduction in quality-of-life not included, because of very complicated calculations. Therefore, the total costs may be even higher than presented. Quality-of-life of patients at risk of hypoglycemic episodes had lower scores on questionnaires (EQ-5D), when compared with asymptomatic patients (0.70 vs 0.77)Citation59, which may also result in an increase in complication frequency, leading to higher direct and indirect costs. Past SHEs also cause fear of hypoglycemiaCitation60, probably in part explaining the lowered quality-of-life, but also possibly diminishing compliance, resulting in DM progression and increased cost.
Other not included indirect costs are estimated in different papers. Williams et al.Citation61 show that experiencing hypoglycemic events is associated with 12.9% greater work impairment and ∼11.4% less work productivity, and consequently results in a 5-h decline in a 40-h week and costs $70.44 (€64.71) to $79.63 (€73.16) per week ($3663—$4141, €3365—€3804 per year)Citation62. Furthermore, Lundkvist et al.Citation59 found that 20% of patients who experienced hypoglycemia were in full- or part time employment in comparison to 31% of another DM patients; the study also shows that patients experiencing hypoglycemia events are less likely to be employed. In a result the calculated indirect expenses could be under-estimated because they do not include costs arising from the lack of employment opportunities.
Obviously, our study is subject to many limitations. The biggest problem we encountered was to obtain credible data on resource consumption for various types of SHE, and on the structure of various types of SHE. We had to, ultimately, refer to experts’ opinions collected via questionnaires. Even though individual experts have extensive experience in treating SHEs, at least three problems may arise. First of all, experts may have non-representative experience, as they, e.g., tend to encounter more difficult cases in their professional careers (they are employed in larger hospitals, etc.). Second, it has been shown that experts may find it difficult to correctly estimate average resource consumption, often thinking in terms of a typical patient, i.e. in terms of a mode rather than an average. Finally, by the very definition, experts do not treat family treated SHEs, which is of less importance due to the small absolute value of cost in this case.
Another limitation is that presented calculations are based on data collected in different years (availability of the data is limited resulting in inevitability of heterogeneity of information). Another limitation is that data collected in countries were not always complete, so it was necessary to supplement these with average calculations from other countries. When data for resource usage was not provided by Spain, these were filled in with data from Greece or with an average value of other countries.
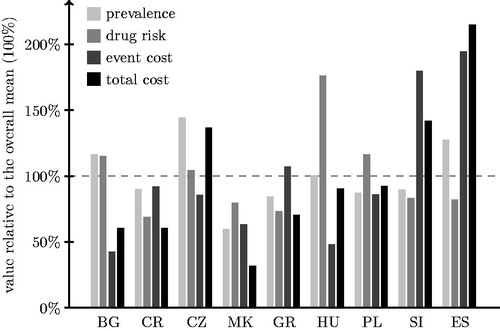
illustrates the between-countries variability, respectively, for prevalence of diabetes, SHE rate for an average patient, cost of a single SHE, and the average cost of SHE per capita (comparing the values for individual countries to the overall mean, expressed as 100%). Spain clearly stands out with respect to its total cost per capita (ca. 215% of common average), due to high DM prevalence (ca. 128% of common average), but mostly because of the cost of a single SHE (almost 195% of a common average). The cost of a single SHE is also high in Slovenia, leading to the substantial general per capita cost (this cost being mediated by below-average prevalence and risk per patient). The results for Slovenia and Spain seem to be reasonable looking at the differences in prices between European countries. Regarding the drug-related risk, it is noticeable that it seems to be smaller in Southern European countries (Croatia, Greece, and Macedonia/the former Yugoslav Republic of Macedonia) as compared to the Czech Republic, Hungary, and Poland (Bulgaria not fitting this pattern with greater risk). Interestingly, in spite of the substantial risk, the low cost of SHE treatment results in Hungarian overall cost to be close to the overall average.
Figure 2. Between-country comparison of costs and its components (BG = Bulgaria, CR = Croatia, CZ = the Czech Republic, MK = Macedonia/the former Yugoslav Republic of Macedonia, GR = Greece, HU = Hungary, PL = Poland, SI = Slovenia, ES = Spain).
We believe that the greatest limitation of our study is that we consider only one mechanism that induces SHE, i.e. treatment used, while omitting e.g. life style factors. As we make this assumption it’s only the drug structure that differentiates countries with respect to the estimated average number of SHEs. We believe that basing the estimates of SHE rates on observational studies somehow reduces the risk of systematic bias, nonetheless there is a possibility that we omit important country-specific factors.
Despite all the limitations we think our paper will bring a real contribution in awareness of hypoglycemia burden. The analysis shows that the burden might be limited, e.g. by regulating treatment patterns affecting SHE frequency. The analysis emphasizes the economic benefits of a proper DM treatment policy, as we can clearly see the differences in costs incurred by countries following different treatment schemes.
Conclusions
SHEs can present a substantial total cost for healthcare systems and society. This total amount differs between countries due to different DM treatment patterns used, different resource usage, and cost of treating hypoglycemia itself. Our cost estimates are consistent with those presented earlier in the literature, especially when one takes into account differences in prices between the countries. Data are scarce and many assumptions have to be used, but the consistency of final estimates is reassuring.
Transparency
Declaration of funding
The project was funded by Novo Nordisk.
Declaration of financial/other relationships
The authors declare that they have no competing interests. There is no specific organization that may in any way gain or lose financially from the publication of this manuscript. No ethical committee approval was required for the present study. JME peer reviewers on this manuscript have no relevant financial or other relationships to disclose.
Acknowledgments
The authors would like to acknowledge the following people: Thanos Chantzaras, Katalin Érsek, Roberta Montagnoli, Karel Rychna, Irina Ryzhenkova, Sanda Sandalj, Zsofia Tarjanyi and Vasil Valov for their helpful comments. Acknowledgments also go to Novo Nordisk, a sponsor of this project.
Notes
†So as to not engage in political disputes, we use this long, double name in the manuscript and MK for brevity in tables and figures.
References
- Hex N, Bartlett C, Wright D, et al. Estimating the current and future costs of Type 1 and Type 2 diabetes in the UK, including direct health costs and indirect societal and productivity costs. Diabet Med 2012;29:855-62
- Kanavos P, van den Aardweg S, Schurer W. Diabetes expenditure, burden of disease and management in 5 EU countries. LSE Health, London School of Economics, 2012. http://www.lse.ac.uk/LSEHealthAndSocialCare/research/LSEHealth/MTRG/LSEDiabetesReport26Jan2012.pdf. Accessed July 2013
- Šarić T, Benković V, Poljicanin T, et al. Cost of diabetes in Croatia. Impact of complications on the costs of type II diabetes. ISPOR 14th Annual European Congress Madrid, 2011: PDB31. http://www.ispor.org/congresses/Spain1111/Posters3.aspx. Accessed October 2012
- Vokó Z, Nagyjánosi L, Kaló Z. Direct health care costs of diabetes mellitus in Hungary. LAM 2009;19:775-80
- Ahrén B. Avoiding hypoglycemia: a key to success for glucose-lowering therapy in type 2 diabetes. Vasc Health Risk Manag 2013;9:155-63
- Kruntorádová K, Suchánková E, Klimeš J, et al. Costs of hypoglycaemia of diabetic patients: cost-of-illness study. Farmakoekonomika 2012;6:17-21
- Saunders R, Lian J, Karolicki B, et al. The cost-effectiveness and budget impact of stepwise addition of bolus insulin in the treatment of type 2 diabetes: evaluation of the FullSTEP trial. J Med Econ 2014;17:827-36
- Brown ST, Grima DG, Sauriol L. Cost-effectiveness of insulin glargine versus sitagliptin in insulin-naïve patients with type 2 diabetes mellitus. Clin Ther 2014;36:1576-87
- Evans M, Wolden M, Gundgaard J, et al. Cost-effectiveness of insulin degludec compared with insulin glargine in a basal-bolus regimen in patients with type 1 diabetes mellitus in the UK. J Med Econ 2015;18:56-68
- Kiadaliri AA, Gerdtham UG, Eliasson B, et al. Cost-utility analysis of glucagon-like Peptide-1 agonists compared with dipeptidyl peptidase-4 inhibitors or neutral protamine hagedorn Basal insulin as add-on to metformin in type 2 diabetes in Sweden. Diabetes Ther 2014;5:591-607
- Ly TT, Brnabic AJ, Eggleston A, et al. A cost-effectiveness analysis of sensor-augmented insulin pump therapy and automated insulin suspension versus standard pump therapy for hypoglycemic unaware patients with type 1 diabetes. Value Health 2014;17:561-9
- van Dijk CE, Hoekstra T, Verheij RA, et al. Type II diabetes patients in primary care: profiles of healthcare utilization obtained from observational data. BMC Health Serv Res 2013;13:7
- Frier BM. The economic cost of hypoglycaemia. Br J Diabetes Vasc Dis 2011;11(1 Suppl):S10-S12
- Jönsson L, Bolinder B, Lundkvist J. Cost of hypoglycemia in patients with Type 2 diabetes in Sweden. Value Health 2006;9:193-8
- Holstein A, Plaschke A, Egberts EH. Incidence and costs of severe hypoglycemia. Diabetes Care 2002;25:2109-10
- Leese GP, Wang J, Broomhall J, et al. Frequency of severe hypoglycemia requiring emergency treatment in type 1 and type 2 diabetes: a population-based study of health service resource use. Diabetes Care 2003;26:1176-80
- Miller CD, Phillips LS, Ziemer DC, et al. Hypoglycemia in patients with type 2 diabetes mellitus. Arch Intern Med 2001;161:1653-9
- UK Prospective Diabetes Study (UKPDS) Group. Intensive blood-glucose control with sulphonylureas or insulin compared with conventional treatment and risk of complications in patients with type 2 diabetes (UKPDS 33). UK Prospective Diabetes Study (UKPDS) Group. Lancet 1998;352:837-53.
- van Staa T, Abenhaim L, Monette J. Rates of hypoglycemia in users of sulfonylureas. J Clin Epidemiol 1997;50:735-41.
- Czech M, Rdzanek E, Pawęska J, et al. Drug-related risk of severe hypoglycaemia in observational studies: a systematic review and meta-analysis. BMC Endocr Disord 2015;15:57
- Jakubczyk M, Rdzanek E, Niewada M, et al. Economic resources consumption structure in severe hypoglycemia episodes: a systematic review and meta-analysis. Expert Rev Pharmacoecon Outcomes Res 2015;15:813-22
- Nordfeldt S, Jonsson D. Short-term effects of severe hypoglycaemia in children and adolescents with type 1 diabetes. A cost-of-illness study. Acta Paediatr 2001;90:137-42
- Gold AE, MacLeod KM, Frier BM. Frequency of severe hypoglycemia in patients with type I diabetes with impaired awareness of hypoglycemia. Diabetes Care 1994;17:697-703
- Allicar MP, Mégas F, Houzard S, et al. Frequency and costs of hospital stays for hypoglycemia in France in 1995. Presse Med 2000;29:657-61
- Borissova AM, Shinkov A, Vlahov J, et al. Prevalence of diabetes mellitus and prediabetes in Bulgaria Today. J Bulgarian Soc Endocrinol 2012;4. http://endo-bg.com/node/741. Accessed July 2007
- IDF Diabetes Atlas Fourth Edition. International Diabetes Federation, 2009. https://www.idf.org/sites/default/files/IDF-Diabetes-Atlas-4th-edition.pdf Accessed October 2014
- IDF Diabetes Atlas 5th Edition. International Diabetes Federation, 2011. https://www.idf.org/sites/default/files/EN_6E_Atlas_Full_0.pdf. Accessed October 2014
- Metelko Z, Pavlić-Renar I, Poljicanin T, et al. Prevalence of diabetes mellitus in Croatia. Diabetes Res Clin Pract 2008;81:263-7
- Poljicanin T, Pavlić-Renar I, Metelko Z. CroDiab NET-electronic diabetes registry. Acta Med Croatica 2005;59:185-9
- HZJZ. Croatian Health Service Yearbook, 2011. Zagreb: Croatian National Institute Of Public Health, 2012
- Ústav zdravotnických informací a statistiky ČR (Institute of Health Information and Statistics of the Czech Republic). http://www.uzic.cz. Accessed October 2012
- International Diabetes Federation. IDF Diabetes Atlas. Brussels, Belgium: International Diabetes Federation, 2013. http://www.idf.org/diabetesatlas. Accessed October 2014
- Rombopoulos G, Hatzikou M, Latsou D, et al. The prevalence of hypoglycemia and its impact on the quality of life (QoL) of type 2 diabetes mellitus patients (The HYPO Study). Hormones (Athens) 2013;12:550-8
- Jankowski M, Bała MM, Płaczkiewicz-Jankowska E, et al. Specialty outpatient care of diabetic patients in Poland-are we far from treatment targets? Rationale, design, and preliminary results of the OPTIMO study. Pol Arch Med Wewn 2011;121:375-8
- Wittek A, Sokalski B, Grzeszczak W, et al. Prevalence of diabetes and cardiovascular risk factors of industrial area in southern Poland. Exp Clin Endocrinol Diabetes 2009;117:350-3
- Soriguer F, Goday A, Bosch-Comas A, et al. Prevalence of diabetes mellitus and impaired glucose regulation in Spain: the Diabetes Study. Diabetologia 2012;55:88-93.
- Doneva M, Valov V, Borisova AM, et al. Comparative analysis of the cost of insulin treated patients in Bulgaria. Biotechnol Biotec Eq 2013;27:3748-52
- Croatian Health Insurance Fund. Health services price list and codebook. http://www.hzzo-net.hr/04_01_08.php. Accessed October 2012
- Business Report of Croatian Health Insurance Fund for 2011. Zagreb: Croatian Health Insurance Fund, 2012
- Státni ústav pro kontrolu léčiv (State Institute for Drug Control). http://www.sukl.eu. Accessed November 2013
- “Public Note of the Czech Ministry of Health no.134/1998, Coll.ofActs,” and “Public Note of the Czech Ministry of Health no.396/2010, Coll. Of Acts,” Ministerstvo Zdravotnictví České Republiky (Ministry of Health of the Czech Republic). http://www.mzcr.cz. Accessed November 2013
- National Health Found. 2013 Contract Guide. http://www.nfz.gov.pl/new/index.php. Accessed January 2013
- Antoñanzas F, Brenes F, Molero JM, et al. Cost-effectiveness of the combination therapy of dutasteride and tamsulosin in the treatment of benign prostatic hyperlasia in Spain. Actas Urol Esp 2011;35:65-71
- Hammer M, Lammert M, Mejías SM, et al. Costs of managing severe hypoglycaemia in three European countries. J Med Econ 2009;12:281-90
- Cots F, Raventòs J, Ausín P, et al. The day hospital: analysis of results, costs and management of pneumology resources. Arch Bronconeumol 2013;49:54-62
- Oliva J, Lobo F, Begoña M, et al. Estudio de los costes directos sanitarios de los pacientes con diabetes mellitus en España. XXIII Jornadas de la Asociación de Economía de la Salud 2003
- OECD. Health expenditure since, 2000. http://stats.oecd.org/. Accessed May 2015
- Eurostat. Health care expenditure by function. http://appsso.eurostat.ec.europa.eu/nui/show.do?dataset=hlth_sha_hc&lang=en. Accessed May 2015
- Eurostat. Employment rate by gender, age group 20-64. http://epp.eurostat.ec.europa.eu/tgm/table.do?tab=table&init =1&plugin =1&language=en&pcode=t2020_10 (2012). Accessed December 2012
- Croatian Bureau of Statistics. http://www.dzs.hr/. Accessed October 2012
- Český Statistický Úřad (Czech Statistical Office). http://www.czso.cz. Accessed October 2012
- Hungarian Central Statistical Office (HCSO). https://www.ksh.hu/docs/hun/xftp/gyor/let/let21412.pdf. Accessed October 2012
- Główny Urząd Statystyczny (Central Statistical Office of Poland). http://stat.gov.pl. Accessed September 2012
- Statistični Urad Republike Slovenije (Statistical Office of the Republic of Slovenia). http://www.stat.si. Accessed October 2012
- Instituto Nacional de Estadística. http://ine.es. Accessed May 2015
- Leśniowska J, Schubert A, Wojna M, et al. Costs of diabetes and its complications in Poland. Eur J Health Econ 2014;15:653-60
- Vokó Z, Nagyjánosi L, Kaló Z. Direct health care costs of diabetes mellitus in Hungary. LAM 2009;19:775-80
- Lopez-Bastida J, Boronat M, Moreno JO, et al. Costs, outcomes and challenges for diabetes care in Spain. Global Health 2013;9:17
- Lundkvist J, Berne C, Bolinder B, et al. The economic and quality of life impact of hypoglycemia. Eur J Health Econ 2005;6:197-202
- Shi L, Shao H, Zhao Y, et al. Is hypoglycemia fear independently associated with health-related quality of life? Health and quality of life outcomes 2014;12:167
- Williams S, Pollack M, Bolge S, et al. The effects of hypoglycemia on work and life productivity among patients with type 2 diabetes mellitus (T2DM) using oral antidiabetic agents (OADs). American Diabetes Association. 69th Scientific Sessions 2009. Abstract number: 1220-P.
- Zhang Y, Wieffer H, Modha R, et al. The burden of hypoglycemia in type 2 diabetes: a systematic review of patient and economic perspectives. JCOM Journal 2010;12:547-557.