
Abstract
Background: Calcineurin inhibitors (CNIs) represent the cornerstone of immunosuppressive therapy after liver transplantation. A recent network meta-analysis (NMA) evaluated the relative efficacy of CNIs ciclosporin, prolonged-release (PR) tacrolimus, and immediate-release (IR) tacrolimus in adult liver transplant recipients based on randomized and large observational trials published since 2000. Based on the NMA findings, the present study evaluated the cost-utility of PR tacrolimus relative to ciclosporin or IR tacrolimus in liver transplant recipients in the UK.
Methods: A Markov model was developed to evaluate the cost-utility of immunosuppressive regimens in liver transplant recipients, capturing costs associated with immunosuppression, retransplantation, acute rejection (AR), and cytomegalovirus infection. Mortality, graft loss, and AR odds ratios were derived from the NMA. Costs were taken from the British National Formulary and the NHS National Tariff and expressed in 2016 pounds sterling. Future costs and effects were discounted at 3.5% annually.
Results: Over 25 years, PR tacrolimus resulted in increased life expectancy and quality-adjusted life expectancy (QALE) relative to IR tacrolimus and ciclosporin. Relative to ciclosporin, QALE increased by 1.17 quality-adjusted life years (QALYs) with PR tacrolimus while costs increased by GBP £4645, yielding an incremental cost-effectiveness ratio (ICER) of £3962 per QALY gained. Relative to IR tacrolimus, QALE increased by 0.78 QALYs and costs by £1474, resulting in an ICER of £1889 per QALY gained. Sensitivity analysis showed the analysis to be most sensitive to dosing assumptions.
Conclusions: Based on a UK-specific analysis of the projected cost-utility of PR tacrolimus relative to IR tacrolimus and ciclosporin, PR tacrolimus was cost-effective, improving life expectancy and QALE relative to both IR tacrolimus and ciclosporin, yielding ICERs below £20 000 per QALY gained. The main limitations of the study were data source heterogeneity and omitting the economic and clinical effects of treating aspects of recurrent liver disease.
Background
Since the publication of the first randomized controlled trials of tacrolimus and ciclosporin for immunosuppression after liver transplant in 1994, there have been numerous advances in operative and post-operative treatment that have resulted in improved graft and patient survival. These advances include improved waiting list prioritization, donor-recipient matching, and concomitant immunosuppressive medicationsCitation1–3. Tacrolimus and ciclosporin (CsA), the calcineurin inhibitors that form the foundation of modern immunosuppressive therapy in liver transplant recipients, have also been reformulated since 1994. Specifically, CsA was reformulated into a microemulsion (Neoral, Novartis, Basel, Switzerland) and, subsequently, tacrolimus has been reformulated into a once-daily, prolonged-release (PR) formulation (Advagraf, Astellas Pharma Inc., Tokyo, Japan) from the twice-daily, immediate-release (IR) formulation (Prograf, Astellas Pharma Inc., Tokyo, Japan)Citation4–7.
Since the launch of PR tacrolimus, a single comparative randomized controlled trial (RCT) has been published comparing PR tacrolimus with IR tacrolimusCitation8. The primary, non-inferiority end-point of biopsy-confirmed acute rejection at 24 weeks was met based on the pre-specified margin of 15% and the 12-month open-label extension period showed comparable efficacy failure rates, no significant difference in renal function and comparable Kaplan-Meier-estimated patient and graft survivalCitation8. More recently, a retrospective analysis of longer-term routine clinical practice data from IR and PR tacrolimus-treated patients in the European Liver Transplant Registry (ELTR) has been conductedCitation9. The 3-year analysis of the full modified intent-to-treat cohort has shown significant improvements in graft survival with PR tacrolimus over IR tacrolimus and a propensity-score matched analysis has shown significant improvements in both graft and patient survival at 3 years. The emergence of these data underpinned the rationale for a recent systematic literature review and network meta-analysis (NMA) of the two tacrolimus formulations and ciclosporinCitation10. The NMA used modern hierarchical Bayesian techniques to integrate data from RCTs and large observational studies (including the recent ELTR analysis) to estimate the relative efficacy of ciclosporin, and PR and IR tacrolimus, adjusting for study arm-level confounders.
As of 2014, there were ∼8300 patients with a functioning liver transplant in the UK Transplant Registry, up from 7600 in 2009Citation11. With the growing population of liver transplant recipients, it is important to evaluate the economics of immunosuppression in this patient group when new data become available. The aim of the present analysis was, therefore, to evaluate the incremental costs and quality-adjusted life expectancy associated with the use of PR tacrolimus relative to IR tacrolimus and ciclosporin in adult liver transplant recipients in the UK setting.
Methods
Model
A three-state Markov model was developed in Microsoft Excel (Microsoft Corporation, Redmond, WA) to project cost and utility outcomes in de novo adult liver transplant recipients using ciclosporin, PR, or IR tacrolimus as the primary immunosuppressive regimen in the UK setting (). The Markov health states were alive with first transplant, alive after retransplantation, and dead. No states were included to capture recurrence of conditions for which liver transplant was indicated, such as hepatocellular carcinoma (HCC) and hepatitis C (HCV). Acute rejection (AR) was captured in the model, but was applied within each health state using a base rate from the twice-daily tacrolimus arm of the Trunečka et al.Citation8 RCT (37.4% in year 1) and per-treatment odds ratios from the NMACitation10. AR was only modeled in the first year of the analysis, and rates were not assumed to differ between the first transplant and retransplantation states. A proportion of patients experiencing AR were assumed to experience treatment-refractory rejection, in line with the findings of the largest RCT of ciclosporin and tacrolimus included in the meta-analysisCitation12. Specifically, patients in the ciclosporin arm experiencing any rejection were assumed to experience treatment-refractory rejection in 6.7% of cases (based on 12 treatment-refractory events in 179 patients experiencing any clinically significant rejection), compared to 4.2% of cases (based on six treatment-refractory events in 143 patients experiencing any clinically significant rejection) in patients receiving PR or IR tacrolimus.
Figure 1. Cost-utility model Markov states and possible transitions.
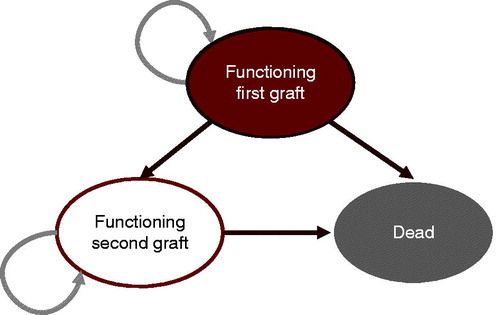
Underlying patient survival rates were based on a Kaplan-Meier analysis of 10 years of follow-up data from 1234 adult recipients of a first liver transplant in the UK performed between 2000–2002Citation11. A rational model (i.e. a ratio of two polynomials) was fitted to the National Health Service Blood and Transplant (NHSBT) data to extrapolate from the 10-year NHSBT data to the full model time horizon of 25 years. Underlying rates of retransplantation were based on a 2010 study by Marudanayagam et al.Citation13, in which 58 retransplants were carried out in 765 primary transplant patients between 2002–2007 (7.6% over 5 years). Differences between treatments in terms of mortality, graft failure, and incidence of acute rejection were applied based on the odds ratios reported in the NMA (). Re-transplantation was assumed to account for the difference between patient mortality and graft failure.
Table 1. Odds ratios from the network meta-analysis.
In the base case analysis, data from the summaries of product characteristics (SPC) were used to establish the initial doses of IR and PR tacrolimus, both of which were taken to be the mid-point of the SPC-recommended starting dose range of 0.10–0.20 mg/kg/day. The initial dose was maintained for 1 month, after which the dose of both tacrolimus formulations was tapered linearly over the remainder of year 1 to match the end-of-study IR tacrolimus dose (0.058 mg/kg/day) from the Trunečka et al.Citation8 RCT. For the purposes of dose calculation, mean patient bodyweight was taken to be 77.2 kg (standard deviation = 16.2 kg) based on the weighted average from the arms of the Trunečka et al. RCT. Mean doses for ciclosporin were taken from the British National Formulary, specifically applying the mid-point of the post-operative dose recommendation (12.5 mg/kg/day) for the first month followed by a linear taper over the remainder of the first year to the mid-point of the recommended maintenance dose (4 mg/kg/day) in all subsequent years. Costs of adjunct immunosuppressive medications included corticosteroid dosing in line with the mid-point recommended doses in Trunečka et al., and doses of mycophenolate mofetil in line with non-interventional multi-center data published by Schlitt et al.Citation14 in which patients were initiated on an average dose of 1.46 g/day decreasing to 1.2 g/day by the end of month 12. All patients were assumed to receive two doses of 20 mg basiliximab at the time of transplantation, in line with the doses reported in the liver studies included in the European Public Assessment Report for basiliximabCitation15. Use of mechanistic target of rapamycin (mTOR) inhibitors was not captured in the analysis on the grounds that only a small proportion of patients in the studies driving the NMA were prescribed an mTOR inhibitor. For instance, Levy et al.Citation16 published the findings of the second largest of the 12 RCTs included in the NMA in 2006, reporting that only 2% and 0.5% of patients in the cicsloporin and tacrolimus IR arms, respectively, were ultimately prescribed sirolimus. Similarly, in the 24-month post-study period following the largest RCT in the NMA (O’Grady et al.Citation12), sirolimus had only been introduced in three patients (0.6%) of the 483 eligible for the follow-up study.
Costs of cytomegalovirus (CMV) infection were also captured in the model, based on an assumed infection rate of 17.9%, independent of immunosuppressive regimen, as reported by Weigand et al.Citation17. Patients with CMV infection were assumed to receive 900 mg/day of oral valganciclovir for 45 days based on the British Transplantation Society Guidelines for the Prevention and Management of CMV Disease after Solid Organ Transplantation, which recommend a minimum of 14 days treatment followed by 1–3 months of prophylaxis to minimize risk of recurrenceCitation18.
Unit costs
Drug costs were taken from the April 2016 British National Formulary (BNF) and the mean cost of liver re-transplantation was assumed to be 1.83-times more expensive than first liver transplant based on the overall retransplant cost ratio reported by Azoulay et al.Citation19 in a single-center study of 1038 first liver transplants and 139 re-transplants (). Costs of treatment refractory acute rejection were based on 10 days of immunoglobulin therapy at 1.5 mg/kg/day, while responsive acute rejection was assumed to be treated by 3 days of intravenous methylprednisolone at 250 mg/day.
Table 2. Unit costs in 2016 pounds sterling.
Perspective, time horizon, and discounting
The base case analysis was performed over a 25-year time horizon to capture the full effectiveness differences between the respective treatments and for consistency with another recent cost-utility analysis of immunosuppressive regimens after solid organ transplantationCitation20. Cost and utility outcomes were measured from the perspective of the UK healthcare payer and future costs and effects were discounted at 3.5% per annum in the base case analysis. Sensitivity analyses were performed with a 1.5% annual discount rate for both costs and effects in line with guidance from the National Institute for Health and Care Excellence (NICE)Citation21. All costs were reported in 2016 pounds sterling (GBP).
Health-related quality-of-life utilities
Health-related quality-of-life (HRQoL) utilities for the two living health states were taken from a 2002 UK-specific study in which a EuroQol 5D (EQ-5D) tariff value was elicited from an initial group of 542 liver transplant recipientsCitation22. For the first year of the base case analysis, the model used the 6-month post-transplant mean EQ-5D tariff value of 0.69. For subsequent years, the 24-month post-transplant value of 0.76 was used as the HRQoL point estimate, sampled based on the 95% confidence interval of 0.73–0.79. Post-re-transplantation quality-of-life was assumed to be associated with the same HRQoL score as the first liver transplant based on research from Aberg et al.Citation23, who reported that, in a Swedish population of liver transplant recipients, age- and gender-adjusted analyses showed that survival time and retransplantation did not significantly affect HRQoL.
Sensitivity analysis
All simulations were conducted using probabilistic sensitivity analysis in which key model parameters were sampled to capture the uncertainty around model inputs. Notable parameters sampled included patient bodyweight, which was sampled from a normal distribution, health-related quality-of-life estimates, sampled from a normal distribution, and the NMA-derived odds ratios, which were sampled from log-normal distributions. Additionally, a series of one-way sensitivity analyses were conducted to characterize the degree to which model outcomes were affected by individual input parameters. Sensitivity analyses were conducted around the discount rate, with the annual cost and utility discount rates simultaneously set to 0% and 1.5%, in line with NICE guidanceCitation17. The duration of the effect of the graft loss and mortality odds ratios from the meta-analysis were varied from the base case value of 3 years down to 1 year and up to 5 years. Numerous analyses were conducted around the dosing of ciclosporin and tacrolimus: initial doses (in year 1) were set to the upper and lower ends of the ranges specified in the SPC and BNF, and the maintenance dose was set to the end-of-study doses reported in the landmark 2006 randomized controlled trial by Levy et al.Citation16 (specifically 3 mg/kg/day for ciclosporin and 0.05 mg/kg/day for both tacrolimus formulations). Finally, the underlying mortality rate projection approach was switched from the rational model employed in the base case to a logistic fit to the same data points.
Results
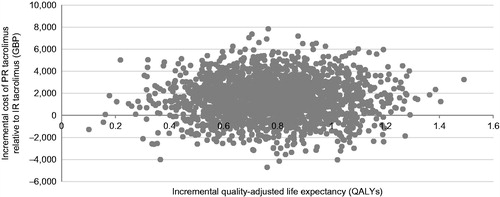
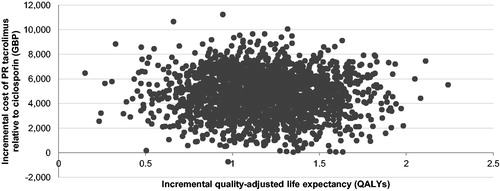
The base case analysis, run over a 25-year time horizon, showed that PR tacrolimus was associated with increased life expectancy relative to IR tacrolimus and ciclosporin. Specifically, PR tacrolimus increased life expectancy by 1.03 years and 1.54 years relative to IR tacrolimus and ciclosporin, respectively. Quality-adjusted life expectancy with PR tacrolimus also increased by 0.78 quality-adjusted life years (QALYs) and 1.17 QALYs relative to IR tacrolimus and ciclosporin, resulting in ICERs of GBP 1889 and GBP 3962 per QALY gained, respectively. The incremental costs and quality-adjusted life expectancy were plotted on a cost-effectiveness plane for each of 2000 model iterations. In the comparison with IR tacrolimus, 19.8% of points fell in the lower right-hand quadrant of the cost-effectiveness plane, indicating increased effectiveness with lower costs (i.e. a dominant outcome; ). In the PR tacrolimus comparison with ciclosporin, 99.9% of points fell in the upper right hand quadrant (). Cost-effectiveness acceptability curves were then drawn over a range of willingness-to-pay thresholds based on the data from the scatterplots (). The acceptability curves showed that there was 99.9% and 99.8% probability of PR tacrolimus being cost-effective relative to IR tacrolimus and ciclosporin, respectively, at a willingness-to-pay threshold of GBP 20,000 per QALY gained.
Figure 2. Cost-effectiveness acceptability curves.
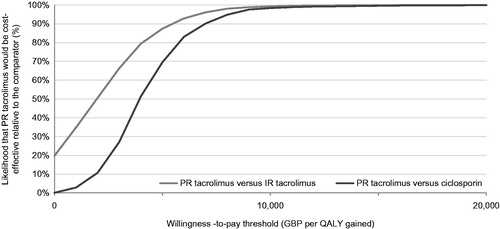
Figure 3. Survival projections over time in each arm of the cost-utility analysis.
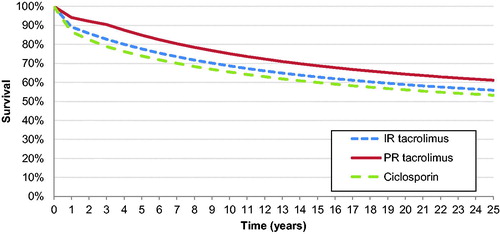
Figure 4. Cost-effectiveness scatterplot for PR tacrolimus relative to IR tacrolimus. No analyses resulted in reduced quality-adjusted life expectancy. Only the right-hand scatterplot quadrants are, therefore, illustrated.
Survival projections based on the rational model are shown in . The rational model fit to the NHSBT mortality data resulted in a correlation coefficient (R2) of 0.999. The logistic model employed in the sensitivity analyses to fit to the same data points yielded an R2 value of 0.984.
Figure 5. Cost-effectiveness scatterplot for PR tacrolimus relative to ciclosporin. No analyses resulted in reduced quality-adjusted life expectancy. Only the right-hand scatterplot quadrants are, therefore, illustrated.
Findings of one-way sensitivity analyses for the comparisons of PR tacrolimus with IR tacrolimus and ciclosporin ( and , respectively) showed that the analyses were broadly insensitive to changes in individual model parameters. The most notable outcome was the application of the NMA mortality odds ratios for only a single year in the comparison of PR tacrolimus with IR tacrolimus, resulting in PR tacrolimus dominating IR tacrolimus, reducing costs by GBP 320, and increasing quality-adjusted life expectancy by 0.48 QALYs. Changing the maintenance dose of PR tacrolimus to the end-of-study dose from the Trunečka et al.Citation8 study also had a substantial effect on outcomes, increasing ICERs to GBP 11 936 and GBP 10 650 per QALY gained for PR tacrolimus relative to IR tacrolimus and ciclospoin, respectively.
Table 3. One-way sensitivity analysis results for PR vs IR tacrolimus.
Table 4. One-way sensitivity analysis results for PR tacrolimus vs ciclosporin.
Discussion
The present study showed that PR tacrolimus would be expected to be associated with increased life expectancy and quality-adjusted life expectancy relative to both IR tacrolimus and ciclosporin. The increase in quality-adjusted life expectancy was accompanied by an increase in costs of GBP 1889 relative to IR tacrolimus and GBP 3962 relative to ciclosporin, resulting in ICERs far below the commonly-quoted willingness-to-pay threshold of GBP 20 000 in the UK setting.
As with any modeling analysis, particularly those projecting long-term clinical outcomes, the present study has a number of limitations that should be acknowledged when interpreting the findings. The most important limitation of the present study was the use of heterogenous data sources for the dosing data and data affecting the modeled clinical end-points. Sensitivity analyses showed that the assumed dosing of immunosuppression over time is a substantial driver of model outcomes. Until longitudinal data on immunosuppressive dosing become available, long-term dose modeling will continue to be a challenge in health economic analyses of immunosuppressive agents. Relatedly, the model did not capture treatment discontinuations or switching over time. This approach is in line with the recent economic model of post-transplant immunosuppression in adult renal transplant recipients published by NICE as part of an update to the original technology appraisal analysis published in 2005Citation24,Citation25. This is unlikely to represent the clinical reality, in which patients may be switched between maintenance agents in the event of efficacy failure or adverse eventsCitation24. However, we note that the largest RCT included in the NMA (which enrolled 606 patients in total) also had a 24-month post-study follow-up including 483 patients eligible from the original trial, in which six patients (2.4%) switched from tacrolimus to ciclosporin and 17 (7.3%) patients switched from ciclosporin to tacrolimus. Withdrawals due to treatment failure in the study period were 13/301 (4.3%) with tacrolimus and 27/305 (8.9%) with ciclosporin, in addition to treatment failures for immunological reasons (which formed part of the primary endpoint) in 6/301 (2.0%) and 12/305 (3.9%) in the tacrolimus and ciclosporin arms, respectively. These data would suggest that treatment switching is less common after the first year post-transplant, which partially mitigates concerns around the omission of switching from the model.
The model structure used for the present analysis was designed specifically for the purposes of modeling cost-utility in non-recurrent indications for liver transplant. Given the wide range of indications for liver transplant such as viral infection; cholestatic, metabolic, and biliary diseases; HCC and sequelae of Budd-Chiara syndrome, developing a single model to realistically capture the various treatment modalities and algorithms for each condition was considered implausible. Not only would such a complex model obscure the underlying research question, it could also skew the analysis as a result of the higher costs and, in many cases, lower quality-of-life in patients with recurrent indications. However, the analysis should still be considered with this caveat in mind; the results are unlikely to be applicable to patients with HCV or HCC. Analysis of data from the ELTR shows that recurrence of the initial disease is responsible for 20% of all deaths after liver transplant (11% due to tumor recurrence, the remaining 9% due to recurrence of disease)Citation26. Concerns around the exclusion of HCV should be alleviated by the approval of the second-generation direct-acting antivirals (DAAs), in particular the combinations of the pan-genotypic ledipasvir/sofosbuvir and ombitasvir/dasabuvir/paritaprevir/ritonavir, as well as several new regimens currently in phase III development. Together, these have increased sustained virologic response rates to >95%, with rates of 100% reported in several sub-groupsCitation27,Citation28. Moreover, the availability of DAAs from different drug classes allows the few patients who fail initial treatment to be retreated and means that HCV is now largely regarded as a curable disease.
One related limitation that should be considered when interpreting the findings presented is the exclusion of surgical complications and other factors known to be affected by use of immunosuppression, such as hypertension, new onset diabetes after transplantation, and renal dysfunction. The NMA, which provided the odds ratios used to differentiate between immunosuppressive regimens in terms of acute rejection and graft loss had insufficient data on PR tacrolimus in liver transplant recipients to provide informative estimates of the relative odds of these complications and adverse events across the three included regimens.
Another notable limitation of the analysis centers on the modeling of re-transplantation. The cost estimate for liver re-transplantation was based on a ratio of costs from a single center study and, while the size of the population analyzed was relatively large (n = 1177), center-specific practices, and protocols may have affected the cost estimates presented, and the final cost estimate may not be applicable to other centers. Furthermore, re-transplantation presents unique challenges in health economic modeling as the incidence is contingent not only on failure of the existing graft, but also on myriad other factors, including organ availability and center-specific ethical considerations such as outcomes-based vs urgency-based approaches to re-transplant prioritizationCitation29.
Finally, the mortality projections over 25 years may not reflect the clinical reality. Long-term data on survival in liver transplant recipients are scarce and, where available, necessarily include patients who were transplanted several years or even decades ago, forcing a trade-off to be made between data duration and recency. In the present base case analysis, the base mortality rate was derived from 10-year follow-up in a UK cohort transplanted in 2000–2002. Switching to using more recent (2002–2005) cohort data from the same source had a minimal effect on outcomes, fractionally reducing the ICER for the comparison with IR tacrolimus while increasing the ICER for the ciclosporin comparison. Switching to a logistic model derived from the same data as used in the base case analysis similarly reduced the ICER in the IR tacrolimus comparison while increasing it in the ciclosporin comparison. None of the changes to the underlying mortality assumptions changed the conclusion of cost-effectiveness.
Conclusions
Based on a long-term modeling analysis of three immunosuppressive agents in liver transplant recipients transplanted for non-recurrent conditions in the UK, ciclosporin would be anticipated to be both the cheapest and least effective immunosuppressive regimen of the agents investigated. Additional expenditure of GBP 3962 per patient on PR tacrolimus was projected to result in a substantial improvement in quality-adjusted life expectancy of 1.17 QALYs over 25 years, representing good value for money from the perspective of the UK healthcare payer.
Transparency
Declaration of funding
This study was supported by funding from Astellas Pharma Europe Limited.
Declaration of financial/other relationships
RFP is a full-time employee of Ossian Health Economics and Communications GmbH, which received consultancy fees from Astellas Pharma Europe Limited to conduct the analysis and prepare the manuscript. GM and IO are full-time employees of Astellas Pharma Euope Limited, which manufactures immediate-release and prolonged-release tacrolimus. Astellas Pharma Euope Limited is providing the funding for the article processing charge. JME peer reviewers on this manuscript have no relevant financial or other relationships to disclose.
| Abbreviations | ||
| AR | = | acute rejection |
| BNF | = | British National Formulary |
| CsA | = | ciclosporin A |
| DAA | = | direct-acting antiviral |
| ELTR | = | European Liver Transplant Registry |
| GBP | = | 2016 pounds sterling |
| HCC | = | hepatocellular carcinoma |
| HCV | = | hepatits C virus |
| HRQoL | = | health-related quality-of-life |
| ICER | = | incremental cost-effectiveness ratio |
| IR | = | immediate release |
| NHS | = | National Health Service |
| NHSBT | = | National Health Service Blood and Transplant |
| NICE | = | National Institute for Health and Care Excellence |
| NMA | = | network meta-analysis |
| PR | = | prolonged-release |
| QALE | = | quality-adjusted life expectancy |
| QALYs | = | quality-adjusted life years |
| RCT | = | randomized controlled trial |
| SPC | = | summary of product characteristics |
Acknowledgements
RFP developed the cost-utility model, ran the analyses, and drafted the manuscript. GM formulated the research question, reviewed the model, and provided critical revisions to the manuscript. IO reviewed and provided critical revisions to the manuscript.
References
- Wiesner RH, Fung JJ. Present state of immunosuppressive therapy in liver transplant recipients. Liver Transpl 2011;17(3 Suppl):S1-S9
- Fink MA, Angus PW, Gow PJ, et al. Liver transplant recipient selection: MELD vs. clinical judgment. Liver Transpl 2005;11:621-6
- Akkina SK, Asrani SK, Peng Y, et al. Development of organ-specific donor risk indices. Liver Transpl. 2012;18:395-404
- European FK506 Multicentre Liver Study Group. Randomised trial comparing tacrolimus (FK506) and cyclosporin in prevention of liver allograft rejection. Lancet 1994;344:423-8
- The US Multicentre FK506 Study Group. A comparison of tacrolimus (FK 506) and cyclosporine for immunosuppression in liver transplantation. N Engl J Med 1994;331:1110-15
- Otto MG, Mayer AD, Clavien PA, et al. Randomized trial of cyclosporine microemulsion (neoral) versus conventional cyclosporine in liver transplantation: MILTON study. Multicentre International Study in Liver Transplantation of Neoral. Transplantation 1998;66:1632-40
- Loinaz C, Marin LM, González-Pinto I, et al. A single-centre experience with cyclosporine microemulsion versus tacrolimus in 100 randomized liver transplant recipients: midterm efficacy and safety. Transplant Proc 2001;33:3439-41
- Trunečka P, Boillot O, Seehofer D, et al. Once-daily prolonged-release tacrolimus (ADVAGRAF) versus twice-daily tacrolimus (PROGRAF) in liver transplantation. Am J Transplant 2010;10:2313-23
- Adam R, Karam V, Delvart V, et al. Improved survival in liver transplant recipients receiving prolonged-release tacrolimus in the European Liver Transplant Registry. Am J Transplant 2015;15:1267-82
- Muduma G, Pollock RF, Odeyemi I, et al. Bayesian hierarchical modeling of randomized and nonrandomized studies comparing ciclosporin with immediate- and prolonged-release tacrolimus in liver transplant recipients. Value Health 2015;18:A222
- NHS Blood and Transplant. Organ Donation and Transplantation Activity Report 2013/14. Watford, UK. 2014. https://nhsbtmediaservices.blob.core.windows.net/organ-donation-assets/pdfs/activity_report_2013_14.pdf. Accessed March 2, 2015
- O’Grady JG, Hardy P, Burroughs AK, et al.; UK and Ireland Liver Transplant Study Group. Randomized controlled trial of tacrolimus versus microemulsified cyclosporin (TMC) in liver transplantation: poststudy surveillance to 3 years. Am J Transplant 2007;7:137-41
- Marudanayagam R, Shanmugam V, Sandhu B, et al. Liver retransplantation in adults: a single-centre, 25-year experience. HPB (Oxford) 2010;12:217-24
- Schlitt HJ, Jonas S, Ganten TM. Effects of mycophenolate mofetil introduction in liver transplant patients: results from an observational, non-interventional, multicenter study (LOBSTER). Clin Transplant 2013;27:368-78
- European Medicines Agency. Basiliximab European Public Assessment Report Scientific Discussion. London, UK. 2014. http://www.ema.europa.eu/docs/en_GB/document_library/EPAR_-_Scientific_Discussion/human/000207/WC500053538.pdf. Accessed May 3, 2016
- Levy G, Grazi GL, Sanjuan F, et al. 12-month follow-up analysis of a multicenter, randomized, prospective trial in de novo liver transplant recipients (LIS2T) comparing cyclosporine microemulsion (C2 monitoring) and tacrolimus. Liver Transpl 2006;12:1464-72
- Weigand K, Schnitzler P, Schmidt J, et al. Cytomegalovirus infection after liver transplantation incidence, risks, and benefits of prophylaxis. Transplant Proc 2010;42:2634-41
- British Transplantation Society. Guidelines for the prevention and management of CMV disease after solid organ transplantation. 2011. 3rd edn. Macclesfield, UK. https://www.bts.org.uk/Documents/Guidelines/Active/Final%20CMV%20Guideline%20for%20web%2012-9-2011.pdf. Accessed May 3, 2016
- Azoulay D, Linhares MM, Huguet E, et al. Decision for retransplantation of the liver: an experience- and cost-based analysis. Ann Surg 2002;236:713-21
- Muduma G, Shaw J, Hart WM, et al. Cost utility analysis of immunosuppressive regimens in adult renal transplant recipients in England and Wales. Patient Prefer Adherence 2014;8:1537-46
- National Institute for Health and Care Excellence. Guide to the methods of technology appraisal. 2013. London, UK. http://www.nice.org.uk/article/pmg9/resources/non-guidance-guide-to-the-methods-of-technology-appraisal-2013-pdf. Accessed March 2, 2015
- Ratcliffe J, Longworth L, Young T, et al. Assessing health-related quality of life pre- and post-liver transplantation: a prospective multicenter study. Liver Transpl 2002;8:263-70
- Aberg F, Rissanen AM, Sintonen H, et al. Health-related quality of life and employment status of liver transplant patients. Liver Transpl 2009;15:64-72
- National Institute for Health and Care Excellence. Kidney transplantation (adults) - immunosuppressive therapy (review of TA 85) [ID456]. London, UK. 2015. https://www.nice.org.uk/guidance/GID-TAG348/documents/kidney-transplantation-adults-immunosuppressive-therapy-review-of-ta-85-committee-papers-part-12. Accessed May 5, 2016
- Woodroffe R, Yao GL, Meads C, et al. Clinical and cost-effectiveness of newer immunosuppressive regimens in renal transplantation: a systematic review and modelling study. Health Technol Assess 2005;9:1-179
- Adam R, Karam V, Delvart V, et al. Evolution of indications and results of liver transplantation in Europe. A report from the European Liver Transplant Registry (ELTR). J Hepatol 2012;57:675-88
- Afdhal N, Zeuzem S, Kwo P, et al. Ledipasvir and sofosbuvir for untreated HCV genotype 1 infection. N Engl J Med 2014;370:1889-98
- Nelson DR, Cooper JN, Lalezari JP, et al. All-oral 12-week treatment with daclatasvir plus sofosbuvir in patients with hepatitis C virus genotype 3 infection: ALLY-3 phase III study. Hepatology 2015;61:1127-35
- Biggins SW, Beldecos A, Rabkin JM, et al. Retransplantation for hepatic allograft failure: prognostic modeling and ethical considerations. Liver Transpl 2002;8:313-22