
Abstract
Objective: To assess the economic value of carfilzomib (Kyprolis), this study developed the Kyprolis Global Economic Model (K-GEM), which examined from a United States (US) payer perspective the cost-effectiveness of carfilzomib-lenalidomide-dexamethasone (KRd) versus lenalidomide-dexamethasone (Rd) in relapsed multiple myeloma (RMM; 1–3 prior therapies) based on results from the phase III ASPIRE trial that directly compared these regimens.
Methods: A partitioned survival model that included three health states of progression-free (on or off treatment), post-progression, and death was developed. Using ASPIRE data, the effect of treatment regimens as administered in the trial was assessed for progression-free survival and overall survival (OS). Treatment effects were estimated with parametric regression models adjusting for baseline patient characteristics and applied over a lifetime horizon. US Surveillance, Epidemiology and End Results (1984–2014) registry data were matched to ASPIRE patients to extrapolate OS beyond the trial. Estimated survival was adjusted to account for utilities across health states. The K-GEM considered the total direct costs (pharmacy/medical) of care for patients treated with KRd and Rd.
Results: KRd was estimated to be more effective compared to Rd, providing 1.99 life year and 1.67 quality-adjusted life year (QALY) gains over the modeled horizon. KRd-treated patients incurred $179,393 in total additional costs. The incremental cost-effectiveness ratio (ICER) was $107,520 per QALY.
Limitations: Extrapolated survival functions present the greatest uncertainty in the modeled results. Utilities were derived from a combination of sources and assumed to reflect how US patients value their health state.
Conclusions: The K-GEM showed KRd is cost-effective, with an ICER of $107,520 per QALY gained against Rd for the treatment of patients with RMM (1–3 prior therapies) at a willingness-to-pay threshold of $150,000. Reimbursement of KRd for patients with RMM may represent an efficient allocation of the healthcare budget.
Introduction
Multiple myeloma (MM) is a rare disease that accounts for ∼1% of all cancers and is the second most common hematological malignancyCitation1,Citation2. At diagnosis, nearly 40% of patients are under the age of 65 yearsCitation3. MM is characterized by a pattern of remission and relapse and returns more aggressively and in a shorter period of time with each successive relapse, ultimately leading to death. Median overall survival (OS) after first relapse is ∼3–3.5 years in patients who have received a second-line therapyCitation4,Citation5. Many patients with relapsed MM (RMM) have worsened health status as a result of disease progression, comorbidities and treatment-related toxicitiesCitation6; patients’ health-related quality-of-life (HRQoL) also degrades as the disease progressesCitation7,Citation8. Furthermore, the cost of managing MM increases as the disease progresses and worsensCitation9,Citation10.
Given the relapsing nature of the disease, the goals of first and subsequent lines of treatment are to achieve the longest possible progression-free survival (PFS) with minimal treatment-related toxicities, thereby extending OS while maintaining or improving HRQoL. For the last decade, lenalidomide and/or bortezomib in combination with dexamethasone and/or other alkylating agents have been the most common treatment options for managing RMM. Real-world treatment pattern data from the US show that, in 2013–2014, lenalidomide- and bortezomib-based combinations represented the mainstay of treatment in patients with RMM after one prior therapy (second line), used in 37.4% and 34.7% of patients, respectivelyCitation11.
The clinical value for the addition of carfilzomib (Kyprolis) to lenalidomide plus dexamethasone (KRd) for patients with RMM has been clearly established and endorsed by National Comprehensive Cancer Network (NCCN) GuidelinesCitation12. In ASPIRE, a phase III, multi-center, randomized, controlled trial, KRd, achieved an unprecedented median PFS of 26.3 months, an increase in median PFS of 8.7 months over lenalidomide plus dexamethasone (Rd) (hazard ratio [HR] for progression or death = 0.69; 95% confidence interval [CI] = 0.57–0.83; p = 0.0001). While median OS was not reached, the Kaplan–Meier 24-month OS rates showed a strong trend in favor of the KRd group (HR for death = 0.79; 95% CI = 0.63–0.99; p = 0.04). Almost nine of 10 patients (87.1%) responded to KRd and the rate of patients achieving a complete response was more than tripled (31.8% of patients in the KRd group vs 9.3% of patients in the Rd group), and was associated with longer PFS and OS in the trial. In addition to efficacy, HRQoL was significantly improved (p < 0.001) in the KRd arm compared with the Rd arm over the 18 cycles of carfilzomib treatmentCitation13. Importantly, a post-hoc secondary analysis of ASPIRE data showed that the clinical benefit of adding carfilzomib to Rd was consistent across prior lines of treatment (HR for improvement in PFS vs Rd was 0.69 for patients with one prior line of therapy and ≥2 prior lines of therapy)Citation14, regardless of the cytogenetic risk status. The safety profile of KRd remained manageable relative to Rd with comparable rates of ≥ grade 3 adverse events (AEs) (83.7% of patients in the KRd group; 80.7% of patients in the Rd group) and comparable rates of discontinuationCitation13. Based on ASPIRE data, the US Food and Drug Administration and the European Medicines Agency approved KRd for the treatment of relapsed MM and the NCCN Guidelines for MM recommended KRd as a preferred category 1 option for previously treated MMCitation12. In fact, KRd is the only regimen evaluated by NCCN Evidence Blocks™ to achieve the maximum score for efficacy (5/5) in this patient populationCitation15.
In recent times, the US has witnessed a heightened discussion of drug costs and their associated value, not only in policy and payer forums, but more broadly in the public mediaCitation16,Citation17. Now, more than ever before, data on clinical efficacy and safety are necessary but not sufficient to define therapeutic value; economic analyses that quantify value over the long-term from a patient and societal perspective are essential. Cost-effectiveness analyses examine the overall value of a treatment in terms of incremental costs over incremental health benefits. Health benefits are generally expressed as quality-adjusted life-years (QALYs) and are calculated based on the duration of life adjusted for the quality-of-life. Results are expressed as incremental cost-effectiveness ratios (ICERs) and are evaluated against threshold values that typically vary by country. The use of direct data from comparative clinical trials in cost-effectiveness analyses, when available, is preferred over methods that make indirect comparisons derived by combining data from separate trials, given the large number of uncontrolled variables and heterogeneous patient populations across disparate studies. In order to demonstrate the economic value of carfilzomib from a US payer perspective, the Kyprolis Global Economic Model (K-GEM) compared KRd with Rd using the direct, head-to-head comparative data from the ASPIRE trial.
Patients and methods
Model description and structure
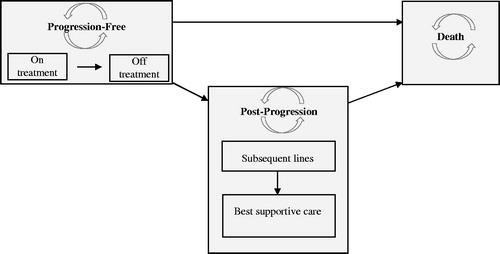
The K-GEM is a cohort-based, partitioned survival model with a 30-year horizon that was developed in Microsoft Excel. K-GEM represents patients in three health states: (1) progression-free (PF), (2) post-progression (PP), and (3) death (). Initially, all patients are assumed to be in the PF state, in which they could be on or off treatment. Subsequently, patients may progress or die. In the PP health state, patients may receive subsequent line(s) of active treatment or best supportive care (BSC). Upon discontinuation of subsequent line(s) of active treatment, all patients switch to BSC. The distribution of patients among these health states was estimated using a partitioned survival approach, i.e. using parametric survival functions fitted on ASPIRE PFS and OS data to estimate the proportion of patients in the PF and death states in a given cycle. The length of a cycle in K-GEM was 4 weeks, to correspond with treatment cycles within the ASPIRE trial. The proportion of patients in PP was the difference between the proportion of patients in the death state and the proportion of patients in the PF state.
Figure 1. Schematic of how patients flow through the Kyprolis Global Economic Model (K-GEM).
Model parameters and data sources
Model population
The target population is patients with RMM who had received 1–3 prior therapies (i.e. mirroring the baseline characteristics of patients enrolled in the ASPIRE trial)Citation13. Prior exposure to lenalidomide plus dexamethasone was allowed, as was prior exposure to bortezomib.
Data sources
The K-GEM incorporated data from the phase III ASPIRE trial, registry data from Surveillance, Epidemiology, and End Results (SEER), publicly available information from product labels, publicly available cost data, published literature, and expert opinions.
Regimens
In ASPIRE, patients received KRd or Rd in 28-day cycles. Carfilzomib was administered intravenously (IV) over 10 min on days 1, 2, 8, 9, 15, and 16 of cycles 1–12 and on days 1, 2, 15, and 16 during cycles 13–18, after which all remaining patients discontinued carfilzomib. The starting dose was 20 mg/m2 on days 1 and 2 of cycle 1 and then 27 mg/m2 thereafter. Patients with a body surface area (BSA) greater than 2.2 m2 received a dose of carfilzomib based upon a 2.2-m2 BSA (i.e. no more than a 60-mg vial was used, per administration) and this dose cap was also applied in K-GEM. For all cycles, lenalidomide (25 mg, oral) was administered on days 1–21. Dexamethasone (40 mg) was assumed in K-GEM to be orally administered on days 1, 8, 15, and 22Citation13. Both lenalidomide and dexamethasone were administered until progression in each arm.
The ASPIRE study protocol was approved by the institutional review boards of all participating institutions and was conducted in accordance with the Declaration of Helsinki.
Treatment effect
Survival analyses for PFS and OS were conducted according to National Institute for Health and Care Excellence (NICE) guidelinesCitation18. ASPIRE OS data were relatively immature, with 58% and 54% of patients alive after 36 months in the KRd and Rd arm, respectively.
In order to test whether the treatment effect is proportional over time and the survival curves fitted to each treatment group have a similar shape, the proportional hazards assumptions were tested with log-cumulative hazard plots and log odds survival plots, and with tests of interaction between treatment effect and time with a Cox modelCitation19. Non-significant results would suggest that the null hypothesis could not be rejected and that the hazards could be assumed proportional. Once determined, joint parametric models would then be fitted to the entire dataset. Distinct parametric multiple regression models were generated with treatment effect as a covariate to estimate the difference between KRd and Rd on PFS and OS.
Probability of survival for the baseline Rd curve beyond the trial follow-up, specifically after the time of the last death event in the Rd arm, was derived by fitting a Weibull parametric distribution to real-world observational data from the US SEER registry (1984–2014). Data from SEER were matched to the ASPIRE population on age, gender, and time since MM diagnosis. Decade of diagnosis was controlled and results were adjusted to the most recent decade to account for the progressive availability of new treatments and better management of the disease.
Adverse events
AEs of grade 3 or greater severity were determined from the treatment-related AEs reported in ASPIRE. Those with incidence ≥2% in either treatment arm of the ASPIRE trialCitation13 or identified based on clinical expert opinion as relevant in RMM (i.e. less frequent AEs with high impact to HRQoL and/or costs, such as cardiac failure and dyspnea) were included in K-GEM unless they were redundant (e.g. platelet count decreased was not included as AE, but thrombocytopenia was included) (). Monthly probabilities of experiencing a given AE were calculated from the percentages of patients experiencing an AE over the course of the ASPIRE trial and from the mean time on treatment in ASPIRE (KRd = 88.1 weeks; Rd =70.7 weeks)Citation13. Patients were assumed to be at risk for AEs only while on treatment. The impact of AEs was evaluated in the ‘PF, on-treatment’ state as well as in the ‘PP, on subsequent treatment’ state.
Table 1. Percentages of patients receiving KRd or Rd reporting ≥ grade 3 adverse events over the course of the ASPIRE trial and associated costs.
Treatment discontinuations
Discontinuation of treatments due to reasons other than progression was modeled for each of the individual components of both regimens. A patient could discontinue one or two of the components of the regimen while remaining on the other component(s) (e.g. in the KRd arm, a patient could discontinue carfilzomib while staying on lenalidomide and dexamethasone). Exponential distributions were fitted to observed time to treatment discontinuation data in ASPIRE.
Subsequent treatments
The impact of subsequent therapy was captured in K-GEM from a cost perspective and also from an efficacy perspective, implicitly by relying on the OS data from the trial that allowed subsequent therapies. Upon disease progression, after a treatment-free interval of three cycles as observed in ASPIRE, patients received subsequent active treatment(s) as observed in each arm of the ASPIRE trial (). The dosing schedules applied for each subsequent treatment are presented in . The relative dose intensity (i.e. the ratio of actual dose vs planned dose) was assumed to be 100% for all subsequent treatments, and overall duration for subsequent therapies was assumed to be a maximum of 17 cycles for both comparators, based on data from a chart-audit conducted across seven European countriesCitation20. We considered a scenario where carfilzomib, pomalidomide plus dexamethasone, bortezomib plus dexamethasone, and daratumamab were distributed equally as subsequent treatment options for patients who progress.
Table 2. Subsequent therapies.
Table 3. Subsequent-line(s) drug costs.
Direct costs
The K-GEM considered the total direct costs (pharmacy and medical) of care for patients treated with KRd and Rd, while indirect costs were not included. The following cost components were included: drug costs, costs for treatment of AEs, drug administration and routine monitoring costs, subsequent treatment (PP), and associated AE costs. All costs were estimated from a US payer perspective in 2015 US dollars (USD).
Drug costs
Medication prices were estimated with the average wholesale acquisition cost (WAC) obtained from Truven Health Analytics’ RED BOOKCitation21; the average wholesale price (AWP) was used when WAC prices were unavailable. To calculate drug costs, mean weight or BSA of patients, available strengths for a vial/capsule/tablet, price of a pack, number of vials/capsules/tablets in a pack and the average dose per administration and their respective subsequent dose escalations were considered. In the case of drugs for which the dose administered depends on the weight or BSA of patients, drug costs were estimated per actual administered dose for ∼90% of patients and, for the remaining 10% of patients, drug costs were rounded up to include the actual drug administered and any unused drug remaining in the vial based on the available vial size(s). The dosing for each comparator was based on the ASPIRE trial. Information on the dosing for each treatment, along with the unit cost and cost per cycle for each drug, are presented in .
Table 4. KRd and Rd drug costs.
Administration and routine monitoring
Administration costs were based on the unit costs for IV and subcutaneous administration costs derived from the 2015 Centers for Medicare & Medicaid Services (CMS) National Physician Fee Schedule ($100.7 IV administration [healthcare common procedure coding system (HCPCS) code 96409] for carfilzomib, $125.37 IV administration [HCPCS code 96413] for doxorubicin and bendamustine, $153.61 IV administration [HCPCS codes 96413 + 96415] for cisplatin; $64.58 subcutaneous administration [HCPCS code 96401] for bortezomib). For carfilzomib, the administration costs were adjusted to account for skipped doses when no IV drug was given based on ASPIRE data.
It was assumed that all patients would require periodic routine monitoring in both PF and PP states, which included office visits, laboratory tests, and procedures. The pre-progression monthly monitoring costs were estimated to be $188.91 (whether on or off treatment) and the post-progression monthly monitoring costs to be $445.03 (whether on active subsequent treatment or on BSC), based on resource use data reported in a recent publicationCitation22. The resource use costs for on-treatment patients were assumed to be the same across both comparators, and all unit costs were based on the national limit price from the CMS 2014 fee schedule. Additional resource use data were considered on the basis of clinical expert opinion: outpatient office visit at a frequency of 16 times/year in PF, 0 in PP, with a unit cost of $42.12Citation58; and serum free light chain assay at a frequency of 12 times/year in PF, 0 in PP, with a unit cost of $18.54Citation22,Citation23.
Adverse event costs
The costs for treatment-related AEs associated with KRd and Rd, as well as with the subsequent treatments, were included in K-GEM and were obtained from two sourcesCitation24,Citation25. Costs for constipation and renal failure were from the H⋅CUPnet National (Nationwide) Inpatient Sample (NIS) 2013Citation24; and costs for all other AEs were from a retrospective observational study using the MarketScan database that identified adult patients with MM (ICD-9-CM code 203.0x) who initiated MM treatment between January 1, 2006 and December 31, 2014Citation25. AEs and associated costs while on MM treatment were identified using diagnosis/procedure and medication claim codes. It was assumed that the cost of managing a grade 3 event was the same as the cost of managing a grade 4 event of the same type, and that cost would be independent of the course of the disease (e.g. pre-progression neutropenia costs are the same as post-progression neutropenia costs). A summary of mean costs by AE is presented in . For each regimen, the average cycle costs of an AE were calculated from the proportion of patients having AEs in each model cycle and from the costs for the management of the AE.
Subsequent treatment costs
Prices for subsequent treatments were obtained from Truven Health Analytics’ RED BOOK, as described above. Information on the unit cost and the cost per model cycle for each subsequent treatment included in K-GEM are presented in .
Health-state utilities
Since in the ASPIRE trial preference-based utility data were not collected, utility input parameters for the model were estimated by using external information and trial-based patient-reported outcomes. In particular, in the PF health state, cycle-specific utility estimates were derived by combining two sources of information (i.e. ‘reference’ utility value and adjustment factor). The ‘reference’ utility value (0.81, irrespective of time since treatment initiation and the treatment itself), which has been used in several previous economic evaluations for treatments in MMCitation26,Citation27, was derived directly from the EuroQol five dimensions questionnaire (EQ-5D) collected in patients with MMCitation26. The reference utility value was then adjusted by an adjustment factor to estimate time- and treatment arm-dependent utilities. Adjustment factors were estimated in two steps. First, patient-reported EORTC QLQ-C30 data gathered in the ASPIRE trial were mapped onto EQ-5D for both treatment arms by applying an existing relevant mapping algorithmCitation28. The mapping function had been derived using a relapsed/refractory MM patient population comparable to the ASPIRE trial population, and has been employed in a similar context beforeCitation29. Second, the relative difference in mapped utilities between cycle 1 (baseline) and subsequent assessments (cycles 3, 6, 12, and 18) was used to calculate time- and treatment-specific adjustment factors, i.e. the ratio of predicted utility beyond baseline to the utility at baseline. Utilities in the pre-progression, off-treatment state were assumed to be equal to the utilities estimated in cycle 18. The same difference between pre- and post-progression utilities (0.17) was adopted for the K-GEM as it was published for the reference utility sourceCitation26. That is, post-progression utilities were estimated by subtracting this difference (0.17) from the weighted average utility in the PF state (cycles 1–18) where the treatment-specific weighted average utility was calculated by adjusting for the proportion of patients in the PF state at each assessment in ASPIRE. Resulting utility values and adjustment factors applied by cycle in K-GEM are reported in .
Table 5. Utility values used in K-GEM.
The impact of AEs on HRQoL was considered as part of this evaluation. A utility decrement associated with an AE and the average duration of this AE were identified from the data reported in the Evidence Review Group (ERG) report for the NICE technology appraisal of pomalidomide ()Citation30. The disutility per model cycle for each grade ≥3 AE for each treatment was obtained by multiplying the AE disutility per event by its per-cycle probability.
Table 6. Adverse event-related utility decrement values in K-GEM.
Analyses
In each 4-week cycle, the K-GEM generated outcomes that were aggregated to estimate life-years (LYs), progression-free life-years (PFLYs), quality-adjusted progression-free life-years (QAPFLYs), QALYs and lifetime costs (PF + PP) for KRd and Rd over a 30-year horizon. The ICER was calculated as incremental costs per QALY gained. Future costs and benefits were discounted at a 3% rate per year.
Univariate deterministic sensitivity analyses were conducted to test the effects of parameter uncertainty within K-GEM. The key model parameters were varied using 95% CIs or a standard error (SE) based on empirical data, where available. In the absence of data, ±20% of the base case values were used.
Probabilistic sensitivity analyses were conducted using 1000 second-order Monte Carlo simulations, such that probability distributions were assigned to the relevant model parameters.
All analyses were conducted from a US payer perspective. A threshold of $150,000 per QALY gained was used for the probabilistic analysesCitation31,Citation32.
In addition to the primary analysis per the parameters described for the intent-to-treat (ITT) population included in ASPIRE, the following scenarios were examined: (1) Add-on therapy costs, i.e. only carfilzomib costs were considered, since the cost-effectiveness of Rd has already been evaluated previouslyCitation33,Citation34; (2) HR for OS from primary ASPIRE publicationCitation13; (3) utilities modeled to be equal for KRd and Rd; (4) an analysis by number of prior therapies (1 prior and ≥2 prior therapies) using the results from the parametric regression models; (5) discount rate of 5% instead of 3% for costs and for benefits; (6) model horizon of 20 years instead of 30 years; (7) drug costs rounded up to include cost for calculated dose and any unused drug in the vial for 100% of patients; and (8) 100% relative dose intensity for carfilzomib as opposed to the dose intensity in the ASPIRE trial.
Results
The results from the test of the interaction between treatment effect and time (p = 0.08 for PFS; p = 0.41 for OS), and visual examination of the log-cumulative hazard plots and log odds survival plots (parallel curves, data on fileCitation35), suggested that proportional hazards and proportional odds assumptions were valid. Consequently, the KRd and Rd arms could be jointly fitted, assuming the same parametric distribution.
In addition to treatment effect, the parametric models retained pre-specified baseline covariates that were significant, as well as those considered to be influential prognostic factors (i.e. age, time since last prior regimen, prior stem cell transplant status and number of prior regimens) for PFS and OS. No evidence of treatment-covariate interaction was detected for PFS or OS, which confirmed a consistent treatment effect across sub-groups. PFS was modeled with a log-logistic parametric distribution and OS was modeled with a Weibull parametric distribution, since these distributions had the best fit visually () as well as statistically, based on Akaike information criterion (AIC) and Bayesian information criterion (BIC) statistics (). The treatment effect estimated from parametric regression models with KRd relative to Rd was statistically significant for both OS (HR of the Weibull multiple parametric model = 0.70, 95% CI = 0.53–0.87) and PFS (odds ratio [OR] of the log-logistic multiple parametric model = 0.51, 95% CI = 0.38–0.67).
Figure 2. Progression-free survival and overall survival parametric distributions. KM, Kaplan–Meier; KRd, carfilzomib plus lenalidomide plus dexamethasone; OS, overall survival; PFS, progression free survival; Rd, lenalidomide plus dexamethasone; SEER, Surveillance, Epidemiology, and End Results.
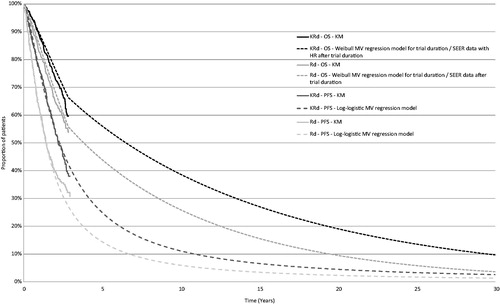
Table 7. AIC and BIC values for all parametric multiple regression models.
Primary analysis
The ICER with KRd over Rd was $107,520, and the incremental cost per LY gained was $89,957 (). Patients on KRd incurred $483,845 in lifetime costs compared with $304,452 for patients on Rd. The QALYs gained were 5.88 and 4.21 for patients on KRd and Rd, respectively. It was estimated that patients treated with KRd benefited from an additional 1.99 LYs (7.83 vs 5.84), 1.20 PFLYs (3.79 vs 2.59), and 1.67 QALYs (5.88 vs 4.21) compared with patients on Rd. The pre-progression drug costs for the multi-year KRd regimen were $356,041; 30.8% ($109,779) was attributable to carfilzomib (which was administered for a maximum of 18 cycles or until progression, whichever occurred first) and the remainder, 69.2% ($246,262), was attributable to Rd (administered until progression). Subsequent therapy drug costs in the PP state were not very different in the KRd ($73,355) and Rd arms ($76,018).
Table 8. Primary analysis results.
Sensitivity analyses
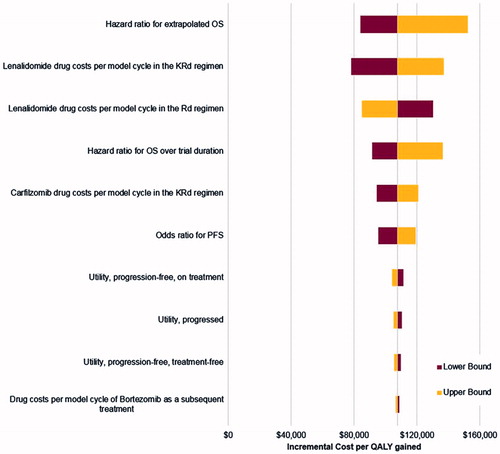
Results of univariate deterministic sensitivity analyses are presented in a form of a Tornado diagram (). The ICER was most influenced by the HR for OS beyond the trial duration, followed by the drug costs per cycle of lenalidomide in the KRd regimen, the drug costs per cycle of lenalidomide in the Rd regimen, the HR for OS over the trial period, the drug costs per cycle of carfilzomib and the OR for PFS. The model results were less sensitive to the utility values.
Figure 3. Tornado diagram illustrating results of deterministic sensitivity analyses. KRd, carfilzomib plus lenalidomide plus dexamethasone; OS, overall survival; PFS, progression-free survival; QALYs, quality-adjusted life-years; Rd, lenalidomide plus dexamethasone.
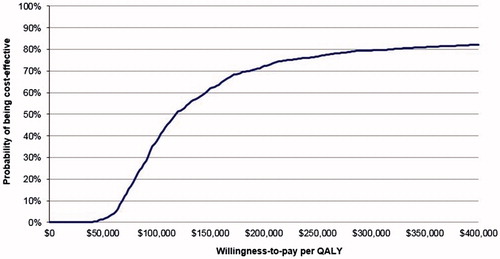
The results of the probabilistic sensitivity analysis (PSA) are presented next. As shown, 90.6% of the simulations resulted in a positive ICER, indicating that KRd was more effective and more costly than Rd (North-East quadrant in ). The cost-effectiveness acceptability curve from K-GEM () showed that, at a willingness-to-pay (WTP) level of $150,000 per QALY gained, the estimated probability of KRd being cost-effective was 61.9%. At $250,000 per QALY gained, the estimated probability of KRd being cost-effective was 76.8%.
Figure 4. Incremental cost-effectiveness plane illustrating the probabilistic sensitivity analysis results. ICER, Incremental cost-effectiveness ratio; QALYs, Quality adjusted life-years.
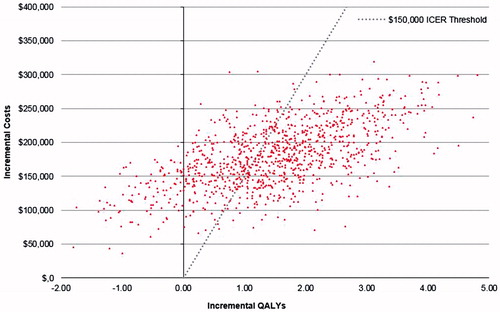
Figure 5. Cost-effectiveness acceptability curve. QALY, Quality adjusted life-year.
Scenario analyses
Results from the scenario analyses are summarized in . Consideration of carfilzomib costs only resulted in the ICER being below $75,000/QALY gained. Reduction of the time horizon or increase of the discount rates both increased the ICER to values just below $130,000. When assuming that all unused drug was costed, 100% dose intensity for carfilzomib, or equivalent utilities in both treatment arms considered, the ICER was increased by ∼$10,000 relative to the primary analysis ($107,520). An alternative scenario regarding survival modeling had the greatest impact on the estimated outcomes. When the HR from the primary ASPIRE publication was used for OS, the LY and QALY estimates for both arms were reduced and the ICER increased to $139,682/QALY gained. Results for the patient group with one prior line of therapy, who represented 43% of the ASPIRE population, were in line with the overall population, resulting in an ICER of $101,914/QALY gained. The ICER for the group of patients with ≥2 prior therapies was relatively higher ($130,138). In a scenario where carfilzomib, pomalidomide plus dexamethasone, bortezomib plus dexamethasone and daratumamab each had 25% share for patients who progress, the ICER was estimated to be $106,512.
Table 9. Scenario analyses results.
Discussion
In the pivotal phase III ASPIRE trial, KRd achieved greater than 2 years of PFS (median PFS = 26.3 months) and was superior to Rd for the treatment of patients with RMM who had received 1–3 prior therapies. This magnitude of absolute PFS has been previously observed only among newly-diagnosed patients with previously untreated myeloma. The efficacy of carfilzomib was also clearly demonstrated in ENDEAVOR, the first ever head-to-head, phase III trial of two proteasome inhibitors in RMM. Median PFS was doubled with carfilzomib plus dexamethasone (Kd) compared with bortezomib plus dexamethasone (Vd) (18.7 months vs 9.4 months; HR = 0.53, 95% CI = 0.44–0.65; p < 0.0001)Citation36. In addition to the magnitude of PFS benefit achieved with carfilzomib, the efficacy of KRd was consistent across sub-groups (e.g. prior exposure to bortezomib, number of prior therapies, age, risk group)Citation14, and its safety profile was manageable, thus offering clinicians a highly potent option to tailor treatment according to the needs of the individual patient.
To assess the economic value of carfilzomib, the primary analysis focused on the ITT population data from the ASPIRE clinical trial, which directly compared KRd and Rd in patients with RMM. From the primary analysis, we see that the ICER is $107,520, and the incremental cost per LY gained is $89,957. The model-estimated total LYs achieved with KRd and Rd are 7.83 and 5.84, respectively, with an estimated gain of nearly 2 LYs with KRd.
Interestingly, the estimated total survival for Rd based on the K-GEM is similar to that estimated in a life-time cost-effectiveness (CE) model from the UK National Health Service (NHS) perspective, which showed that Rd achieved a total of 5.37 life-yearsCitation34. These data serve as a source of external validation for the approach utilized in the K-GEM to extrapolate survival data beyond the trial with the use of SEER registry data. The SEER data are generalizable to the US population, enhancing the relevance of the model findings from the perspective of both patients and payers in the US.
While Rd is a common treatment for patients with RMM, it is a relatively novel agent. In this case, where an innovative product such as carfilzomib is added onto an existing regimen (Rd) that already contains an innovative product, the cost of the two products simply added together could generate the perception that KRd is an expensive regimen. However, patients, when treated with KRd, receive carfilzomib until cycle 18 only, and, furthermore, the number of doses per cycle beyond cycle 12 are 33% fewer than the number of doses up to cycle 12. Therefore, carfilzomib does not represent a large share of the drug costs during the PF state. In the K-GEM, carfilzomib represented 30.8% of the total pre-progression drug costs, while a majority of the drug costs (69.2%) were represented by Rd. Consequently, the majority of the KRd drug costs are attributable to a historical base treatment generally considered cost-effective. Therefore, while KRd was highly cost-effective in the primary analysis, the ICER improved dramatically in the scenario that considered only carfilzomib costs during the pre-progression period.
In other scenario analyses, we demonstrated the robustness of the ICERs for KRd over Rd from the K-GEM by conducting an analysis with the HR for OS from the primary publication, and by examining extreme scenarios for key parameters. In particular, extreme scenarios assumed equal utilities for both regimens (despite a clear significant difference in HRQoL between KRd and Rd), accounted for the cost of any unused drug, considered the maximum dose intensity for carfilzomib (i.e. patients received 100% of the planned doses, which is rarely realized in real-world settings), used a 5% discount rate that is greater than usual, and applied a significantly shorter time horizon (20 years). In each case, the incremental cost per QALY increased as expected, but remained within accepted thresholds.
The results for the analysis by number of prior therapies should be interpreted with the consideration that the population of interest in the trial, and the resulting indication approved by the FDA for KRd, included patients who have received 1–3 prior therapies. In general, the results did not deviate considerably from the primary analysis highlighting the consistency of the treatment effect achieved with KRd vs Rd for patients who had received 1 or ≥2 prior therapies. The model predicted longer life expectancy for patients with ≥2 prior therapies since this specific ASPIRE population was, on average, more than 2 years younger than the population with one prior therapy (63.0 vs 65.2 years, respectively). In contrast to the K-GEM, an analysis by the Institute for Clinical and Economic Review examining the cost-effectiveness of KRd v Rd via an indirect comparisonCitation37 concluded that the ICER was higher than reported here, but the lowest among recently approved triplet combinations (KRd, elotuzumab-Rd, ixazomib-Rd). The indirect comparison did not address patient heterogeneity across trials, nor did it consider differences in definitions for influential trial parameters (for e.g. cytogenetic risk). The analysis utilized baseline Rd PFS estimates from the MM-009/010Citation38,Citation39 trials, which were considerably lower than those observed in the more recent trialsCitation13,Citation40,Citation41 to project PFS and OS for the standard of care (Rd), which led to an under-estimation of the gain in both PFS and OS for the novel regimens including KRd. Furthermore, the analysis did not appropriately value HRQoL outcomes by treatment; thereby under-estimating total QALYs for treatments such as KRd, which showed an improvement in HRQoL over Rd in ASPIRECitation13. Collectively, these limitations resulted in an over-estimation of the ICER for KRd in ICER’s analysis, which have come under severe scrutiny and criticism from a number of organizations representing MM clinicians such as the American Society of Hematology (ASH) and patient support groups including Cancer Support Community and the Cutaneous Lymphoma Foundation.
In the primary analysis, we concluded that KRd was cost-effective vs Rd, on the basis of a $150,000 threshold, which was recently recommended as a threshold for decision-makers in the US to anchor uponCitation32. However, it should be noted that, in the US, a broad range of ICER thresholds have been proposed ($150,000–$300,000 per QALY gained)Citation31,Citation42, although no strict limits have been set. Based on the WHO criterion, an ICER threshold that is 3-times the gross domestic product (GDP) per capita, the US threshold (with a GDP per capita of $50,000) would be $150,000/QALY gainedCitation31. US physicians have valued a treatment on top of standard of care at $125,000 if it yielded 6 additional months of life, which results in a threshold of $250,000 per life-year gainedCitation43. Consistent with this, another survey of oncologists showed that the clinicians valued 1 QALY to be ∼$300,000Citation44. Additionally, studies based on labor market data have concluded that the willingness of consumers to pay for reducing mortality risk is estimated to be at $300,000 per LYCitation45.
At the current WTP thresholds in the US, this analysis demonstrates that reimbursement of KRd for the treatment of patients with RMM who have received 1–3 prior therapies represents an efficient allocation of a US payer’s healthcare budget. While a CE analysis is a very meaningful approach for decision-makers to judge the value of a new technology relative to the current standard of care, it does not provide insight into incremental gains achieved with the introduction of several technologies over time. Ten years ago, patients with MM lived 2–3 years from diagnosis. Today, thanks to the development and considerable use of novel medicines, one out of four patients live 10 years or longerCitation3,Citation46, and this estimate would be expected to be higher with the recent spate of approved treatments for RMM. Evaluation of the value of a combination/sequence of novel treatments in a single disease area would be an interesting analysis rather than individually comparing each treatment with another, but such an analysis is beyond the scope of this body of work.
The analysis had various limitations associated with the underlying data and methods. Despite the large size of the ASPIRE trial and a mature PFS dataset, the survival functions had to be extrapolated to more than 25 years after the follow-up period in the trial, which increases uncertainty in the model results. Although the SEER population was matched to ASPIRE in terms of age, gender, and disease duration, additional prognostic factors such as the International Staging System (ISS) stage, cytogenetic risk, and prior treatments were not available to further improve the comparability of the patients in the two datasets. The application of the SEER data to extrapolate survival beyond trial duration is influential in the model and, as shown, results are sensitive to the survival modeling approach chosen. The SEER data do offer a real-world representation of survival outcomes, which are often meaningful for payer audiences making decisions at a population level. As noted, the survival estimates for the Rd arm produced from this extrapolation with data up to 2012 corresponded with previously published estimates of LYs gained with Rd.
Utility data were not collected in the ASPIRE trial; therefore, a mixed methodology was used to derive utilities from multiple sources. Previously published reference utility estimates from a Dutch studyCitation26, which source data from patients who underwent intensive chemotherapy were combined with ASPIRE trial results via a utility-mapping exercise, however were not adjusted for preference weights reflecting the US population. Utility decrements associated with AEs were adjusted on the basis of a UK assessmentCitation30. Utility for all subsequent therapies were also assumed to be the same for the rest of the patients’ life. Therefore, the utility estimates are subject to uncertainty, and future studies are needed to determine utility estimates that correspond closely with how patients value these health states.
A further data gap, contributing to some—although limited—uncertainty, was the lack of subsequent therapy patterns, including the length, the therapy choices and the treatment-free periods between further lines, specifically for the US, in the published literature. There is, therefore, uncertainty about the composition of subsequent therapies, since trial data are not necessarily representative of real-world treatment patterns in the US. Finally, assumptions and data from a published study sourcing these from key opinion leader interviews were used to provide resource use data for the health states. To account for these data limitations, several scenarios have been tested and detailed univariate analyses were run.
While the partition survival modeling approach undertaken in the K-GEM is the most common approach to model CE of oncology therapies, there is always some structural uncertainty inherent to the modeling process that would be revealed only if an alternative model was also built or became apparent with observational data based on patient experience with KRd. While long-term observational data will yield true survival estimates, the K-GEM utilizes data from a well-designed, robust trial that conducted a direct comparison between KRd and Rd, and extrapolates survival gains with the use of real-world data from SEER.
Conclusions
The K-GEM was a model that simulated treatment of the RMM population who had received 1–3 prior lines of therapy in the ASPIRE trial. The model showed that KRd is cost effective, with an ICER of $107,520 per QALY gained against Rd; the ICER is below the WTP threshold of $150,000, a generally accepted threshold in the US. This model is based on actual direct costs of treatment and largely driven by the superior efficacy of KRd over Rd demonstrated in the ASPIRE trial, which was observed to be consistent across sub-groups. For the population studied in the ASPIRE trial, i.e. relapsed MM patients who have received one-to-three prior treatments, KRd represents a highly effective and cost-effective treatment option. For payers, reimbursement of KRd for this patient population may represent an efficient allocation of healthcare dollars for the management of relapsed MM.
Transparency
Declaration of funding
This work was supported by Amgen, Inc., Thousand Oaks, CA.
Declaration of financial/other relationships
AJ has served as an advisory board member and consultant for Amgen and Celgene, has received sponsorships/grants from Amgen and Celgene, and has received honoraria from Celgene. SA, BB, MC, and SP are employed by and own stock in Amgen Inc. AB, IH, and ET are employees of Evidera, Inc., and this analysis was developed in collaboration with Evidera and sponsored by Amgen. JME peer reviewers on this manuscript have no relevant financial or other relationships to disclose.
Acknowledgments
The authors would like to thank Julie Gegner, PhD, and Shawn Lee, PhD, employees of Amgen, for writing and editorial support.
References
- Ferlay J, Soerjomataram I, Ervik M, et al. GLOBOCAN 2012 v1.0, Cancer Incidence and Mortality Worldwide: IARC CancerBase No. 11 [Internet]. Lyon, France: International Agency for Research on Cancer; 2013. Available from: http://globocan.iarc.fr. Accessed March 28, 2016
- Palumbo A, Anderson K. Multiple myeloma. N Engl J Med 2011;364:1046-60
- SEER. Surveillance, Epidemiology, and End Results Program. Stat Fact Sheets: Myeloma. Bethesda, Maryland: National Cancer Institute; 2016. http://seer.cancer.gov/statfacts/html/mulmy.html. Accessed March 28, 2016
- Durie BG, Moreau P, Sonneveld P. Regional differences in the treatment approaches for relapsed multiple myeloma: an IMF study. J Clin Oncol 2012;(Suppl):abstr 8095
- Dimopoulos MA, Lonial S, White D, et al. Eloquent-2 update: a phase 3, randomized, open-label study of elotuzumab in combination with lenalidomide/dexamethasone in patients with relapsed/refractory multiple myeloma - 3-year safety and efficacy follow-up. ASH Meeting, Presented by Meletios Dimopolous. Orlando, FL; December 5th, 2015
- Dimopoulos MA, Sonneveld P, Siegel D, et al. Carfilzomib and pomalidomide in patients with relapsed and/or refractory multiple myeloma with baseline risk factors. Ann Oncol 2016;26:2247-56
- Mols F, Oerlemans S, Vos A, et al. Health-related quality of life and disease-specific complaints among multiple myeloma patients up to 10 yr after diagnosis: results from a population-based study using the PROFILES registry. Eur J Haematol 2012;89:311-9
- Jordan K, Proskorovsky I, Lewis P, et al. Effect of general symptom level, specific adverse events, treatment patterns, and patient characteristics on health-related quality of life in patients with multiple myeloma: results of a European, multicenter cohort study. Support Care Cancer 2014;22:417-26
- Armoiry X, Fagnani F, Benboubker L, et al. Management of relapsed or refractory multiple myeloma in French hospitals and estimation of associated direct costs: a multi-centre retrospective cohort study. J Clin Pharm Ther 2011;36:19-26
- Potluri R, Farr AM, Hifji I, et al. PCN118 – treatment sequencing patterns and costs of care in patients with relapsed/refractory multiple myeloma. Value Health 2015;18:A450
- Song X, Cong Z, Wilson K. Real-world treatment patterns, comorbidities, and disease-related complications in patients with multiple myeloma in the United States. Curr Med Res Opin 2016;32:95-103
- Clinical practice guidelines in oncology. Multiple myeloma. National Comprehensive Cancer Network (NCCN), v3. Fort Washington, PA: National Comprehensive Cancer Network; 2016
- Stewart AK, Rajkumar SV, Dimopoulos MA, et al. Carflizomib, lenalidomide, and dexamethasone for relapsed multiple myeloma. N Engl J Med 2015;372:142-52
- Dimopoulos MA, Stewart AK, Rajkumar SV, et al. Effect of carfilzomib, lenalidomide, and dexamethasone (KRd) vs lenalidomide and dexamethasone (Rd) in patients with relapsed multiple myeloma (RMM) by line of therapy: Secondary analysis from an interim analysis of the phase III study ASPIRE (NCT01080391). J Clin Oncol 2015;33(Suppl):abstr 8525
- Multiple Myeloma, NCCN Evidence Blocks. National Comprehensive Cancer Network Clinical Practice Guidelines in Oncology (NCCN),v2. Fort Washington, PA: National Comprehensive Cancer Network; 2016
- Emanuel EJ. The solution to drug prices. New York: New York Times; 2015. http://www.nytimes.com/2015/09/09/opinion/the-solution-to-drug-prices.html. Accessed April 14, 2016
- Pollack A. Drug prices soar, prompting calls for justification. New York: New York Times; 2015. http://www.nytimes.com/2015/07/23/business/drug-companies-pushed-from-far-and-wide-to-explain-high-prices.html. Accessed April 14, 2016
- Latimer NR. Survival analysis for economic evaluations alongside clinical trials–extrapolation with patient-level data: inconsistencies, limitations, and a practical guide. Med Decis Making 2013;33:743-54
- Ng'andu NH. An empirical comparison of statistical tests for assessing the proportional hazards assumption of Cox's model. Stat Med 1997;16:611-26
- Yong K, Delforge M, Driessen C, et al. Multiple Myeloma Management: outcomes in Real-World Practice. Multiple myeloma management: outcomes in real-world practice. Poster presented at European Hematology Association congress, 11-14 June 2015. Poster number P649. Vienna, Austria: European Hematology Association; 2015
- Truven Health Analytics 2013. RED BOOK. Ann Arbor, MI: Truven Health Analytics; 2016. Ann Arbor, MI http://sites.truvenhealth.com/redbook/index.html. Accessed May 18, 2016
- Usmani SZ, Cavenagh JD, Belch AR, et al. Cost-effectiveness of lenalidomide plus dexamethasone vs bortezomib plus melphalan and prednisone in transplant-ineligible US patients with newly-diagnosed multiple myeloma. J Med Econ 2016;19:243-58
- CMS. Clinical Diagnostic Laboratory Fee Schedule. National Limit Payment (CPT code 83883). Baltimore, MD: CMS; 2014
- HCUPnet National Inpatient Sample (NIS), Agency for Healthcare Research and Quality (AHRQ). National statistics by principal diagnosis code. Rockville, MD: Agency for Healthcare Research and Quality; 2013. http://hcupnet.ahrq.gov/. Accessed March 29, 2016
- Amgen Inc. Data on File. Retrospective study of healthcare utilization and costs in patients with multiple myeloma using Truven MarketScan Data Through December 2014. Thousand Oaks, CA, USA: Amgen Inc; 2015
- van Agthoven M, Segeren CM, Buijt I, et al. A cost-utility analysis comparing intensive chemotherapy alone to intensive chemotherapy followed by myeloablative chemotherapy with autologous stem-cell rescue in newly diagnosed patients with stage II/III multiple myeloma; a prospective randomised phase III study. Eur J Cancer 2004;40:1159-69
- Novartis. Panobinostat for treating multiple myeloma in people who have received at least one prior therapy. ID663 Single technology appraisal (STA) manufacturer's submission. Basel, Switzerland: Novartis; 2015. http://www.nice.org.uk/guidance/indevelopment/gid-tag477/documents. Accessed March 28, 2016
- Proskorovsky I, Lewis P, Williams CD, et al. Mapping EORTC QLQ-C30 and QLQ-MY20 to EQ-5D in patients with multiple myeloma. Health Qual Life Outcomes 2014;12:35
- National Institute for Health and Care Excellence (NICE) technology appraisal guidance [TA 380]. Panobinostat for treating multiple myeloma after at least 2 previous treatments. England, UK: NICE; 2016. https://www.nice.org.uk/guidance/ta380. Accessed March 15, 2016
- National Institute for Health and Care Excellence (NICE) technology appraisal guidance [TA338]. Pomalidomide for relapsed and refractory multiple myeloma previously treated with lenalidomide and bortezomib. England, UK: NICE; 2015. https://www.nice.org.uk/guidance/ta338. Accessed April 14, 2016
- Hillner BE, Smith TJ. Efficacy does not necessarily translate to cost effectiveness: a case study in the challenges associated with 21st-century cancer drug pricing. J Clin Oncol 2009;27:2111-3
- Neumann PJ, Cohen JT, Weinstein MC. Updating cost-effectiveness — the curious resilience of the $50,000-per-QALY threshold. N Engl J Med 2014;371:796-79
- Brown RE, Stern S, Dhanasiri S, et al. Lenalidomide for multiple myeloma: cost-effectiveness in patients with one prior therapy in England and Wales. Eur J Health Econ 2013;14:507-14
- Schey S. Abstracts of the American Society of Hematology 53rd Annual Meeting, December 10-13, 2011, San Diego, CA. Blood 2011;118:3-1820
- Agnes Benedict, Eszter Tichy, Ivan Houisse, Arman Altincatal. Amgen Data on File. Economic evaluation of carfilzomib in the treatment of Relapsed Multiple Myeloma (RMM): cost-effectiveness Model (CEM) Technical Report. Thousand Oaks, CA, USA: Amgen; 2016
- Dimopoulos MA, Moreau P, Palumbo A, et al. Carfilzomib and dexamethasone versus bortezomib and dexamethasone for patients with relapsed or refractory multiple myeloma (ENDEAVOR): a randomised, phase 3, open-label, multicentre study. Lancet Oncol 2016;17:27-38
- Institute for Clinical and Economic Review 2016. Treatment options for relapsed or refractory multiple myeloma: effectiveness, value, and value-based price benchmarks. Evidence Report. Boston, MA: Institute for Clinical and Economic Review; 2016. http://icer-review.org/wp-content/uploads/2016/05/MWCEPAC_MM_Evidence_Report_050516-002.pdf. Accessed April 8, 2016
- Dimopoulos MA, Spencer A, Attal M, et al. Multiple myeloma (010) study investigators. Lenalidomide plus dexamethasone for relapsed or refractory multiple myeloma. N Engl J Med 2007;357:2123-32
- Weber DM, Chen C, Niesvizky R, et al. Multiple myeloma (009) study investigators. Lenalidomide plus dexamethasone for relapsed multiple myeloma in North America. N Engl J Med 2007;357:2133-42
- Lonial S, Dimopoulos M, Palumbo A, et al. Elotuzumab therapy for relapsed or refractory multiple myeloma. N Engl J Med 2015;373:621-31
- Moreau P, Masszi T, Grzasko N, et al. Oral ixazomib, lenalidomide, and dexamethasone for multiple myeloma. New Engl J Med 2016;374:1621-34
- Braithwaite RS, Meltzer DO, King JT, Jr., et al. What does the value of modern medicine say about the $50,000 per quality-adjusted life-year decision rule? Med Care 2008;46:349-56
- Ubel PA, Berry SR, Nadler E, et al. In a survey, marked inconsistency in how oncologists judged value of high-cost cancer drugs in relation to gains in survival. Health Aff (Millwood) 2012;31:709-17
- Nadler E, Eckert B, Neumann PJ. Do oncologists believe new cancer drugs offer good value? Oncologist 2006;11:90-5
- Aldy JE, WK Viscusi. Adjusting the value of a statistical life for age and cohort effects. Rev Econ Stat 2008;90:573-81
- Pulte D, Redaniel MT, Brenner H, et al. Recent improvement in survival of patients with multiple myeloma: variation by ethnicity. Leuk Lymphoma 2014;55:1083-9
- Velcade® (bortezomib) FDA label - Prescribing Information. Food and Drug Administration. Cambridge, MA: Millennium Pharmaceuticals, Inc.; 2014. http://www.accessdata.fda.gov/drugsatfda_docs/label/2014/021602s040lbl.pdf. Accessed April 14, 2016
- Cyclophosphamide FDA label - Prescribing Information. Food and Drug Administration. Deerfield, IL: Baxter Healthcare Corporation; 2013. http://www.accessdata.fda.gov/drugsatfda_docs/label/2013/012141s090,012142s112lbl.pdf. Accessed April 14, 2016
- Doxorubicin hydrochloride FDA label – Prescribing Information. Food and Drug Administration. New York, NY: Pfizer, Inc.; 2013. http://www.accessdata.fda.gov/drugsatfda_docs/label/2013/050629s022lbl.pdf. Accessed April 14, 2016
- Alkeran® (melphalan) FDA label – Prescribing Information. Food and Drug Administration. Research Triangle Park, NC: GlaxoSmithKline; 2007. http://www.accessdata.fda.gov/drugsatfda_docs/label/2011/014691s030lbl.pdf. Accessed April 14, 2016
- Anthony Fields, Maureen Trudeau, Chaim Bell, et al. pan-Canadian Oncology Drug Review. pCODR Expert Review Committee (pERC) Final Recommendation for Bendamustine (Treanda) for iNHL. pERC Meeting 2012. https://www.cadth.ca/sites/default/files/pcodr/pcodr-treandanhl-fn-rec.pdf. Accessed April 14, 2016
- Food and Drug Administration. VePesid® (etoposide) FDA label. Princeton, New Jersey: Bristol-Myers Squibb; 2004. http://www.accessdata.fda.gov/drugsatfda_docs/label/2002/019557s028lbl.pdf. Accessed April 14, 2016
- Food and Drug Administration. CISplatin FDA label. Paramus, NJ: WG Critical Care, LLC.; 2015. http://www.accessdata.fda.gov/drugsatfda_docs/label/2015/018057s083lbl.pdf. Accessed April 14, 2016
- Pomalyst® (pomalidomide) FDA label - Prescribing Information. Food and Drug Administration. 2013. Summit, NJ: Celgene Corporation; 2013. http://www.accessdata.fda.gov/drugsatfda_docs/label/2013/204026lbl.pdf. Accessed April 14, 2016
- Garderet L, Iacobelli S, Moreau P, et al. Superiority of the triple combination of bortezomib-thalidomide-dexamethasone over the dual combination of thalidomide-dexamethasone in patients with multiple myeloma progressing or relapsing after autologous transplantation: the MMVAR/IFM 2005-04 Randomized Phase III Trial from the Chronic Leukemia Working Party of the European Group for Blood and Marrow Transplantation. J Clin Oncol 2012;30:2475-82
- Rayos (prednisone) FDA label - Prescribing Information. Food and Drug Administration. Deerfield, IL: Horizon Pharma USA, Inc.; 2012. http://www.accessdata.fda.gov/drugsatfda_docs/label/2012/202020s000lbl.pdf. Accessed April 14, 2016
- Beusterien KM, Davies J, Leach M, et al. Population preference values for treatment outcomes in chronic lymphocytic leukaemia: a cross-sectional utility study. Health Qual Life Outcomes 2010;8:50
- Durie B, Binder G, Pashos C, et al. Total cost comparison in relapsed/refractory multiple myeloma. J Med Econ 2013;16:614-22