
Abstract
Objective: The objective of this study was to assess the cost of hypoglycemic events among insulin-treated patients with diabetes and the potential cost savings to a hypothetical US health plan and employer of reducing hypoglycemic events with a device intervention.
Methods: A cost-calculator model was developed to estimate the direct costs of hypoglycemic events, accounting for diabetes type, age, and event severity. Model inputs were derived from published incidence rates of hypoglycemic events and direct medical costs. Assumed intervention efficacy was based on published studies of an emerging technology which yielded 72.2% (LGS Trial; ACTRN12610000024044) and 31.8% (ASPIRE Trial; NCT01497938) reductions in severe and non-severe hypoglycemic events, respectively. Model outcomes—including the number of severe (requiring medical assistance) and non-severe events, and direct/indirect medical costs (excluding intervention costs)—were evaluated over a 1-year period for a hypothetical health plan and employer perspectives.
Results: In a health plan with 10 million enrollees, patients without the intervention would have experienced 0.09 and 14.60 severe and non-severe hypoglycemic events per patient per year (PPPY), respectively (vs 0.02 severe and 9.96 non-severe events with the intervention). This translated into total direct medical cost savings of $45 million ($177 PPPY) for the health plan. For an employer with 100,000 employees, the intervention would have yielded additional savings of $492 PPPY in indirect costs.
Conclusion: Insulin-treated patients experience hypoglycemic events, which are associated with substantial direct and indirect medical costs. The cost savings of reducing hypoglycemic events need to be weighed against the costs of using diabetes device interventions.
Keywords:
Introduction
Type 1 diabetes occurs when the β-cells of the pancreas, which are responsible for the production of insulin, are damaged or destroyed, leading to the cessation of insulin utilization throughout the bodyCitation1. It is also common for type 2 diabetes patients, a population that experiences insulin resistance during the early stages of the disease, to lose their insulin secretory capacity over time. As a result, some patients with advanced type 2 diabetes, similar to that of type 1 patients, require insulin as their primary source of blood-glucose lowering therapyCitation1.
The over-administration of insulin therapy can result in hypoglycemia, a state of low blood glucose that can lead to serious morbidity and mortalityCitation2. During a hypoglycemic event, patients may experience palpitations, tremor, sweating, or, in the most severe cases, seizure or comaCitation3. The annual incidence of severe hypoglycemia (defined as that which requires external assistance) is estimated at 30–40% among patients with type 1 diabetes, while non-severe hypoglycemia (generally defined as a blood glucose level between 50–70 mg/dL that does not require external assistance) can occur up to twice per weekCitation2. Rates among patients with type 2 diabetes are lower, but still significant (e.g. 5% annual incidence of severe hypoglycemia; 9.28–26.6 non-severe episodes per patient per year)Citation4. In addition to its clinical burden, hypoglycemia has been shown to have a substantial economic impact on the US healthcare system, with estimates of the cost of severe hypoglycemic events ranging from $1,200–$17,500 per episodeCitation5,Citation6. Non-severe hypoglycemia has also been shown to have an impact on worker’s productivity, with a recent study estimating that, among patients experiencing nocturnal non-severe hypoglycemia, 14.1% arrived to work late or missed a full day, with an average of 14.3 working hours missed per eventCitation7.
Insulin can be delivered via continuous subcutaneous infusion, which consists of a small, programmable pump and catheter system. While subcutaneous insulin infusion has been shown to be a more efficient and accurate approach to delivering insulin than multiple daily injections, recent clinical reviews have demonstrated that hypoglycemia is still common among patients utilizing this interventionCitation8. New developments in insulin pump therapy have aimed to reduce this risk of hypoglycemia. One such development includes the threshold suspend feature, which demonstrated a reduction in nocturnal hypoglycemic events, compared to a traditional insulin pump, in clinical trialsCitation9.
In addition to the clinical benefits realized directly by the patient, interventions that are successful at alleviating the burden of hypoglycemia could have a substantial impact on organizations that are responsible for managing the economic consequences of hypoglycemia, such as health plans and employers. The objective of this study was to assess the cost of hypoglycemic events among insulin-treated diabetes patients and the potential financial impact to health plans and employers of reducing hypoglycemic events. This information will be beneficial in evaluating the cost-effectiveness of new therapy interventions as they are approved and introduced in the US market.
Methods
Model overview
The model aimed to calculate the direct and indirect costs of hypoglycemic events over a 1-year period among insulin-treated patients with diabetes, taking into consideration diabetes type, patient age and the severity of the event. Results of the model are presented from a health plan perspective and an employer perspective, with the latter estimating the indirect cost of lost work productivity. Within each perspective, results are compared for two scenarios: (1) a scenario in which there is no intervention that reduces the rate of hypoglycemic events (i.e. non-intervention scenario); and (2) a scenario in which a novel technology reduces the risk of severe and/or non-severe hypoglycemic events (i.e. intervention scenario). All calculations for this model were developed and executed in Microsoft Excel (version 2010).
Model structure
The starting population for the health plan perspective was representative of a US health plan with 10 million enrollees, while the employer perspective modeled the experience of a hypothetical company with 100,000 employees. Using data on age distribution and diabetes prevalence, a cohort of insulin-dependent patients with type 1 and type 2 diabetes was created from the starting population for each perspective. Hypoglycemic event rates specific to a patient’s age and diabetes type were then applied to the model cohort. Different incidence rates for severe and non-severe hypoglycemic events were utilized ().
Figure 1. Model diagram. Note, patients entering nodes in white were not included in model calculations.
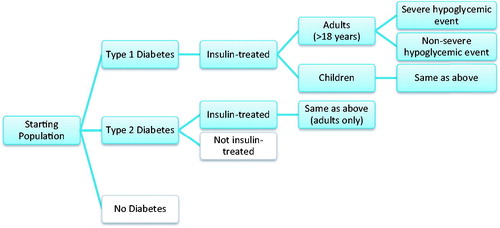
For the health plan, the direct cost of non-severe hypoglycemic events was assumed to be zero, while the cost per severe event varied by treatment setting (i.e. inpatient, emergency room, or outpatient) and was applied to the number of severe events experienced by the cohort in the model. For the employer perspective only, indirect costs were also evaluated for both severe and non-severe hypoglycemic events. Sick time (i.e. lost productive hours) and excess short-term disability costs were included in the analysis and comprised the total indirect cost output. Sick time in the model was defined as the average number of lost work hours due to a hypoglycemic event that could not be made up by the employee (e.g. by working overtime or extra days). An average wage was multiplied by the total hours missed that could not be made up for both severe and non-severe events. For each severe event experienced by the patient population, an excess short-term disability cost was also applied.
The numbers of severe and non-severe events, and associated costs, were evaluated for both the non-intervention and intervention scenarios. For the intervention scenario, reductions in rates of severe and non-severe events were applied to the base case event rates. For illustrative purposes, rate reductions were based on clinical trials of the threshold suspend insulin pump systemCitation9. Sensitivity analyses were conducted in order to assess the impact of changes to the intervention efficacy on model outcomes. For both clinical and economic outputs, the model compared differences between the intervention and non-intervention scenarios.
Model assumptions
Several assumptions were made in the development of this economic model. For instance, all severe hypoglycemic events were assumed to require medical attention; non-severe hypoglycemic events were assumed to require no medical attention and, therefore, were not assigned a medical cost component. Due to data availability, the proportion of severe hypoglycemic events that required medical assistance was obtained from analyses of patients with type 2 diabetes. These proportions were assumed to be valid for type 1 patients as well, and were applied accordingly. The distribution of resource use for severe hypoglycemic events requiring medical assistance was assumed to be the same for adults aged 18–64 and children. This distribution was also obtained from analyses of patients with type 2 diabetes, and was applied to the model’s type 1 population. Furthermore, it was assumed that the cost per severe hypoglycemic event varied by the treatment setting of the event (i.e. inpatient, emergency department, outpatient), but did not vary by age or type of diabetes.
From the employer perspective, productivity losses for a severe hypoglycemic event were assumed to be twice those for a non-severe event in the default case. Also, in the default case, the percentage of lost work time that was not made up was based on the proportion of US workers that are “blue-collar” (61%)Citation10, assuming that these workers cannot recoup lost work time and, thus, will accrue lost wages. It was assumed that the parents of children with severe and non-severe hypoglycemic events would not incur productivity losses. All adults over 65 were assumed to be eligible and enrolled in Medicare, with Medicare representing their primary payer.
Model inputs and data sources
Model inputs included in the analysis are presented in . Model inputs were derived from a variety of sources including the Centers for Disease Control and Prevention, the US Census, the Bureau of Labor Statistics, as well as published literature on clinical trials, claims database analyses, and population-based studies.
Table 1. Model inputs.
Age distribution data (i.e. percentage of population that are children (<18), adults 18–64, and adults ≥65) were based on data from the 2010 US CensusCitation11. Among these age groups, the proportion of patients with a diagnosis of diabetes, and the distribution of type 1 and type 2 diabetes among those with a diagnosis, was applied to the population using data from the Centers for Disease Control and PreventionCitation12,Citation13. The proportion of patients on Medicare was assumed to be 100% for adults age ≥65 and 4% for adults 18–64, based on data from the Kaiser Family Foundation and US Bureau of Labor StatisticsCitation14,Citation15. It was assumed that 100% of the costs for Medicare patients were covered by a health plan (for health plan perspective only), and that 13% of costs experienced by Medicare patients were covered by the employer (for the employer perspective only)Citation16. For the employer perspective, it was also assumed that all adults 18–64 not covered by Medicare were in the labor force. Costs specific to lost productivity were applied only to patients in the labor force.
Using the derived population of patients with diabetes, the incidence of severe and non-severe hypoglycemic events per patient per year (PPPY) was applied. Data for severe hypoglycemia rates were derived using published data from the Action to Control Cardiovascular Risk in Diabetes (ACCORD) trial and the Diabetes Control and Complications Trial (DCCT)Citation17,Citation18. For type 1 patients, the incidence of hypoglycemia requiring third-party assistance in the DCCT trial was multiplied by the proportion of third-party assistance that was defined to be “medical” among severe hypoglycemic events documented in the ACCORD clinical trials. The incidence of severe hypoglycemia in type 2 patients was calculated as the weighted average of hypoglycemia incidence rates requiring medical assistance for insulin-treated patients in the ACCORD trial. Additional data from the UK Hypoglycemia study was utilized to determine non-severe hypoglycemia event ratesCitation19.
Data on the distribution of treatment settings for severe hypoglycemic events (i.e. proportion of events resulting in an emergency department visit, proportion resulting in an inpatient visit, proportion resulting in an outpatient visit) were derived from a published retrospective database analysis that evaluated the incidence and cost of hypoglycemic events in type 2 patientsCitation6. Data on the number of hours non-severe hypoglycemic events took away from the work day was based on data from a survey of patients with diabetesCitation7; it was assumed that severe hypoglycemic events subtracted twice as many working hours from the employee’s schedule compared to non-severe hypoglycemic events (24 working hours or 3-work days lost per event vs 12 working hours). Average wage and short-term disability costs were based on data from the Bureau of Labor Statistics and published analyses of medical recordsCitation14,Citation20.
For the intervention scenario, base case, high, and low estimates for the reduction of severe and non-severe hypoglycemia were derived from two clinical trials that evaluated the impact of sensor-augmented insulin pump therapy with automated insulin suspension (i.e. threshold suspend) vs other types of insulin pump therapyCitation9,Citation21. The percentage decrease in hypoglycemic events for patients assigned the intervention (compared to controls) was included, as well as the lower and upper 95% confidence interval results. The 31.82% reduction in nighttime hypoglycemic events observed for cases relative to controls in the Bergenstal 2013 trial was used as the base case estimate for the reduced rate of non-severe events due to the intervention; the lower and upper bounds of the 95% confidence interval were calculated as 14.94% and 45.54%, respectivelyCitation9. The 72.22% reduction in the adjusted incidence (per 100 patient-months) of severe plus moderate hypoglycemic events observed for cases relative to controls in the Ly 2013 trial was used as the base case estimate for the reduced rate of severe events due to the intervention; the lower and upper bounds of the 95% confidence interval were calculated as 20.91% and 90.24%, respectivelyCitation21. While results from the clinical trials were based on data from patients with type 1 diabetes, it was assumed that results were general to all hypoglycemic events and were applied to type 2 patients.
Model outcomes
Model outcomes included the total number of severe and non-severe hypoglycemic events experienced and the total direct medical costs associated with these events (i.e. summed across total population), as well as the cost/events PPPY. Total indirect costs (i.e. lost productivity) were reported for the employer perspective only. Results were reported for both the intervention and non-intervention scenarios, with sensitivity analyses also being calculated for the intervention scenario.
Sub-group analysis
A sub-group analysis was conducted in order to explore variation in model outcomes among patients with type 1 diabetes only (i.e. patients with type 2 diabetes were excluded). Given that patients with type 1 diabetes are the primary population included in the threshold suspend clinical trials, evaluating model outcomes among this sub-group may be representative of a typical health plan population that uses the intervention.
Results
Health plan perspective
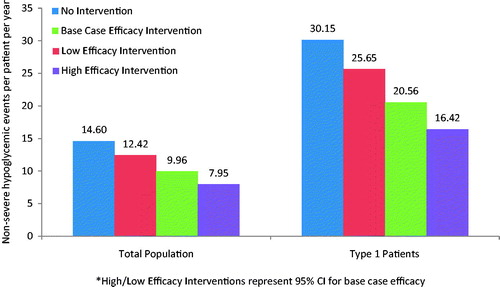
In a health plan with 10 million enrollees, it was estimated that ∼256,000 patients had insulin-treated diabetes (∼47,000 with type 1 diabetes and 209,000 with type 2 diabetes). Without the intervention, patients in the health plan would experience over 22,000 severe and 3.74 million non-severe hypoglycemic events annually (0.09 and 14.60 PPPY, respectively). With the intervention, patients would be expected to experience more than 6100 severe and 2.55 million non-severe hypoglycemic events (0.02 and 9.96 PPPY, respectively) ( and ). Compared to the scenario without the intervention, the scenario with the intervention yielded a reduction in severe and non-severe events in the base case of 0.07 events PPPY (range using high and low estimates of intervention benefit =0.02–0.08) and 4.64 events PPPY (range =2.18–6.65), respectively.
Figure 2. Severe hypoglycemic events per patient per year.
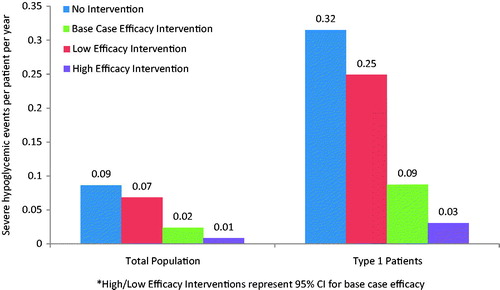
Figure 3. Non-severe hypoglycemic events per patient per year.
Without the intervention, total direct medical costs related to hypoglycemia would be $62.86 million total for the health plan ($245 PPPY). These direct medical costs were reduced to $17.46 million total ($68 PPPY) with the intervention, which translated to annual savings of $45.40 million (range = $13.14–$56.73 million or $51–$221 PPPY) ().
Table 2. Direct and indirect costs of hypoglycemic events.
Employer perspective
From the employer perspective, there were 470 type 1 and nearly 2100 type 2 patients out of a total of 100,000 employees. Without the intervention, a total of 37,443 non-severe and 221 severe events were experienced by the employees. The intervention would reduce the incidence of non-severe and severe events to 25,529 and 62, respectively. PPPY hypoglycemic event outcomes match the data presented from the health plan perspective.
Direct medical costs related to hypoglycemia were $344,000 total ($134 PPPY) in the scenario without the intervention compared to $95,000 total ($37 PPPY) with the intervention, which translated to annual savings of nearly $250,000 (range = $72,000–$311,000 or $28–$121 PPPY). Indirect costs were $3.80 million total ($1483 PPPY) in the scenario without the intervention compared to $2.54 million total ($992 PPPY) with the intervention, yielding annual savings of $1.26 million (range = $576,000–$1.79 million or $225–$697 PPPY) ().
Sub-group analysis
When evaluating a sub-group of type 1 patients only, the average number of PPPY severe (0.31 without the intervention, 0.09 with the intervention) and non-severe (30.15 without the intervention, 20.56 with the intervention) hypoglycemic events increased compared to the base case scenario for both type 1 and type 2 patients ( and ). In the health plan perspective, the intervention yielded direct hypoglycemia-related medical costs savings of $632 PPPY (range = $183–$790 PPPY). In the employer perspective, the intervention yielded direct medical cost savings of $361 PPPY (range = $104–$451 PPPY) and indirect cost savings of $963 PPPY (range = $431–$1,357 PPPY) (). The impact of the intervention was, therefore, greater among type 1 patients, as demonstrated by larger savings in this sub-group analysis compared to the base case analyses for both the health plan and employer perspectives.
Discussion
Summary
Hypoglycemic events can have a significant economic impact on health plans and employers. In our model, interventions that reduce hypoglycemic events reduced direct medical costs by more than $45 million for a health plan with 10 million enrollees (more than $175 per patient annually) and reduced lost productivity costs by more than $1 million for an employer with 100,000 employees. Since data used to proxy hypoglycemic event reduction were based on insulin suspension, the results of this model may most closely align with the experience of patients with type 1 diabetes, a group that experienced the highest level of cost savings in our model and could potentially benefit the most from such an intervention. However, the results of this model are intended to provide a population-level estimate of the healthcare savings associated with hypoglycemic event reduction in general, and can, therefore, be applied to all patients with diabetes, regardless of treatment regimen.
Several analyses have been conducted that evaluate the cost-effectiveness of diabetic device interventions in reducing hypoglycemic events, with the majority of studies reporting outcomes in terms of incremental cost-effectiveness ratios and quality-adjusted life yearsCitation22–24. While these evaluations are important for determining the long-run societal impact of new medical interventions, they do not provide cost data in a context that is directly relevant to US payers. Limited data exist that evaluate the economic impact of hypoglycemic events from a US health plan and employer perspective. A recent analysis by Bronstone et al. estimates the cost savings associated with reduced hypoglycemic hospitalizations among a hypothetical health plan of 10 million enrolleesCitation25. Results suggest cost savings of $946–$1346 per patient with the use of real-time continuous glucose monitoring for patients with type 1 diabetes. While these estimates are slightly higher than the per patient cost savings in our analysis, it is important to note that the analysis by Bronstone et al. evaluated hospitalization costs alone, which may over-estimate average healthcare costs (our analysis includes inpatient, emergency department, and outpatient costs, which are more representative of the average patient experience). Our analysis further expands on the analysis of Bronstone et al.Citation25 by including estimates for both patients with type 1 and type 2 diabetes, as well as the impact of productivity from the employer perspective.
Limitations
This study is subject to certain limitations, primarily due to data availability and necessary model assumptions. Specifically, clinical trial data was used to model the efficacy of the intervention, which may not be representative of the clinical benefits experienced in real-world practice. In order to address this limitation, a range of efficacy values was employed for the intervention scenario in the form of a sensitivity analysis. Furthermore, not all model inputs were available for both type 1 and type 2 patients; therefore, many data inputs were assumed to be applicable to all patients with a diabetes diagnosis (e.g. intervention efficacy, severe event costs). For instance, the rate of severe hypoglycemia for type 1 patients was derived from DCCT data (a study with only type 1 diabetes patients); however, severe hypoglycemic events were only defined as requiring “third-party assistance” in the DCCT protocol. In order to abide by the model’s definition of severe hypoglycemia (i.e. requiring medical assistance), this data input needed to be multiplied by the proportion of third-party-assisted hypoglycemic events that were documented as “medical” in the ACCORD trial; a clinical trial that was only comprised of type 2 diabetes patients. It is likely that the assistance needed for severe hypoglycemic events differ between type 1 and type 2 patients; however, data limitations required this input be used for both patient types.
Additionally, more recent clinical trials have provided incidence estimates of severe hypoglycemia that are lower than those established in the DCCT. This could be for various reasons, including improvements in continuous glucose monitoring technology and diabetes management over time. Inputs directly estimated from DCCT, while reliable and common among modeling exercisesCitation26, may not be representative of the current clinical environment. A sensitivity analysis was, therefore, conducted utilizing data from a 2008 publication by the Juvenile Diabetes Research Foundation, which provided data on severe hypoglycemic events among patients with type 1 diabetes treated with insulin and continuous glucose monitoringCitation27. These incidence estimates are in line with recent type 1 diabetes registry resultsCitation28, and when used as model inputs in the health plan perspective (0.20 type 1 adult, 0.179 type 1 children), the scenario with the intervention produced annual cost savings of $135 PPPY (range = $39–$169 PPPY) compared to the scenario without the intervention. These results are similar to, but lower than, the base case annual cost savings of $177 PPPY (range = $51–221 PPPY); the lower cost savings were driven by fewer severe hypoglycemic events experienced by the patient population with and without the intervention. A similar result was observed from the employer perspective. However, it should be noted that results from the employer perspective in our model may be under-estimated given that they do not take into account increased medical care coverage resulting from the implementation of the Affordable Care ActCitation29.
The direct cost of non-severe hypoglycemic events was assumed to be zero in this analysis, given that these events were defined as not requiring medical assistance. However, it is likely that multiple non-severe events could result in an increased number of outpatient visits in order to accurately titrate the patient’s therapeutic regimen. Therefore, costs for non-severe events may be under-estimated in the model. A similar scenario arises in the case of non-compliance. While patient adherence to therapy is not included in this analysis, low rates of adherence could have an impact on per-patient costs for numerous reasons, such as increasing the need for physician visits that focus on treatment compliance education. Additionally, the treatment for patients with type 2 diabetes in the model may include other therapeutic components (e.g. oral antidiabetic therapy) in addition to insulin. For this reason, the cost reduction for type 2 patients due to the insulin-specific intervention data may be over-estimated in our analysis. However, the range of intervention efficacy used to calculate the final model results should adequately address this limitation.
The cost of the intervention and market penetration (or uptake of the intervention) were not included as inputs in this analysis. Further studies which evaluate the cost-effectiveness and/or budgetary impact of specific interventions aimed at preventing hypoglycemia are warranted. The primary goal of our analysis was to provide baseline estimates of event rates and cost reductions, which will be useful inputs for such analyses. Additional societal impacts, such as quality-of-life, were also not included in our analysis. Quality-of-life has been shown to improve in patients who experience fewer hypoglycemic eventsCitation30, which may provide further implications for these study results.
Conclusions
Insulin-treated patients are at high risk of hypoglycemia, which is associated with a significant financial burden in addition to its clinical burden. Payers, providers, and employers should consider medical interventions which can reduce hypoglycemic events, leading to potential reductions in direct medical and indirect costs. Future analyses that weigh these economic benefits against the costs and efficacies of such emerging technologies are warranted.
Transparency
Declaration of funding
This study was sponsored by Medtronic Diabetes.
Declaration of financial/other relationships
At the time of study completion and manuscript development, MS, MF, and JM were employees of Boston Health Economics, Inc., who were paid consultants to Medtronic Diabetes in connection with the development of this manuscript. JS, MG, FK, and RV were employees of the sponsor, Medtronic Diabetes, at the time of study completion and manuscript development. SG was a paid consultant to Medtronic Diabetes at the time of study completion and manuscript development. JME peer reviewers on this manuscript have no relevant financial or other relationships to disclose.
Acknowledgments
The authors would like to acknowledge Michael Munsell for his contribution to manuscript development. Michael Munsell is a consultant to Boston Health Economics, Inc.
References
- American Diabetes Association. Standards of Medical Care in Diabetes - 2015. Diabetes Care 2015;38(1 Suppl):S8-S16
- Frier BM. How hypoglycaemia can affect the life of a person with diabetes. Diabetes Metab Res Rev 2008;24:87-92
- Choudhary P, Amiel SA. Hypoglycaemia: current management and controversies. Postgrad Med J 2011;87:298-306
- Elliott L, Fidler C, Ditchfield A, et al. Hypoglycemia event rates: a comparison between real-world data and randomized controlled trial populations in insulin-treated diabetes. Diabetes Ther 2016;7:45-60
- Heaton A, Martin S, Brelje T. The economic effect of hypoglycemia in a health plan. Manag Care Interface 2003;16:23-7
- Quilliam BJ, Simeone JC, Ozbay AB, et al. The incidence and costs of hypoglycemia in type 2 diabetes. Am J Manag Care 2011;17:673-80
- Brod M, Christensen T, Thomsen TL, et al. The impact of non-severe hypoglycemic events on work productivity and diabetes management. Value Health 2011;14:665-71
- Golden SH, Brown T, Yeh HC, et al. Methods for insulin delivery and glucose monitoring: comparative effectiveness. AHRQ comparative effectiveness reviews. Rockville, MD: Agency for Healthcare Research and Quality (US), 2012
- Bergenstal RM, Klonoff DC, Garg SK, et al. Threshold-based insulin-pump interruption for reduction of hypoglycemia. N Engl J Med 2013;369:224-32
- The Henry J Kaiser Family Foundation. Workers by Occupational Category, states (2010-2011), U.S. (2011). Census Bureau March 2011 and 2012 Current Population Survey 2011. Menlo Park, CA: The Henry J Kaiser Family Foundation, Urban Institute, 2011. Available at: URL: http://www.statehealthfacts.org/comparemaptable.jsp?ind=748&cat=1. Accessed June 23, 2016
- Howden L, Meyer J. United States Census Bureau: Age and Sex Composition 2010. Washington, D.C.: U S Department of Commerce, 2011. Available at: URL: www.census.gov/population/age/data/2010comp.html. Accessed April 27, 2015
- Centers for Disease Control and Prevention. National diabetes fact sheet: National estimates and general information on diabetes and prediabetes in the United States, 2011. Atlanta, GA: U.S. Department of Health and Human Services, Centers for Disease Control and Prevention, 2011
- Centers for Disease Control and Prevention NCfHS. Summary Health Statistics for U.S. Adults: National Health Interview Survey. Hyattsville, MD: U S Department of Health and Human Services, 2012
- Bureau of Labor Statistics. National compensation survey: occupational earnings in the United States 2010. Washington, D.C.: Bureau of Labor Statistics, 2011. Available at: URL: http://www.bls.gov/ncs/. Accessed June 23, 2016
- The Henry J Kaiser Family Foundation. Medicare and nonelderly people with disabilities. Menlo Park, CA: The Henry J Kaiser Family Foundation, Urban Institute, 2010. Available at: URL: http://www.kff.org/medicare/upload/8100.pdf. Accessed June 23, 2016
- Caplan C. What share of beneficiaries' total health care costs does medicare pay? AARP Public Policy Institute, Washington, D.C.: Data Digest; 2002. Report No.: 2002:78
- Diabetes Control and Complications Trial Research Group. Effect of intensive diabetes treatment on the development and progression of long-term complications in adolescents with insulin-dependent diabetes mellitus: Diabetes Control and Complications Trial. Diabetes Control and Complications Trial Research Group. J Pediatr 1994;125:177-88
- Miller ME, Bonds DE, Gerstein HC, et al. The effects of baseline characteristics, glycaemia treatment approach, and glycated haemoglobin concentration on the risk of severe hypoglycaemia: post hoc epidemiological analysis of the ACCORD study. BMJ 2010;340:b5444
- Heller SR, Choudhary P, Davies C, et al. Risk of hypoglycaemia in types 1 and 2 diabetes: effects of treatment modalities and their duration. Diabetologia 2007;50:1140-7
- Rhoads GG, Orsini LS, Crown W, et al. Contribution of hypoglycemia to medical care expenditures and short-term disability in employees with diabetes. J Occup Environ Med 2005;47:447-52
- Ly TT, Nicholas JA, Retterath A, et al. Effect of sensor-augmented insulin pump therapy and automated insulin suspension vs standard insulin pump therapy on hypoglycemia in patients with type 1 diabetes: a randomized clinical trial. JAMA 2013;310:1240-7
- Huang ES, O'Grady M, Basu A, et al. The cost-effectiveness of continuous glucose monitoring in type 1 diabetes. Diabetes Care 2010;33:1269-74
- Kamble S, Schulman KA, Reed SD. Cost-effectiveness of sensor-augmented pump therapy in adults with type 1 diabetes in the United States. Value Health 2012;15:632-8
- Ly TT, Brnabic AJ, Eggleston A, et al. A cost-effectiveness analysis of sensor-augmented insulin pump therapy and automated insulin suspension versus standard pump therapy for hypoglycemic unaware patients with type 1 diabetes. Value Health 2014;17:561-9
- Bronstone A, Graham C. the potential cost implications of averting severe hypoglycemic events requiring hospitalization in high-risk adults with Type 1 Diabetes Using real-time continuous glucose monitoring. J Diabetes Sci Technol 2016.
- Tarride JE, Hopkins R, Blackhouse G, et al. A review of methods used in long-term cost-effectiveness models of diabetes mellitus treatment. Pharmacoeconomics 2010;28:255-77
- Tamborlane WV, Beck RW, Bode BW, et al. Continuous glucose monitoring and intensive treatment of type 1 diabetes. N Engl J Med 2008;359:1464-76
- Miller KM, Foster NC, Beck RW, et al. Current state of type 1 diabetes treatment in the U.S.: updated data from the T1D Exchange clinic registry. Diabetes Care 2015;38:971-8
- Powers AC, Wexler JA, Lash RW, et al. Affordable Care Act Implementation: Challenges and Opportunities to Impact Patients With Diabetes. J Clin Endocrinol Metab 2016;101:1315-17
- McBride M, Eggleston A, Ly T, Jones T. Health-related quality of life in patients with type 1 diabetes and impaired hypoglycaemia awareness: the role of sensor-augmented insulin pump therapy with automated insulin suspension. ISPOR 16th Annual European Congress and 4th Latin America Conference, Dublin, Ireland. 2014. November 2-6, 2013
- Bonds DE, Miller ME, Dudl J et al. Severe hypoglycemia symptoms, antecedent behaviors, immediate consequences and association with glycemia medication usage: secondary analysis of the ACCORD clinical trial data. BMC Endocr Disord 2012;12:5
- Mayfield JA, White RD. Insulin therapy for type 2 diabetes: rescue, augmentation, and replacement of beta-cell function. Am Fam Physician 2004;70:489-500