
Abstract
Background: Tuberous sclerosis complex (TSC) is a multi-system genetic disorder in which renal manifestations occur in ∼50% of children and 80% of adults. Since these often present alongside other manifestations, renal TSC is likely to incur significant costs. This study aims to quantify healthcare resource use (HCRU) and costs for renal TSC patients in the UK.
Methods: TSC patients in the Clinical Practice Research Datalink (CPRD) linked to Hospital Episodes Statistics were identified from January 1987–June 2013. Clinical data were extracted over the entire history and costs were reported over the most recent 3-year period. HCRU was compared with a matched comparator cohort. Incremental costs were reported and the key cost drivers by primary manifestation category were identified by regression modeling.
Results: A total of 79 renal TSC patients were identified with manifestations including chronic kidney disease stage 3–5 (with prevalence increasing with age) and renal angiomyolipoma. Renal TSC patients consistently reported greater HCRU than the comparator. Inpatient hospitalizations were more frequent for renal TSC patients (3.2 vs 1.6), but length of stay was comparable; however, 70.9% of renal TSC patients recorded no kidney-related procedures ever and averaged <1 test per year in the 3-year period. Average costs for renal TSC patients were nearly 3-fold greater than the comparator (£15,162 vs £5672). Costs increased with additional manifestation categories (£3600: only renal; £27,531: renal with ≥4 additional manifestation categories [25% of patients]). Additional nervous system and dermatology/psychiatric manifestations significantly (p < 0.028) affected costs.
Conclusions: Renal TSC patients have greater HCRU than the general CPRD population, likely to result from progression of renal disease and additional manifestations; however, surveillance for disease progression appears to be deficient. Inadequate monitoring may contribute to a lack of co-ordinated care and increased healthcare-associated costs. Efforts should be made to follow the TSC guidelines to effectively monitor and treat patients.
Introduction
Tuberous sclerosis complex (TSC) is a rare genetic disorder characterized by the formation of benign growths in multiple organ systemsCitation1. The central nervous system (CNS), dermatological, renal, respiratory, and circulatory systems are commonly affectedCitation1–4. It is estimated that nearly 1 million people worldwide have TSCCitation5, of whom ∼8000 are in the UKCitation6. A definitive diagnosis can be established by identification of a TSC1 or TSC2 pathogenic mutationCitation7–9 (detected in ∼85–90% of cases)Citation10–16, which leads to the activation of the mechanistic target of rapamycin complex 1 (mTORC1) pathway and up-regulation of cell growth and protein synthesisCitation17.
By adulthood, 60–80% of TSC patients will have developed renal manifestationsCitation18–20, and most deaths over the age of 30 in TSC patients can be attributed to renal diseaseCitation21. Renal involvement manifests as renal angiomyolipomas, cysts, malignant tumors, polycystic kidney disease, and renal insufficiencyCitation22–24. Renal angiomyolipomas and cysts begin developing in 55–80% of childrenCitation23,Citation25 and become more severe in adultsCitation26,Citation27, where roughly 80% of patients may present with this manifestationCitation28. Renal angiomyolipomas are also the most common renal manifestationCitation24 and often present bilaterally and in multiplesCitation15,Citation24,Citation29. Renal angiomyolipomas increase in size over time; once they grow large (>3–4 cm), patients become at risk of life-threatening hemorrhageCitation24 due to inelastic blood vessels, characteristic of renal angiomyolipomas, which are susceptible to ruptureCitation21,Citation30. These lesions are associated with decreased kidney function and moderate-to-severe chronic kidney disease (CKD)Citation24; this increases healthcare resource use (HCRU) and carries an associated 5-times greater mortality riskCitation30. Advanced CKD can lead to serious cardiovascular complications resulting from the hypertension and dyslipidemias promoted by renal insufficiencyCitation31. CKD has been shown to progress more quickly in TSC patients than the general population and is related to morbidity and mortalityCitation24.
Renal cysts manifest in 14–32%Citation18,Citation19,Citation32 of TSC patients and most often present as a single cyst or small, multiple, asymptomatic lesionsCitation25. A less common presentation of renal cysts involves co-manifestation with polycystic kidney disease, characterized by a multitude of symptomatic large cysts and poor patient prognosesCitation29. The manifestation of renal cysts occurs due to the close proximity between the TSC2 locus and the polycystic kidney disease gene (PKD1), which are pre-disposed to contiguous deletionsCitation33.
TSC guidelines recommend regular monitoring and surveillance of TSC patientsCitation1, and annual screening of those with established renal manifestationsCitation26. Ultrasonography, computed tomography (CT), and magnetic resonance imaging (MRI) are indicated to monitor the progression of renal angiomyolipomasCitation15. However, there is the potential for missed diagnoses because ultrasounds are often the only imaging method availableCitation18, and renal angiomyolipomas <4 cm may be missedCitation34. This is particularly concerning since a recent study examining the epidemiology of renal manifestations in TSC reported 89% of patients had undergone ultrasound, but only 17% had a CT and/or MRICitation29.
Treatment of renal angiomyolipomas and other renal manifestations of TSC focuses on preventing acute events (such as hemorrhage), maintaining renal parenchyma, and preserving long-term kidney functionCitation30. Previously, progression of renal manifestations necessitated the performance of nephrectomy or nephron-sparing procedures in less severe patientsCitation15,Citation29,Citation30. The International TSC consensus recommendations now suggest mTOR inhibitors as the first choice treatment to reduce the size or prevent progression of asymptomatic growing renal angiomyolipomas >3 cm to preserve renal function and avoid recurrenceCitation35.
Previous studies indicate that renal manifestations including renal angiomyolipomas and CKD incur substantial costs and HCRUCitation24, but little is known about how these compare with the general population, including in the UK. Additionally, as TSC is a complex disease requiring co-ordinated care for effective management, there is the potential for unmet need in the renal TSC population due to the requirement for vigilant surveillance, monitoring, and the diverse range of treatmentsCitation1,Citation26. This study aims to explore the HCRU, treatment patterns, and associated costs of a group of renal TSC patients in comparison with the general population in actual clinical practice.
Methods
Study design and data source
This retrospective cohort study utilized data from routinely collected electronic medical record (EMR) datasets in England between January 1987 and June 2013.
Primary care data were derived from the Clinical Practice Research Datalink (CPRD), and secondary care was analyzed from linked Hospital Episode Statistics (HES) data. This allowed patients to be tracked through both primary and secondary care.
The CPRD contains ∼4.4 million active patients from over 670 primary care practices throughout the UK, representing ∼6.9% national coverage. Previous studies have validated the representativeness of CPRDCitation36–38.
Data in the CPRD contains patient demographics, clinical diagnoses, consultations, primary care prescription medications, laboratory tests, and specialist referrals. Approximately 50% of CPRD practices are linked to HES data by anonymous patient identifiers, with records available between 1997–2012. HES includes all inpatient and outpatient visits at NHS hospitals in England and captures data including patient demographics, clinical diagnoses, procedures, imaging, tests, hospitalizations and discharge details.
Study population
TSC cohort
Patients were required to have a recorded diagnosis of TSC (Read codes, PK5.00, PK5.12; ICD-10 code, Q85.1) between 1 January 1987 and 30 June 2013 and at least 3 years of continuous data prior to the last available record (i.e. date of transfer out of the CPRD practice, death, or other record) during the period of CPRD-HES linkage (1 April 1997 to 31 March 2012)Citation4. Data were included for the entire available history in order to detect diagnoses, tests, and procedures which may occur infrequently throughout a patient’s lifetime.
Continuous data were required to minimize the effects of sub-optimal data recording in the CPRD and HES for the accurate calculation of HCRU and associated costs. Patients with no healthcare records (e.g. repeat prescriptions, administrative activities) during the 3-year period were likely to be inactive. TSC patients were expected to have healthcare encounters at least yearly (and every 1–3 months for those on continuous medication) and, thus, those who did not fulfil this criteria had incomplete records and were excluded. Case report reviews were conducted on the excluded patients.
For the included patients, records were grouped by affected organ system in a TSC clinical code library—the Medical Inventory of TSC Organ System Codes (MedITOSC)—which was used to systematically assess the population (). Seven primary manifestation categories (hereafter referred to as “primary manifestations”) affected by TSC were identified: brain (structural), nervous system, psychiatric, kidney & urinary tract, heart/circulatory system, dermatological system, and respiratory system.
Table 1. Medical inventory of TSC primary organ system codes (MedITOSC).
Renal TSC cohort
A sub-population of patients with renal manifestations was derived from the TSC cohort () according to the presence of selected diagnostic codes.
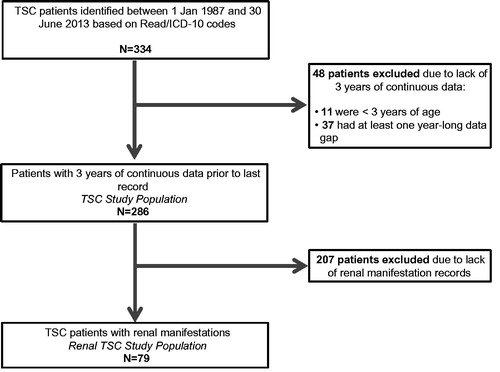
Figure 1. Patient exclusion criteria to arrive at the TSC study population and the Renal TSC study population.
All available history was extracted for each renal TSC patient, including demographic (gender and age) and clinical data (diagnoses, symptoms, prescription medications, investigations and procedures, including surgical interventions and imaging tests). Procedures were defined as surgical and non-surgical interventions (such as dialysis and nephrectomy) and prescription information was only available for treatments issued in primary care. GP visits, outpatient visits, and inpatient admissions were also captured by episode.
Comparator cohort
Comparator patients were matched to each TSC patient at a 1:5 ratio by age, sex, and date of last record (within the same calendar year) to generate 1430 and 395 comparator patients for all TSC and renal TSC patients, respectively. Large comparator cohorts were extracted to better characterize expenditure and outcomes in a group expected to have comparatively fewer encounters. The comparator cohort was required to have at least 3 years of data, and at least one healthcare record during this period (in addition to the last record) to ensure a more representative and active control comparator rather than biasing the cohort to include “sicker” patients by requiring an encounter in each of the 3 years. The inclusion of control patients without yearly healthcare encounters is supported by results from a large, national GP survey in England which reported that 28% of respondents had not visited their GP during the last 6 monthsCitation39.
Data analyses
Patient demographics and healthcare resource utilization
Demographics are reported as summary statistics for the renal TSC and comparator cohorts. Age was determined at the beginning of the 3-year period of continuous data and was used to stratify patients into adult (≥18 years) and pediatric (<18 years) populations. Pediatric analyses were included only in the distribution of specific renal conditions, since the sample size of pediatric patients (n = 8) was too small for comparative analyses.
Primary care drug prescriptions (including repeats, by British National Formulary [BNF] chapter), procedures and surgical interventions, selected kidney-related procedures, and diagnostic tests and investigations are reported throughout the entire patient history and compared between renal TSC and the renal comparator cohort. Diagnostics are divided into “as required” and routine according to the TSC Guidelines, reflecting tests which should be conducted as deemed necessary and on a regular basisCitation26. All analyses are reported as summary statistics. Continuous variables are presented as means with standard deviations (SD) or 95% confidence intervals (CIs), or median values with interquartile ranges. Categorical variables are reported as frequencies and percentages, along with 95% confidence intervals, where appropriate.
HCRU was determined over the 3-year period of continuous data and compared between renal TSC and comparator cohorts. Drug prescriptions (including repeats), procedures and surgical interventions, diagnostic tests and investigations, GP visits, inpatient stays, and outpatient visits (by specialty) were determined.
Analyses were conducted using SAS version 9.4.
Direct costs analysis
Personal Social Services Research Unit (PSSRU) unit costs were used to estimate GP consultation costs for an average length of consultation (by consultation type), as derived from the 2006/7 UK General Practice Workload SurveyCitation40,Citation41. As PSSRU provided alternative costs for clinical consultations by length of consultation, the lengths recorded in the CPRD were used to allocate the correct cost. Secondary care costs and primary care drug therapy costs were estimated using the National Schedule of Reference CostsCitation30 and Health and Social Care Information Centre dataCitation31, respectively. All costs were derived from the most recent available sources and inflated to 2014 costs, where required. Healthcare costs outside the NHS (e.g. private healthcare) and costs in social care were not included.
Average costs were determined per renal TSC patient over the 3-year period of continuous data. Costs associated with GP visits, outpatient visits, inpatient stays, and drugs are compared with the comparator cohort.
Costs of manifestations were also determined for renal TSC patients without any additional manifestation categories and incrementally assessed when patients presented with 1–4 additional manifestation categories. Specific manifestation combination costs (including nervous system and dermatological with renal) were also calculated.
Key drivers of TSC renal direct costs
Two regression models were developed to explore the impact of primary manifestations (aside from kidney & urinary) on healthcare costs in the renal TSC cohort. Gamma distribution models were implemented to account for the non-normal distribution of the dependent variables (i.e. total costs over the 3-year period).
The first model assessed the relationship of the primary manifestation categories with total healthcare costs, when presented independently and in combination with other manifestations. Manifestation involvement was determined over the entire history of each renal TSC patient, but cost analyses were conducted over the 3-year period of data only. Pairwise combinations were used to elucidate which organ manifestations jointly impacted costs, since TSC patients have several simultaneous features.
The first model incorporated the following independent variables into the gamma distribution regression: age category (<18 and ≥18 years) for the age at last record, sex, and specific primary manifestations involved (brain [structural], circulatory, dermatological, nervous system, psychiatry, and respiratory). Pairwise interactions were analyzed separately for each of the six primary manifestation categories.
The second model was implemented to determine whether increasing the number of primary manifestations (by category) significantly impacted costs. The following independent variables were incorporated into the gamma distribution regression: age category (<18 and ≥18 years) for the age at last record, sex, and the number of organ system manifestations per patient (ranging from 1 to ≥4). Subsequently, a comparison was made between the number of primary manifestation categories involved (e.g. one primary manifestation category vs two primary manifestation categories).
In each model, p-values were derived from Wald tests, and values less than 0.05 were considered to be statistically significant.
Ethics
Independent Scientific Advisory Committee for Medicine and Healthcare Products Regulatory Agency Database Research approval was obtained for this study on 20 April 2015 (Protocol 13_146A).
Results
We identified 334 TSC patients. After applying the inclusion and exclusion criteria, the TSC study cohort included 286 patients, and the matched comparator included 1,430 patients. Among the 48 excluded patients, only 10 had renal manifestations. In order to ensure the included TSC population was not biased, case report reviews were conducted on the 48 excluded patients. Eleven were under the age of 3 years and, thus, had less than 3 years of available data. Of the remaining 37 patients, 50% recorded TSC-related manifestations including epilepsy, renal angiomyolipomas, and subependymal giant cell astrocytoma (SEGA) during their entire history (). The proportion of these patients recording inpatient admissions and outpatient (specialist) visits were comparable to the included TSC patients (16% excluded vs 16% included; 84% excluded vs 93% included, respectively), but primary care encounters such as prescriptions and GP visits were recorded in much lower proportions (22% excluded vs 73% included).
Of the 286 TSC patients who fulfilled the inclusion criteria, 79 patients recorded codes indicating renal manifestations and were included as the renal TSC population. Three hundred and ninety-five patients from the general CPRD population were matched to these patients as the comparator cohort.
Patient demographics
The age and gender distribution of renal TSC and comparator patients can be seen in . The mean age at the beginning of the 3-year period of data was 38.3 (SD =17.1) years, and the population was 46.7% female. The renal cohort had 71 adult patients ≥18 years old (89.9%) and eight patients under 18 (). Renal TSC patients had a median 22.2 years of patient history (IQR =16–24), similar to the 20.7 years of the comparator (IQR =16–24).
Figure 2. Age and sex distribution of renal TSC and comparator cohort patients. * Age is defined at the beginning of the 3-year period.
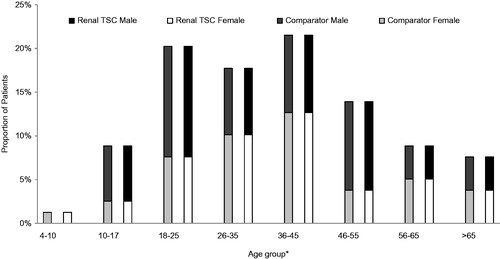
Table 2. Renal involvement in TSC.
Renal TSC clinical characteristics
The distribution of renal manifestations can be seen in . Neoplasms (including renal angiomyolipomas) were the most common manifestation in 46.5% (95% CI =35–58%) of adult patients and 50.0% (5–95%) of pediatric patients. Analyses indicated that hematuria was the most common co-morbidity in pediatric renal TSC patients (25.0% [95% CI =0–63%]), and anemia was the most common in adult renal TSC patients (23.9% [14–34%]). Prevalence of hematuria ranged from 10–30% across age bands (). Slightly more males than females recorded hematuria (68.4% vs 31.6%) and slightly more females than males recorded CKD stage 3–5 (60.0% vs 40.0%), but patient numbers were small (hematuria: n = 19, CKD stage 3–5: n = 30).
Figure 3. Proportions of renal TSC patients with specific renal conditions.
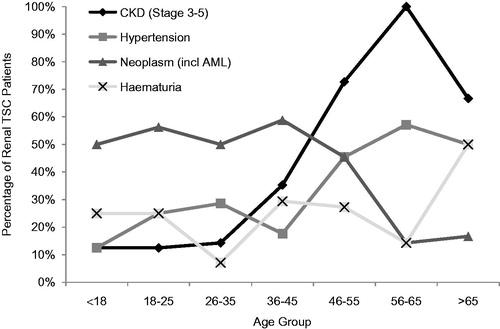
Table 3. Distribution of manifestations in renal TSC patients.
Table 4. Renal-related procedures conducted in TSC and comparator patients during their entire history.
Selected renal manifestations and complications were profiled according to the specific age bands in to determine any age-associated trends. It was found that the prevalence of CKD stage 3–5 and hypertension increased with age (12.5% in <18 to 66.7% in >65 for CKD; 12.5–50.0% for hypertension).
Drugs prescribed in primary care to renal TSC patients vs the comparator cohort
Prescriptions over the entire history were reported for proportions of patients by BNF chapter designation. The proportion of renal TSC patients receiving anti-epileptic medications was more than 3-fold greater than the comparator cohort (68.4% [95% CI = 58–79%] vs 17.5% [14–21%]). Interestingly, a greater proportion of renal TSC patients also received thyroid hormones (13.9% [6–22%] vs 1.0% [0–2%]) and medications for megaloblastic anemia (10.1% [3–17%] vs 5.3% [3–8%]). These require further examination before drawing any conclusions.
Medical procedures and surgical interventions conducted in TSC patients vs the comparator cohort
Medical procedures and surgical interventions were analyzed over the entire patient history. Most renal TSC patients recorded no kidney-related procedures or interventions ever (70.9% [95% CI =61–81]), and patients averaged 0.9 (0–2) interventions throughout their entire history; 13.9% [6–22%] and 6.3% [1–12%] of TSC patients recorded one or two kidney-related procedures, respectively. When examining procedures by type, embolization and nephrectomy were the most common procedures, conducted in 13.9% [6–22%] of patients for both procedures. Elective embolization (10.1% [3–17%]) and complete nephrectomy (7.6% [2–14%]) were the most common sub-types of these procedures ().
As expected, the comparator group recorded these and other renal-related procedures in less than 1% of patients.
Diagnostic tests and investigations conducted in renal TSC patients vs the comparator cohort
Records of routine tests (including computed tomography [CT], MRI, and ultrasound) were analyzed over the patient’s entire history. Slightly more than one-third of renal TSC patients recorded a CT (35.4% [95% CI =25–46%]), while 22.8% [13–32%] recorded MRI and 38.0% [27–49%] recorded ultrasound testing ever in their history. Lower proportions of patients recorded “as required” tests: only one fifth (20.3% [11–29%]) recorded electrocardiogram (ECG) and 13.9% [6–22%] recorded electroencephalogram. Overall, more than one quarter of patients (27.9% [18–38%]) recorded no diagnostic tests or investigations ever and patients averaged 2.3 (2–3) tests over their entire history. The comparator cohort had all routine and as required tests and investigations recorded in substantially lower proportions ().
Table 5. Renal-related tests and investigations conducted in TSC and comparator patients during their entire history.
Healthcare encounters in renal TSC patients vs the comparator cohort
Healthcare encounters are detailed in for the renal TSC and comparator cohorts over the 3-year period. Renal TSC patients recorded over 2-fold more frequent GP consultations (excluding administration records) than the comparator cohort (average visits per patient: 81.7 [95% CI =61–102%] vs 30.2 [26–34%]). Inpatient hospitalizations were 2-fold more frequent in renal TSC patients than the comparator cohort (3.2 [2–4] vs 1.6 [1–2]) (), but the length of stay was similar (median =2 days [IQR =1–5] vs 1 day [1–2]).
Table 6. Primary and secondary healthcare encounters in TSC and comparator cohort during the most recent 3-year period.
When considering outpatient visits, TSC patients recorded nearly 3-fold more frequent visits than the comparator cohort (15.4 average visits per patient [12–19] vs 5.7 [5–7]) (). Furthermore, renal TSC patients reported an average of 1.6 visits per patient (95% CI = 1–2) to the nephrologist and 0.9 visits to the urologist (0–1) over the 3-year period, in comparison with the comparator cohort with 0 (0) visits per patient for both specialties.
Directs costs of renal manifestations in TSC vs the comparator cohort
HCRU costs were calculated for renal TSC and comparator patients over the 3-year period of data ().
Figure 4. Mean costs per renal TSC patient over the 3-year period by type of healthcare resource used. *Only includes the cost of GP visits (costs of tests conducted at the GP practice are not included). †Costs including GP administration encounters: £3,967 TSC vs £1,505 comparator. ‡Total including GP administration encounters: £15,695 TSC vs £4,765 comparator.
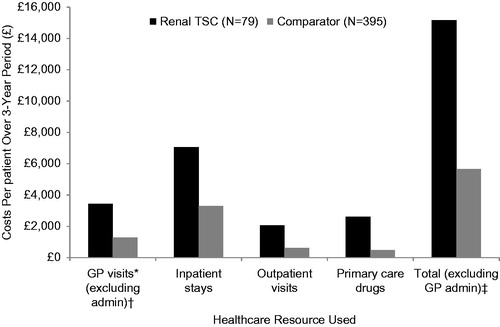
Total average costs for renal TSC patients (excluding GP administration visits) were nearly 3-fold greater than the comparator cohort (£15,162 vs £5,672) on average per patient. All component costs were also substantially greater for renal TSC patients: GP visits were nearly £2000 greater (£3,433 vs £1283), inpatient hospitalizations were more than 2-fold more costly (£7,050 vs £3,298), and outpatient visits and primary care drugs were more than 3-times as costly (outpatient: £2,071 vs £613; primary care drugs: £2,607 vs £479) ().
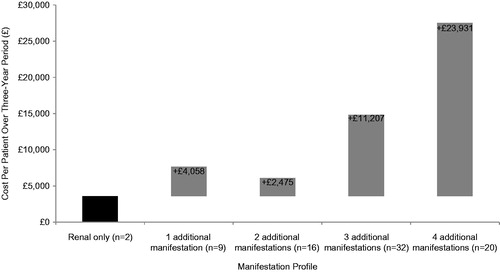
Very few patients presented with only renal manifestations and no additional manifestation categories (3%) and had associated costs of £3,600 over the 3-year period (baseline cost). The addition of one manifestation category incurred £4,058 in incremental costs (11%); two additional categories added £2,475 to baseline costs (20% of patients), and the addition of three added £11,207 (41% of patients). Renal TSC with four additional manifestation categories was the costliest presentation, with £23,931 added to the initial £3,600 (25% of patients) (). When examining specific manifestation categories, adding nervous system and dermatological manifestations (present in 61.8% of the TSC patient population) incurred £13,931 in additional costs to renal TSC patients.
Figure 5. Cost of additional manifestation categories to renal TSC patients.
Key drivers of direct costs in renal TSC patients
The first model assessed the association of primary manifestation categories with total costs for renal TSC patients over the 3-year period of data. Nervous system manifestations (p = 0.0279) and the combination of dermatology/psychiatric manifestations (p = 0.0246) were found to significantly impact costs ().
Table 7. Model 1: Key drivers of direct costs in renal TSC patients during the most recent 3-year period.
The results of model 2 indicated that the number of primary manifestation categories was a significant cost driver (p < 0.0001), while age and sex were not significant (). However, there were only eight patients in the pediatric age category. When looking at specific numbers of manifestation categories, the presence of ≥4 manifestations significantly impacted costs over fewer numbers of manifestations (p < 0.0051) ().
Table 8. Model 2: Key drivers of direct costs in renal TSC during the most recent 3-year period.
Table 9. Model 2: Drivers of direct costs in renal TSC by specific number of primary manifestation categories during the most recent 3-year period.
Discussion
This longitudinal, retrospective study is the first to examine the incremental costs associated with the multiple manifestations of patients with renal diseases in TSC and how the spectrum of these conditions can impact healthcare resource utilization. The investigation complements previous work conducted on the clinical profile of the larger population of TSC patientsCitation4, which were used as the source population for this study.
Renal TSC patients recorded substantially more healthcare encounters than the comparator cohort, ultimately translating into costs which were nearly 3-fold greater. These results represent the considerable healthcare requirements of these patients which appear to be inadequately managed in certain sectors. Severe kidney impairment in TSC has previously been shown to increase HCRUCitation24.
Overall, the most common renal manifestations in TSC patients were neoplasms (including renal angiomyolipomas), occurring in nearly half of adult and pediatric patients. This agrees with previous literature that describes renal angiomyolipomas developing in 55–80% of childrenCitation23,Citation25 and slightly under-estimates the reported 80% prevalence in adultsCitation28. The apparent decrease in renal angiomyolipoma prevalence with age is unexpected, as renal angiomyolipomas do not spontaneously resolve and their prevalence is known to increase with ageCitation3. This observation in our study suggests that many older patients had never had imaging to look for renal involvement, and perhaps those with significant renal involvement died prematurely. As expected, CKD stage 3–5 was found to increase and was present in the majority of patients over 65. CKD is considered to advance more rapidly in patients with TSC, and progression from stage 1–5 is also associated with ageCitation24. The high prevalence of this condition may be a contributor to increased HCRU and patient burdenCitation24.
Renal TSC patients recorded over 2-fold more frequent GP consultations, inpatient hospitalizations and outpatient visits on average per patient over the 3-year period and contributed to costs that were nearly three times higher than the comparator. Their high number of GP consultations indicates that there may be an increased burden on the GP to manage their condition.
A substantially greater proportion of renal TSC patients recorded kidney-related procedures and diagnostic investigations than the Comparator cohort over the entire history, but almost three-quarters of renal TSC patients recorded no kidney-related procedures. Furthermore, current TSC consensus recommendations discourage radical procedures such as nephrectomyCitation26 due to a high risk of complications, renal insufficiency, and end stage renal failureCitation1,Citation35, but these were recorded in 14% of patients. The high prevalence of this procedure could indicate that physicians had few treatment options prior to the licensing of mTOR inhibitors in 2012 and consequently used procedures that are no longer first choices for treatmentCitation35. The recording of radical procedures may also indicate that patients are inadequately managed or present late in the disease stage, rendering radical surgery the only option. The absence of procedures in the majority of renal TSC patients could additionally indicate a lack of appropriate and available treatments.
Although renal TSC patients averaged 3-fold more tests per patient than the comparator, the figure of only 2.3 tests over the entire patient history indicated that these patients were not receiving annual tests as recommended in the TSC management guidelinesCitation17. Furthermore, more than one quarter of renal TSC patients did not record any routine or “as required” tests throughout their history. Together, these results indicate that there is a lack of appropriate surveillance that should be conducted every 1–3 years in order to effectively monitor and treat patientsCitation26.
When examining the manifestation profile of the renal TSC patients, the largest proportion of patients (65%) recorded at least three additional manifestation categories aside from renal. Only 3% of patients presented with renal manifestations alone and were likely to be less severe than the majority of patients who presented with additional manifestations, suggesting an inter-relationship between manifestations in the TSC disease profile. Similarly, previous reports suggest that the majority of TSC patients present with more than three primary system manifestationsCitation4. The addition of multiple manifestations was found to substantially increase HCRU costs over the 3-year period: the addition of one manifestation category more than doubled the costs for renal manifestations only, and the addition of four manifestation categories incurred an additional £23,931. An approach to care including co-ordinated treatment may have the potential to lessen some of these costs by delaying disease progression, as costs were driven by the presence of several manifestation categories (including dermatology, psychiatric, and nervous system manifestations present along with renal in most patients).
The results of this study indicate that TSC patients with renal manifestations have a diverse clinical profile including the addition of other recognized primary TSC manifestation categories. Despite this, surveillance and testing appear to be inadequate, perhaps leading to the greater requirement for procedures, outpatient visits, inpatient admissions, and GP consultations because patients’ disease is inadequately managed by specialist care (evidenced by an average of less than two visits to a nephrologist or urologist over the most recent 3-year period). The overall effect of this may be an increase in costs associated with healthcare resource use, which could be alleviated if patients received more optimal care.
The strength of this study is its sourcing of information from actual clinical practice in the CPRD and HES. Data are captured in both primary and secondary care to provide the most complete picture of patient care and associated costs. The CPRD has also been shown to be representative of patients in the UKCitation36,Citation37; thus, the findings in this study are considered generalizable to the UK TSC population. However, the requirement for continuous data may have biased results towards a comparison of sicker TSC patients with healthier CPRD patients. To account for this, excluded TSC patients were examined on a case-by-case basis which indicated that patients had incomplete primary care data due to age under 3 years, repeated transfers in and out of the CPRD, and poor recording of data, rather than having mild cases of TSC. When comparing secondary care HES data, these patients were comparable to the included TSC patients and were, thus, assumed to have transferred out of their primary care contributing practice, leading to gaps in data. Patients with TSC commonly have two domiciles (parental home and either residential education or respite home), which could result in a proportion of their care being provided by a GP practice not participating in the CPRD. Accordingly, year-plus periods of missing data may be present. Costs and HCRU would have been under-estimated if these patients were included due to their missing data. It is not possible to track patients outside of CPRD-contributing practices and, as such, this approach was considered most amenable to an accurate estimation of healthcare resource use. Multiple imputation was not performed due to potentially unclear patterns of missingness. As such, missing at random assumptions were not fulfilled, which would implicate the reliability of imputing information.
Limitations in this study are typical of those using real-world data, since the information recorded is dependent on the accuracy of the information input by the healthcare professional. Only primary care drugs and associated costs were captured in CPRD, whilst those prescribed in secondary and tertiary care settings are not; thus, drug costs are likely to be under-estimated. Patients seeking care outside of the GP and hospitalizations, e.g. mental health clinics, will also not be captured in the data. It is also difficult to assess completeness or representativeness of TSC-related data recording as the study is limited to only those patients with a recorded diagnosis of TSC and renal complications. Additionally, only eight renal pediatric patients were found, rendering analysis according to age group inconclusive due to small numbers; this may provide further evidence for under-diagnosis due to a lack of monitoring. The relatively small sample size of the renal cohort may also impact the results presented. As renal diseases in TSC are progressive, this may have a longitudinal impact on costs, which may not be captured due to the relative young mean age of the cohort.
A comparison between patients with renal manifestations in TSC was not performed against those with TSC without renal manifestations due to an inherent lack of monitoring and the likelihood that some of the patients may have a developing but undiagnosed renal manifestations. Additionally, comparisons were not made with a population with renal disease and no TSC, as non-TSC renal diseases may manifest in different manners. The overall aim of this paper is to emphasize the impact of renal manifestations in TSC and not to form comparisons between the experience of renal disease in TSC with other unrelated renal diseases.
Prescriptions were determined by BNF chapter rather than indication, which means that drugs prescribed outside of the remit of their BNF chapter (such as some anti-epileptics) may not be captured. Due to the short reporting period following the licensing of mTOR inhibitors, this study was unlikely to capture any changes in resource use that could be related to this treatment. Additionally, primary care HCRU for patients who have transferred out of CPRD at some point will not be captured.
Future studies could compare renal and non-renal TSC patients in order to estimate the true impact of renal manifestations on HCRU. If larger sample sizes were available, further analysis on age stratification of the cohort would also be of value. Other HCRU studies could explore other specific TSC primary manifestation categories in order to identify additional areas of sub-standard care. These studies could also explore indirect costs that are not considered in the current analysis, but may be substantial.
Conclusion
Renal TSC patients have a greater requirement for healthcare resources than the general CPRD population, as demonstrated by more frequent visits and higher associated costs;
The prevalence of CKD stage 3–5 was found to increase with age and may contribute to increased healthcare resource utilization;
Costs associated with renal TSC patients appear to increase as patients present with additional primary manifestation categories; and
Renal TSC patients appear to have a lack of monitoring and testing (as recommended by international guidelines), which may contribute to under-treatment and greater long-term healthcare resource utilization and costs.
Transparency
Declaration of funding
This research was funded by Novartis Pharmaceuticals.
Declaration of financial/other interests
CK has received honoraria from Novartis. PN, MM, and KP are employees of IMS Health, a consulting company that received funding from Novartis to conduct the study. EG and VS are employees of Novartis Pharmaceuticals. JME peer reviewers on this manuscript have no relevant financial or other relationships to disclose.
Acknowledgments
We would like to acknowledge TSC patients, families, and caregivers for their contributions to ongoing TSC initiatives.
References
- Northrup H, Krueger DA. Tuberous sclerosis complex diagnostic criteria update: recommendations of the 2012 Iinternational Tuberous Sclerosis Complex Consensus Conference. Pediatr Neurol 2013;49:243-54
- Rosser T, Panigrahy A, McClintock W. The diverse clinical manifestations of tuberous sclerosis complex: a review. Semin Pediatr Neurol 2006;13:27-36
- Curatolo P, Bombardieri R, Jozwiak S. Tuberous sclerosis. Lancet 2008;372:657-68
- Kingswood C, Bolton P, Crawford P, et al. The clinical profile of tuberous sclerosis complex (TSC) in the United Kingdom: a retrospective cohort study in the Clinical Practice Research Datalink (CPRD). Eur J Paediatr Neurol 2015;20:296-308
- TSA Tuberous Sclerosis Alliance. What is TSC? Silver Spring, Maryland, USA: National Tuberous Sclerosis Association Inc., 2013. http://www.tsalliance.org/pages.aspx?content =2. Accessed June 1, 2015
- TSA Tuberous Sclerosis Alliance. Consultation on the United Kingdom plan for rare diseases: submission from the Tuberous Sclerosis Association. London: Tuberous Sclerosis Alliance, 2012. URL:http://www.google.co.uk/url?sa=t&rct=j&q=&esrc=s&frm=1&source=web&cd=1&ved=0CCIQFjAA&url=http://www.tuberous-sclerosis.org/_literature_124492/TSA_Publications_-_Consultation_on_the_UK_Plan_for_Rare_Diseases&ei=9Y5cVf7-B8jwUqjAgegB&usg=AFQjCN. Published 2012. Accessed June 1, 2015
- van Slegtenhorst M, de Hoogt R, Hermans C, et al. Identification of the tuberous sclerosis gene TSC1 on chromosome 9q34. Science 1997;277:805-8. http://www.ncbi.nlm.nih.gov/pubmed/9242607. Accessed November 13, 2015
- Huang J, Manning BD. The TSC1-TSC2 complex: a molecular switchboard controlling cell growth. Biochem J 2008;412:179-90
- European Chromosome 16 Tuberous Sclerosis Consortium. Identification and characterization of the tuberous sclerosis gene on chromosome 16. Cell 1993;75:1305-15. http://www.ncbi.nlm.nih.gov/pubmed/8269512. Accessed October 1, 2015
- Sancak O, Nellist M, Goedbloed M, et al. Mutational analysis of the TSC1 and TSC2 genes in a diagnostic setting: genotype–phenotype correlations and comparison of diagnostic DNA techniques in Tuberous Sclerosis Complex. Eur J Hum Gene. 2005;13:731-41
- Niida Y, Lawrence-Smith N, Banwell A, et al. Analysis of both TSC1 and TSC2 for germline mutations in 126 unrelated patients with tuberous sclerosis. Hum Mutat 1999;14:412-22
- Kozlowski P, Roberts P, Dabora S, et al. Identification of 54 large deletions/duplications in TSC1 and TSC2 using MLPA, and genotype-phenotype correlations. Hum Genet 2007;121:389-400
- Jones AC, Shyamsundar MM, Thomas MW, et al. Comprehensive mutation analysis of TSC1 and TSC2-and phenotypic correlations in 150 families with tuberous sclerosis. Am J Hum Genet 1999;64:1305-15
- Dabora SL, Jozwiak S, Franz DN, et al. Mutational analysis in a cohort of 224 tuberous sclerosis patients indicates increased severity of TSC2, compared with TSC1, disease in multiple organs. Am J Hum Genet 2001;68:64-80
- Crino PB, Nathanson KL, Henske EP. The tuberous sclerosis complex. N Engl J Med 2006;355:1345-56
- Au KS, Williams AT, Roach ES, et al. Genotype/phenotype correlation in 325 individuals referred for a diagnosis of tuberous sclerosis complex in the United States. Genet Med 2007;9:88-100
- Franz DN, Belousova E, Sparagana S, et al. Efficacy and safety of everolimus for subependymal giant cell astrocytomas associated with tuberous sclerosis complex (EXIST-1): a multicentre, randomised, placebo-controlled phase 3 trial. Lancet (London, England). 2013;381:125-32
- O’Callaghan FJ, Noakes MJ, Martyn CN, et al. An epidemiological study of renal pathology in tuberous sclerosis complex. BJU Int 2004;94:853-7
- Cook JA, Oliver K, Mueller RF, et al. A cross sectional study of renal involvement in tuberous sclerosis. J Med Genet 1996;33:480-4. http://www.pubmedcentral.nih.gov/articlerender.fcgi?artid=1050634&tool=pmcentrez&rendertype=abstract. Accessed November 17, 2015
- Henske EP, Ewalt DH, Bissler JJ. Renal manifestations in tuberous sclerosis complex. Silver Spring, Maryland: Tuberous Sclerosis Alliance, 2006. http://www.tsalliance.org/documents/Renal Manifestations in TSC.pdf. Accessed February 2, 2016
- Pirson Y. Tuberous sclerosis complex-associated kidney angiomyolipoma: from contemplation to action. Nephrol Dial Transplant 2013;28:1680-5
- Rouvière O, Nivet H, Grenier N, et al. [Guidelines for the management of tuberous sclerosis complex renal disease]. Prog Urol 2012;22:367-79
- Dixon BP, Hulbert JC, Bissler JJ. Tuberous sclerosis complex renal disease. Nephron Exp Nephrol 2011;118:e15-e20
- Vekeman F, Magestro M, Karner P, et al. Kidney involvement in tuberous sclerosis complex: the impact on healthcare resource use and costs. J Med Econ 2015;18:1060-70. http://www.tandfonline.com/doi/full/10.3111/13696998.2015.1075995. Accessed November 16, 2015
- Ewalt DH, Sheffield E, Sparagana SP, et al. Renal lesion growth in children with tuberous sclerosis complex. J Urol 1998;160:141-5. http://www.ncbi.nlm.nih.gov/pubmed/9628635. Accessed November 16, 2015
- Northrup H, Koenig MK, Pearson DA, et al. Tuberous Sclerosis Complex. GeneReviews® [Internet]. Seattle (WA): University of Washington, 2015. http://www.ncbi.nlm.nih.gov/books/NBK1220/. Accessed November 13, 2015
- Shepherd CW, Gomez MR, Lie JT, et al. Causes of death in patients with tuberous sclerosis. Mayo Clin Proc 1991;66:792-6. http://www.ncbi.nlm.nih.gov/pubmed/1861550. Accessed November 16, 2015
- Bissler JJ, Kingswood JC, Radzikowska E, et al. Everolimus for angiomyolipoma associated with tuberous sclerosis complex or sporadic lymphangioleiomyomatosis (EXIST-2): a multicentre, randomised, double-blind, placebo-controlled trial. Lancet (London, England) 2013;381:817-24
- Rakowski SK, Winterkorn EB, Paul E, et al. Renal manifestations of tuberous sclerosis complex: Incidence, prognosis, and predictive factors. Kidney Int 2006;70:1777-82
- Eijkemans MJC, van der Wal W, Reijnders LJ, et al. Long-term follow-up assessing renal angiomyolipoma treatment patterns, morbidity, and mortality: an observational study in tuberous sclerosis complex patients in the Netherlands. Am J Kidney Dis 2015;66:638-45
- Schiffrin EL, Lipman ML, Mann JFE. Chronic kidney disease: effects on the cardiovascular system. Circulation 2007;116:85-97
- Webb DW, Kabala J, Osborne JP. A population study of renal disease in patients with tuberous sclerosis. Br J Urol 1994;74:151-4. http://www.ncbi.nlm.nih.gov/pubmed/7921930. Accessed October 16, 2015
- Laass MW, Spiegel M, Jauch A, et al. Tuberous sclerosis and polycystic kidney disease in a 3-month-old infant. Pediatr Nephrol 2004;19:602-8
- Bret PM, Bretagnolle M, Gaillard D, et al. Small, asymptomatic angiomyolipomas of the kidney. Radiology 1985;154:7-10
- Krueger DA, Northrup H. Tuberous sclerosis complex surveillance and management: recommendations of the 2012 International Tuberous Sclerosis Complex Consensus Conference. Pediatr Neurol 2013;49:255-65
- García Rodríguez LA, Pérez Gutthann S. Use of the UK General Practice Research Database for pharmacoepidemiology. Br J Clin Pharmacol 1998;45:419-25 http://www.pubmedcentral.nih.gov/articlerender.fcgi?artid=1873548&tool=pmcentrez&rendertype=abstract. Accessed September 4, 2015
- Williams T, van Staa T, Puri S, et al. Recent advances in the utility and use of the General Practice Research Database as an example of a UK Primary Care Data resource. Ther Adv drug Saf 2012;3:89-99
- Herrett E, Gallagher AM, Bhaskaran K, et al. Data Resource Profile: Clinical Practice Research Datalink (CPRD). Int J Epidemiol 2015;44:827-36
- Ipsos Mori. GP Patient Survey - National Summary Report. London: Ipsos Mori, 2014. http://gp-survey-production.s3.amazonaws.com/archive/2014/July/1301375001_Y8W2 National Summary Report_FINAL v1.pdf. Accessed August 6, 2015
- NHS Business Services Authority. NHS Drug Tariff. Surrey, UK: NHS Business Services Authority, 2102. http://www.nhsbsa.nhs.uk/PrescriptionServices/4940.aspx. Accessed August 1, 2015
- Department of Health. NHS Reference Costs. London: Department of Health, 2015. https://www.gov.uk/government/collections/nhs-reference-costs. Accessed August 1, 2015