
Abstract
Aims: Adverse events (AEs) associated with treatments for metastatic colorectal cancer (mCRC) may compromise the course of treatment, impact quality-of-life, and increase healthcare resource utilization. This study assessed the direct healthcare costs of common AEs among mCRC patients in the US.
Methods: Adult mCRC patients treated with chemotherapy or targeted therapies were identified from administrative claims databases (2009–2014). Up to the first three mCRC treatment episodes per patient were considered and categorized as with or without the AE system/organ category during the episode. Total healthcare costs (2014 USD) were measured by treatment episode and reported on a monthly basis. Treatment episodes with the AE category were matched by treatment type and line of treatment to those without the AE category. Adjusted total cost differences were estimated by comparing costs during treatment episodes with vs without the AE category using multivariate regression models; p-values were estimated with bootstrap.
Results: A total of 4158 patients with ≥1 mCRC treatment episode were included (mean age = 59 years; 58% male; 60% with liver and 14% with lung metastases; 2,261 [54%] with a second and 1,115 [27%] with a third episode). On average, two treatment episodes were observed per patient with an average length of 166 days per episode. Adjusted monthly total cost difference by AE category included hematologic ($1,480), respiratory ($1,253), endocrine/metabolic ($1,213), central nervous system (CNS; $1,136), and cardiovascular ($1,036; all p < .05).
Limitations: Claims do not include information on the cause of AEs, and potentially less severe AEs may not have been reported by the physician when billing the medical service. This study aimed to assess the association between costs and AEs and not the causation of AEs by treatment.
Conclusions: The most costly AEs among mCRC patients were hematologic, followed by respiratory, endocrine/metabolic, CNS, and cardiovascular.
Introduction
Colorectal cancer (CRC) is the third most commonly diagnosed cancer among men and the second most commonly diagnosed among women, with ∼42.4 new cases and 15.5 deaths per 100,000 individuals each year in the USCitation1–3. Approximately 20% of patients with CRC already have metastatic disease (mCRC) at the time of diagnosis, and up to 50% of CRC patients diagnosed at an early stage will develop metastases over the course of their diseaseCitation1–3. The 5-year survival rate of patients with metastatic CRC (mCRC) is very low, being estimated at 13%Citation3.
The National Comprehensive Cancer Network (NCCN) clinical practice guidelines recommend several treatment options for mCRCCitation4. The choice of therapy is based on the goals of therapy, whether palliative or curative, the type and timing of prior therapy, the distinct toxicity profiles of the constituent drugs, and the molecular characteristics of the tumorCitation4. Until recently, the chemotherapy regimens of fluorouracil and leucovorin in combination with oxaliplatin (FOLFOX) or irinotecan (FOLFIRI) have been the standard chemotherapy for the treatment of mCRCCitation5,Citation6. However, targeted therapies including anti-vascular endothelial growth factors (anti-VEGFs; bevacizumab, ramucirumab, and ziv-aflibercept), anti-epidermal growth factor receptors (anti-EGFRs; cetuximab, and panitumumab), and the multi-kinase inhibitor regorafenib have now been recognized as effective mCRC treatmentsCitation7–9. These targeted therapies may interfere with tumor cells’ growth or capacity for cell division, or the tumor’s microenvironment. Thus, current clinical management of mCRC often involves the addition of targeted therapies to standard chemotherapy to hinder the mechanisms of cancer cells. Among available targeted therapies for mCRC, bevacizumab is the most commonly added to chemotherapy regimens, followed by cetuximabCitation5,Citation6.
These chemotherapies and targeted therapies for mCRC have distinct safety and tolerability profiles, and may induce adverse events (AEs) due to toxicity. The most commonly reported AEs associated with mCRC treatments include anemia, neutropenia, nausea/vomiting, diarrhea, asthenia, stomatitis and ulceration, thrombocytopenia, alopecia, proteinuria, and increases in blood alanine aminotransferase levelsCitation8. These common AEs associated with mCRC treatments are likely to be reversible, predictable, and manageableCitation10,Citation11. Nevertheless, AEs may worsen patients’ quality-of-lifeCitation12–14, delay treatment if it must be discontinued or temporarily withheld, cause a reduction in dose to manage the AE, and increase healthcare resource utilization and costsCitation15,Citation16.
To date, few studies have quantified the economic impact of common AEs associated with available mCRC treatments, and these studies were limited to hospitalization costs of patients using a restricted list of mCRC treatmentsCitation15,Citation17,Citation18. However, the cost of AEs may go beyond the cost of resulting hospitalizations as they may compromise the course of treatment and have repercussions on mCRC disease management. Comprehensive estimations of the economic consequences of AEs associated with mCRC treatments will help the various stakeholders have a better understanding of the implications of the use of treatments when evaluating options for treatment regimens for mCRC. Therefore, the primary objective of this study was to estimate the economic burden of common AEs associated with mCRC treatments among patients in the US. The secondary objective was to estimate the incremental cost associated with the AEs with higher economic burdens vs other AEs.
Methods
Data source
Medical and pharmacy claims data were obtained from the Truven Health Analytics MarketScan® Commercial Claims and Encounters and Medicare Supplemental and Coordination of Benefits Databases (MarketScan) from 2009 (first quarter) to 2014 (second quarter). The MarketScan database comprises detailed medical and pharmacy claims of more than 130 health plans in the US, representing over 50 million annually covered lives of insured employees and their dependents from all census regions. Information on patient demographics, health plan coverage, diagnoses and procedures from inpatient and outpatient settings, and prescription fills at a pharmacy is included in the database. In addition, financial information including net payment by the commercial plan, co-ordination of benefits (COB), co-insurance, and deductible is also included in the database. Data were fully de-identified and complied with the patient confidentiality requirements of the Health Insurance Portability and Accountability Act (HIPAA); no ethical review was required.
Study design, sample selection criteria, and treatment episodes
A retrospective open cohort design was used (). Selected patients had ≥2 independent diagnoses for a secondary malignant neoplasm (ICD-9-CM codes 197.x or 198.x), with a second diagnosis within 90 days of the first one. The first observed secondary malignancy diagnosis was defined as the mCRC diagnosis date. In addition, patients were ≥18 years old as of the mCRC diagnosis date, and had ≥2 independent diagnoses for malignant neoplasm of the colon or rectum (ICD-9-CM codes 153.x or 154.x) within 365 days before or 30 days after the mCRC diagnosis date. Patients also had ≥1 claim (prescription or administration) for ≥1 of the following agents recommended for mCRC treatment by the NCCN guidelines during data availability (the first quarter of 2006 to the second quarter of 2015), for any line of therapy: 5-fluorouracil [5-fu], bevacizumab, capecitabine, cetuximab, irinotecan, leucovorin, levoleucovorin, oxaliplatin, panitumumab, regorafenib, or ziv-aflibercept. Patients must have received their first mCRC treatment within 4 months following the mCRC diagnosis date. The first observed date that the patient received mCRC treatment was defined as the index date. Finally, patients had continuous health plan coverage from ≥180 days before the mCRC diagnosis date to ≥30 days after the index date. Patients were excluded from this study if they had a diagnosis for a cancer other than CRC before the index date, or if they were enrolled in a clinical trial (ICD-9-CM code V70.7) during the time extending from the index date to the end of health plan coverage or end of data.
Figure 1. Study design. mCRC, metastatic colorectal cancer; CRC, colorectal cancer; Q2, second quarter.
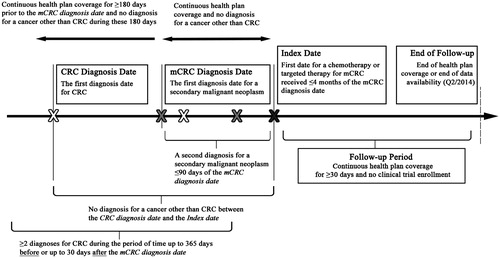
Patients meeting the sample selection criteria were observed during two continuous periods: (1) the 6 month period before the index date (baseline period with continuous health plan coverage); and (2) from the index date to the end of health plan coverage (either medical or pharmacy) or end of data availability (second quarter of 2014), whichever occurred first (follow-up period).
mCRC treatment episode(s) were identified during the follow-up period of selected patients, and up to their three first treatment episodes were considered for the analysis. The treatment regimen received during a treatment episode constituted the agents for mCRC treatment, received in monotherapy or combination therapy. The initiation date of a treatment episode was defined as the date of the first claim of the first agent of a treatment regimen. Treatment regimens were identified based on all agents used during the first 28 days following the initiation of the first agent of a treatment regimen, since most mCRC treatment regimens are recommended on a 3–4-week cycleCitation4. The treatment episode continued until either: (1) a gap in treatment of all agents for ≥45 consecutive days (after the last day of supply or days off of a treatment cycle), or (2) a change in the treatment regimen (i.e. addition or substitution of agent[s]). Because of the recommended 3–4-week mCRC treatment cycle, a 45-day gap was used to define interruption, as this corresponds to 1.5 typical cyclesCitation10. The length of each treatment episode was calculated as the number of days between the initiation date and the end date of the treatment episode. In case of treatment discontinuation without switch, the treatment episode was continued for up to 45 days following the last day of supply of the last agent of the treatment regimen—until a new treatment initiation or end of the follow-up period—to capture any potential AEs resulting from the discontinued treatment. In case of a change in treatment regimen, the treatment episode ended the day before the addition or substitution of agent(s)Citation5,Citation6.
Selection and categorization of AEs
The list of studied AEs was determined by reviewing US Food and Drug Administration (FDA) product labels for each agent for mCRC treatment approved by the second quarter of 2014 (end of data availability), resulting in a comprehensive list of AEs. This list includes AEs with prevalence >5% and a pre-selected list of AEs known to be costlyCitation8,Citation15,Citation19. AEs were identified using ICD-9-CM diagnosis codes recorded in the medical claims data. Identified AEs were grouped into the following nine system/organ categories: (1) cardiovascular: acute myocardial infarction, angina, cardiac arrhythmia, congestive heart failure, and hypertension; (2) central nervous system (CNS): decreased appetite, fatigue/asthenia, pain/myalgia, headache, and peripheral neuropathy; (3) dermatologic: alopecia, erythema (including hand-foot syndrome or palmar-plantar erythrodysesthesia), pruritus, and skin rash; (4) endocrine and metabolic: hypocalcemia, hypokalemia, hypomagnesemia, hyponatremia, and hypophosphatemia; (5) gastrointestinal: constipation, diarrhea, nausea and vomiting, and stomatitis; (6) hematologic: anemia (including iron and other deficiency anemias such as B-12 deficiency, hemolytic anemia, and aplastic), neutropenia (including febrile neutropenia and leukopenia), thrombocytopenia, and pancytopenia; (7) hemorrhagic: pulmonary hemorrhage, and gastrointestinal hemorrhage; (8) hepatobiliary/pancreatic: increased aspartate aminotransferase (AST)/alanine aminotransferase (ALT), and increased serum bilirubin; and (9) respiratory: dyspnea and upper respiratory infection (Supplemental Table 1
Categorization and matching of mCRC treatment episodes
The categorization and matching methods of mCRC treatment episodes were applied for each of the nine AE categories. First, treatment episodes with ≥1 diagnosis for the studied AE category were considered to be ‘with the studied AE category’ (e.g. with hematologic AEs). Treatment episodes of patients without any diagnosis codes for the studied AE category during the treatment episode were considered to be ‘without the studied AE category’ (e.g. in the case that the studied category is hematologic AEs, with AEs other than hematologic or no AEs). Second, mCRC treatment episodes with the studied AE category were exactly matched, without replacement, to treatment episodes without the studied AE category by line of treatment (i.e. first, second, or third treatment episode) and type of mCRC treatment, which included chemotherapy-based regimens (yes/no), anti-VEGF therapies (yes/no; bevacizumab, ziv-aflibercept, or regorafenib), anti-EGFR therapies (yes/no; cetuximab, or panitumumab), and combination regimens (yes/no; vs monotherapy).
To maximize the number of treatment episodes included in the analysis, a variable matching ratio was used. The variable matching ratio of 1:k was determined based on the relative size of treatment episodes with vs without the studied AE category, with a maximum ratio set to 1:10Citation20.
Patient characteristics, outcomes, and statistical analyses
Patient characteristics were measured during the baseline period and included information on demographics (age, gender, region of residence, and type of health plan), disease history (primary tumor location and metastatic site), comorbidities (Charlson-Quan comorbidity index [CCI]Citation21, comorbidities associated with mCRCCitation22–25, and common AEs associated with mCRC treatment), treatment profile (use of chemotherapy, targeted therapy, or granulocyte-colony stimulating factor therapy (G-CSF), surgery, and radiation therapy).
Direct healthcare costs were measured during mCRC treatment episodes. Costs, including the payer’s (commercial plan and COB) and beneficiary’s contributions (deductible and coinsurance), were adjusted for inflation using the US Medical Care consumer price indexCitation26. Because mCRC treatment episodes varied in duration, costs were reported on a monthly basis. The following all-cause cost components were reported: (1) medical service costs, including inpatient (IP), emergency department (ED), outpatient (OP), and other medical services (laboratory, radiology, or other ancillary services such as home health services and skilled nursing facilities); (2) pharmacy costs, including mCRC-related and other pharmacy costs; and (3) total costs (medical service combined with pharmacy costs).
The following statistical method was applied for each of the nine AE categories. Patient characteristics were compared between treatment episodes with vs without the studied AE category using conditional logistic regression. Incremental costs were estimated by comparing costs between matched treatment episodes with the studied AE category to those without the studied AE category. Adjusted incremental costs were estimated using a generalized linear model (GLM with a gamma distribution and link log) for cost components with a small proportion of zero costs (total, medical service, OP, and pharmacy costs) or a two-part model (first part was a logistic regression and second part a GLM with a gamma distribution and link log) for cost components with high proportion of zero costs (IP, ED, and other medical service costs). A non-parametric bootstrap re-sampling technique with 499 iterations was used to estimate p-values with 95% confidence intervals (CIs)Citation27,Citation28. Regression models were adjusted for baseline characteristics including age, gender, health plan type, region of residence, metastatic tumor site, presence of AEs before initiating mCRC treatments, and surgery for mCRC. In addition, regression models were adjusted for AEs other than for the studied AE category reported in urgent care settings (i.e. IP or ED) during treatment episodes, to separate estimated incremental costs from those due to AEs other than the studied AE category. Data analyses were performed using the software SAS®, version 9.3 (SAS Institute, Inc., Cary, NC).
A secondary analysis was performed on the AE category incurring the highest costs (hematologic) to estimate the incremental cost associated with this particular AE category vs other categories. Thus, using a similar statistical method as the one described above, treatment episodes with hematologic AEs were matched to treatment episodes with non-hematologic AEs. Treatment episodes with non-hematologic AEs included treatment episodes with ≥1 AE category other than hematologic. Incremental costs were estimated by comparing costs between matched treatment episodes with hematologic AEs to those with non-hematologic AEs.
Results
A total of 4,158 patients met the inclusion criteria for this study. Of these, 2,261 (54.4%) patients had a second treatment episode, and 1,115 (26.8%) patients had a third treatment episode (see Supplemental Figure 1 for patient selection flowchart). On average, 2.1 (standard deviation [SD] = 1.4) mCRC treatment episodes were observed per patient, and each treatment episode had an average length of 166 (SD =144) days.
The mean age was 59 (SD =12) years, 42% of patients were female, and the baseline mean CCI score (excluding cancer) was 1.0 (SD =1.13) (). Patients were distributed among all census regions of the US, with the majority living in the South (39%), and 60% had preferred-provider organization insurance plans. The colon was the primary tumor location in 74% of patients, and the most common sites for metastases were liver (60%), lung (14%), and retroperitoneum and peritoneum (13%). At baseline, 39% of patients had undergone surgery, 21% had received chemotherapy, and 11% had received targeted therapy for mCRC. Common comorbidities associated with mCRC that were frequently observed among patients included hypertension (43%), constipation (41%), vomiting/nausea (40%), and adenomatous polyps (32%).
Table 1. Characteristics of patients with mCRC.
The average durations of the first, second, and third lines of treatment were 181 days (SD =157), 160 days (SD =141), and 150 days (SD =117), respectively (). A majority of patients used a chemotherapy-based regimen (98%, 95%, and 92% for the first, second, and third lines of treatment, respectively) and combination therapy (81%, 83%, and 79%, respectively). Across lines, the proportion of patients using any monotherapy varied between 17–21%, with 12–17% of patients using chemotherapy monotherapy, and 2–8% using targeted therapy monotherapy. For the first treatment episode, the most common combination therapies were FOLFOX (38%) and FOLFIRI (11%), and for the second and third lines of treatment they were FOLFIRI (22% and 21%, respectively) and then FOLFOX (19% and 11%). Targeted therapy-based mCRC treatment regimens were used by an increasing proportion of patients across subsequent lines of treatment: 50% for the first line, 68% for the second line, and 69% for the third treatment episode. In all lines, the most common targeted therapy was bevacizumab (first line: 45%, second line: 52%; third line: 44%).
Table 2. Treatment characteristics stratified by first, second, and third treatment episodes.
During the first treatment episode, 90% of patients experienced ≥1 AE, with the majority of patients (66%) having >1 AE category (). In the second and third lines of treatment, 85% and 86% of patients experienced AEs, respectively. In the first treatment episode, the most common AE categories were gastrointestinal (68% of patients), hematologic (41%), cardiovascular (39%), and CNS (38%). Furthermore, these proportions remained consistent across lines of treatment.
Table 3. Common adverse events associated with mCRC treatments stratified by first, second, and third treatment episodes.
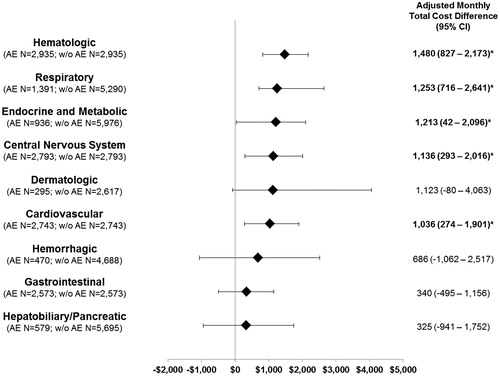
Patient and treatment characteristics after matching for each of the nine AE categories are presented in Supplemental Tables 2a–c. Significantly higher monthly total costs were observed among patients who experienced ≥1 of the following AEs by categories: cardiovascular (adjusted incremental monthly [AIM] cost difference [95% CI] = $1,036 [274–1,901], p = .012), CNS ($1,136 [293–2,016], p = .024), endocrine or metabolic ($1,213 [42–2,096], p = .044), hematologic ($1,480 [827–2,173], p = .004), and respiratory ($1,253 [716–2,641], p = .004) (). After adjustments for differences in baseline characteristics, the most expensive AEs were hematological, where the average monthly total costs were $1,480 higher for treatment episodes with ≥1 hematologic AE compared to matched treatment episodes without them. This cost difference was driven primarily by IP ($4,378 with AEs vs $2,219 without AEs, AIM cost difference [95% CI] = $574 [167–964], p = .016) and OP ($8,194 vs $7,422; $1,426 [992–1,868], p = .004) costs (Supplemental Tables 3a–c). These estimated incremental costs by AE category were generally constant across the first three lines of treatment (i.e. first, second, and third treatment episode). In addition, there was no statistically significant difference between treatment episodes with vs without dermatologic, gastrointestinal, hemorrhagic, or hepatobiliary/pancreatic AEs.
Figure 2. Monthly cost differences by AE system/organ category in patients with mCRC. * Statistically significant at the p < .05 level; mCRC, metastatic colorectal cancer; AE, adverse event; w/o, without the studied AE category; IP, inpatient; ED, emergency department; OP, outpatient.
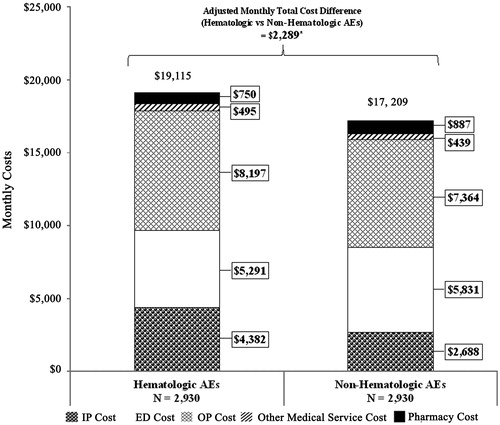
In the secondary analysis, 2,930 treatment episodes with ≥1 hematologic AE were matched to 2,930 treatment episodes with occurrences of non-hematologic AEs. Of these, 91% of the treatment episodes with hematologic AEs and 59% of episodes with non-hematologic AEs had ≥2 AE categories; treatment episodes with hematologic AEs were observed to have more AE categories than those in the non-hematologic AE category (mean number of AE categories: hematological cohort = 3.20, non-hematological cohort =1.98; p < .001). On average, monthly costs of treatment episodes with hematologic AEs were higher than those with non-hematologic AEs ($19,115 vs $17,209, p < .001) (). After adjustment for differences in baseline characteristics, average monthly total costs were $2,289 higher for treatment episodes with ≥1 hematologic AE compared to their matched counterparts (p = .004). This difference was mainly driven by inpatient and outpatient costs (AIM costs [95% CI]: IP = $1,529 [1,126–1,985]; OP = $966 [568–1,375]; both p = .004). These results should be interpreted as the incremental costs of having hematologic AEs along with another AE category, as most of the treatment episodes with hematologic AEs had >2 AE categories.
Figure 3. Monthly cost difference between treatment episodes with hematologic AEs vs non-hematologic AEs in patients with mCRC. * Statistically significant at the p < .05 level; mCRC, metastatic colorectal cancer; AE, adverse event; IP, inpatient; ED, emergency department; OP, outpatient.
Discussion
Treatments for mCRC have distinct tolerability profiles and, like many therapies for cancer, have side-effects due to toxicity that may compromise patients’ course of treatmentCitation8, impact their quality-of-lifeCitation12–14, and increase their healthcare resource utilization and costsCitation15,Citation16. This is the first study to provide a comprehensive estimation of the economic consequences of AEs associated with these mCRC treatments. Not surprisingly in the current practice, FOLFOX and FOLFIRI were the most commonly prescribed chemotherapy regimen and bevacizumab was the most commonly prescribed targeted therapy. Also consistent with the literature, duration of treatment episodes had an average of a little less than 6 monthsCitation5,Citation29. More importantly, this study estimated that ∼90% of the studied patients receiving mCRC treatments experienced ≥1 type of AE, where the most costly AEs were hematologic, followed by respiratory, endocrine/metabolic, CNS, and cardiovascular. Furthermore, patients who experienced the most expensive AE category (hematological) during mCRC treatment were also more likely to have AEs involving other AE organ/system categories, resulting in significantly higher total monthly costs, driven primarily by higher inpatient and outpatient costs.
Although several studies have examined the cost of AEs related to chemotherapy for other cancers, few have examined the economic burden associated with AEs resulting from chemotherapy-based mCRC treatments specifically. However, patients receiving chemotherapy often experience hematologic AEsCitation30,Citation31, and the expense related to managing these AEs is substantial and varies greatly depending on severity. In other studies, the cost of anemia has been estimated to range from $22,775–$93,454/year (in 2006 USD), and the cost of neutropenia has been estimated to range from $2,632–$49,917 (in 2006 USD)Citation31 and $16,291–$19,456 (in 2011 USD)Citation32 per hospitalization. Neutropenia is the main dose-limiting toxicity in chemotherapy treatments for cancerCitation33, and the prevention of febrile neutropenia through G-CSFs is highly expensive and, thus, not universally usedCitation34. Studies have estimated that 7–22% of patients with cancer treated with chemotherapy require hospitalization for neutropeniaCitation31,Citation35, and chemotherapy-induced anemia can affect 80% of treated patients with cancerCitation36. These risks and associated costs represent a sizable economic burden. Adding to this burden is the fact that anemia was associated with an increase in the mortality rate by 65% among patients with cancerCitation37.
Additionally, several studies have examined the cost of AEs associated with monoclonal antibody treatments for mCRC. A recent meta-analysis of the risk of incremental toxicities associated with treatments for cancer from clinical trials reported that highly-specific targeted therapies resulted in fewer severe AEs than less-specific agents and chemotherapies, and patients using those therapies incurred lower costsCitation16. The costs of managing these AEs were low in comparison with the cost of treatment, but still may result in significant expense to the healthcare system. A study conducted in 2012 examined the costs of toxicities related to the monoclonal antibody mCRC therapies bevacizumab, cetuximab, and panitumumab by searching the Healthcare Cost and Utilization Project database for ICD-9-CM codes for common AEsCitation17. The study reported that, for these therapies, gastrointestinal (GI) AEs, specifically GI perforation ($32,443; 2010 USD) and GI fistula ($29,062) resulted in the highest annual inpatient costs, followed by arterial thrombosis and wound-healing complications. Another claims database analysis in 2012 that analyzed hospital costs resulting from AEs associated with monoclonal antibody mCRC therapy also reported that GI perforations were the most costly AEs (annual average of $66,224) and resulted in the longest average hospital stay (11.5 days)Citation15. A 2011 UK-based claims analysis estimated the costs of hospitalization associated with certain adverse events among patients with mCRC treated with bevacizumab, cetuximab, and panitumumabCitation18. The authors found that the longest average admission stays were related to stroke, arterial thromboembolism, wound-healing complications, acute myocardial infarction, heart failure, and neutropenia, while the highest costs were resultant from stroke, arterial thromboembolism, and wound healing complications. However, the cost of AEs may go well beyond the one-time cost of the hospitalization, and for this reason it is important to use a comprehensive approach when assessing the cost of AEs.
As chemotherapy-based and also many targeted treatments for mCRC often result in severe and costly AEs, there is currently an unmet need for treatments associated with fewer AEs, particularly the most costly ones. When treatment options for mCRC have similar efficacy profiles, clinical decision-makers may consider, in addition to the treatment cost, the non-negligible expenses related to the management of AEs commonly reported in mCRC treatment—especially those related to the hematologic AEs—to have a better understanding of the implications of the use of treatments when evaluating options. New, effective treatment options with fewer and less severe AEs are warranted to aid in constructing optimal mCRC therapy regimens along with the best supportive care to reduce healthcare costs and potentially improve patients’ quality-of-life.
Limitations
These findings should be interpreted in light of the limitations of this study and in the context of the sample selection criteria, taking into account that the sample was limited to privately insured employees and their dependents diagnosed with mCRC. First, in the secondary analysis, it was not possible to isolate the incremental cost solely due to hematologic AEs. Thus, the adjusted incremental monthly total costs of $2,289 was partially due to hematologic AEs themselves, but also reflected the combination of having hematologic AEs and other non-hematologic AEs at the same time; roughly more than three quarters of treatment episodes had more than one AE category. Second, this study is subject to common limitations that are inherent to retrospective observational studies using claims databases. Claims databases only contain diagnostic and procedure codes that are recorded for reimbursement purposes; therefore, there is no data on cancer histological classification, grading, laboratory test results, or performance status. Multivariate regression models were used to adjust for available potential confounding factors; however, the regression models may not be sufficient to fully adjust for the difference in, for example, comorbidity burden and some residual confounding effect may remain. Also, some potentially less severe AEs or impact of AEs with cumulative effect may not have been reported by the physician when billing the medical service, resulting in potentially more conservative estimates of incremental costs. Claims databases do not include information on the cause of the AE; this study aimed to assess the association of costs and AEs rather than causation between the AE and the treatment. Finally, this data source may be subject to coding errors or data omissions. Nonetheless, claims data remain a valuable source of information, as they comprise a valid and large data sample and have the unique advantage of describing patients’ treatment outcomes, healthcare resource utilization, and costs in a real-world setting.
Conclusion
This study found that common AEs associated with mCRC treatments were frequent and resulted in a significant economic burden. The most costly category of AEs was hematologic AEs, followed by respiratory, endocrine/metabolic, CNS, and cardiovascular. Patients experiencing hematologic AEs during treatment episodes often had other types of AEs, and treatment episodes with hematologic AEs were associated with significantly higher healthcare costs compared to those with non-hematologic AEs. These findings suggest there is a need for effective mCRC treatments with fewer and less severe AEs, and suggest that clinical decision-makers should consider the economic burden of AEs—particularly hematological AEs—in their treatment decisions, especially when treatment options have similar efficacy profiles.
Transparency
Declaration of funding
This study was funded by Bayer Pharmaceuticals.
Declaration of financial/other interests
EW and CN are current employees of Bayer Pharmaceuticals. JY was a post-doctoral fellow from the University of Washington during the period the study was conducted, which has received funding from Bayer Pharmaceuticals. DLV, AG, and SS are current employees of Analysis Group, which has received consultancy fees from Bayer Pharmaceuticals.
Previous presentation
A synopsis of the current research was submitted to the American Society of Clinical Oncology annual meeting, in Chicago, IL during June 3–7, 2016, and has been available on www.asco.org and jco.ascopubs.org since May 18, 2016. A poster was presented at the American Society of Clinical Oncology Quality Care Symposium in Phoenix, AZ during February 26–27, 2016.
Supplemental Material
Download MS Word (441.8 KB)Acknowledgments
Medical writing assistance was provided by Shelley Batts, PhD, an employee of Analysis Group, which has received funding from Bayer Pharmaceuticals.
Related Research Data
References
- Bartlett DL, Chu E. Can metastatic colorectal cancer be cured? Oncology 2012;26:266-75
- Kemeny N, Garay CA, Gurtler J, et al. Randomized multicenter phase II trial of bolus plus infusional fluorouracil/leucovorin compared with fluorouracil/leucovorin plus oxaliplatin as third-line treatment of patients with advanced colorectal cancer. J Clin Oncol 2004;22:4753-61
- Surveillance, Epidemiology, and End Results (SEER) Program (http://www.seer.cancer.gov) Research Data (1975-2011), National Cancer Institute, DCCPS, Surveillance Research Program, Surveillance Systems Branch, released May 2014, based on the November 2013 submission. Accessed February 1, 2015
- Engstrom PF, Arnoletti JP, Benson AB, et al. NCCN clinical practice guidelines in oncology: colon cancer. J Natl Compr Canc Netw 2009;7:778-831
- Hess GP, Wang PF, Quach D, et al. Systemic therapy for metastatic colorectal cancer: patterns of chemotherapy and biologic therapy use in US medical oncology practice. J Oncol Pract 2010;6:301-7
- Seal BS, Sullivan SD, Ramsey SD, et al. Systemic therapy for colorectal cancer: patterns of chemotherapy and biologic therapy use in nationally representative US claims database. BioDrugs 2014;28:229-36
- Van Cutsem E, Kohne CH, Hitre E, et al. Cetuximab and chemotherapy as initial treatment for metastatic colorectal cancer. N Engl J Med 2009;360:1408-17
- Van Cutsem E, Tabernero J, Lakomy R, et al. Addition of aflibercept to fluorouracil, leucovorin, and irinotecan improves survival in a phase III randomized trial in patients with metastatic colorectal cancer previously treated with an oxaliplatin-based regimen. J Clin Oncol 2012;30:3499-506
- Hohla F, Winder T, Greil R, et al. Targeted therapy in advanced metastatic colorectal cancer: current concepts and perspectives. World J Gastroenterol 2014;20:6102-12
- Hurwitz H, Saini S. Bevacizumab in the treatment of metastatic colorectal cancer: safety profile and management of adverse events. Semin Oncol 2006;33(5 Suppl 10):S26-S34
- Kamba T, McDonald DM. Mechanisms of adverse effects of anti-VEGF therapy for cancer. Br J Cancer 2007;96:1788-95
- Tachi T, Teramachi H, Tanaka K, et al. The impact of outpatient chemotherapy-related adverse events on the quality of life of breast cancer patients. PLoS One 2015;10:e0124169.
- Douillard JY, Cunningham D, Roth AD, et al. Irinotecan combined with fluorouracil compared with fluorouracil alone as first-line treatment for metastatic colorectal cancer: a multicentre randomised trial. Lancet 2000;355:1041-7
- Maughan TS, James RD, Kerr DJ, et al. Comparison of survival, palliation, and quality of life with three chemotherapy regimens in metastatic colorectal cancer: a multicentre randomised trial. Lancet 2002;359:1555-63
- Fu A, Zhou Z, Wang S, et al. Hospital costs of adverse events in patients with metastatic colorectal cancer. J Cancer Ther 2013;4:153-8
- Niraula S, Amir E, Vera-Badillo F, et al. Risk of incremental toxicities and associated costs of new anticancer drugs: a meta-analysis. J Clin Oncol 2014;32:3634-42
- Burudpakdee C, Zhao Z, Munakata J, et al. Economic burden of toxicities associated with metastatic colorectal cancer treatment regimens containing monoclonal antibodies. J Med Econ 2012;15:371-7
- Overbeek JA, Zhao Z, van Herk-Sukel MP, et al. Costs of hospital events in patients with metastatic colorectal cancer. J Med Econ 2011;14:656-61
- Hurvitz S, Guerin A, Brammer M, et al. Investigation of adverse-event-related costs for patients with metastatic breast cancer in a real-world setting. Oncologist 2014;19:901-8
- Stuart EA. Matching methods for causal inference: A review and a look forward. Stat Sci 2010;25:1-21
- Charlson M, Szatrowski TP, Peterson J, et al. Validation of a combined comorbidity index. J Clin Epidemiol 1994;47:1245-51
- Fu A, Zhou Z, Gao S, et al. Comorbid conditions in patients with metastatic colorectal cancer. World J Oncol 2011;2:225-31
- Overbeek JA, Zhao Z, Van Herk-Sukel MP, et al. Cardiovascular comorbidities among patients with metastatic colorectal cancer. J Cancer Ther Res 2012;1:4. http://dx.doi.org/10.7243/2049-7962-1-4
- Amersi F, Agustin M, Ko CY. Colorectal cancer: epidemiology, risk factors, and health services. Clin Colon Rectal Surg 2005;18:133-40
- Ording AG, Horvath-Puho E, Erichsen R, et al. Five-year mortality in colorectal cancer patients with ulcerative colitis or Crohn's disease: a nationwide population-based cohort study. Inflamm Bowel Dis 2013;19:800-5
- The Consumer Price Index (CPI). US Department of Labor, Bureau of Labor Statistics; 2016. http://www.bls.gov/cpi/. Accessed November 2015
- Andrews DWK, Buckinsky M. A three-step method for choosing the number of bootstrap repetitions. Econometrica 2000;68:23-51
- Davidson R, MacKinnon J. Bootstrap tests: how many bootstraps? Econ Rev 2000;19:55-68
- Bendell JC, Bekaii-Saab TS, Cohn AL, et al. Treatment patterns and clinical outcomes in patients with metastatic colorectal cancer initially treated with FOLFOX-bevacizumab or FOLFIRI-bevacizumab: results from ARIES, a bevacizumab observational cohort study. Oncologist 2012;17:1486-95
- Heinemann V, von Weikersthal LF, Decker T, et al. FOLFIRI plus cetuximab versus FOLFIRI plus bevacizumab as first-line treatment for patients with metastatic colorectal cancer (FIRE-3): a randomised, open-label, phase 3 trial. Lancet Oncol 2014;15:1065-75
- Liou SY, Stephens JM, Carpiuc KT, et al. Economic burden of haematological adverse effects in cancer patients: a systematic review. Clin Drug Investig 2007;27:381-96
- Weycker D, Li X, Edelsberg J, et al. Risk and consequences of chemotherapy-induced febrile neutropenia in patients with metastatic solid tumors. J Oncol Pract 2014;001492; published online on December 9, 2014
- Kuderer NM, Dale DC, Crawford J, et al. Mortality, morbidity, and cost associated with febrile neutropenia in adult cancer patients. Cancer 2006;106:2258-66
- Klastersky JA, Paesmans M. Treatment of febrile neutropenia is expensive: prevention is the answer. Onkologie 2011;34:226-8
- Donohue R. Development and implementation of a risk assessment tool for chemotherapy-induced neutropenia. Oncol Nurs Forum 2006;33:347-52
- Demetri GD. Anaemia and its functional consequences in cancer patients: current challenges in management and prospects for improving therapy. Br J Cancer 2001;84(Suppl 1):31-7
- Marchetti M, Barosi G. Clinical and economic impact of epoetins in cancer care. Pharmacoeconomics 2004;22:1029-45