
Abstract
Objective: To evaluate medical resource utilization (MRU) and associated costs among Australian patients with genotype 1 chronic hepatitis C (GT1 CHC), including both untreated patients and those receiving treatment with first-generation protease inhibitor-based regimens (telaprevir, boceprevir with pegylated interferon and ribavirin).
Methods: Medical records were reviewed for a stratified random sample of GT1 CHC patients first attending two liver clinics between 2011–2013 (principal population; PP), supplemented by all GT1 CHC patients attending one transplant clinic in the same period (transplant population; TP). CHC-related MRU and associated costs are reported for the PP by treatment status (treated/not treated) stratified by baseline fibrosis grade; and for the TP for the pre-transplant, year of transplant and post-transplant periods.
Results: A total 1636 patients were screened and 590 patients (36.1%) were included. Comprehensive MRU data were collected for 276 PP patients (F0–1 n = 59, F2 n = 58, F3 n = 53, F4 n = 106; mean follow-up = 17.3 months). Thirty-eight (13.8%) were treatment-experienced prior to enrolment; 55 (19.9%) received triple therapy during the study. Data were collected for 112 TP patients (mean follow-up = 29.9 months), 33 (29.5%) received a transplant during the study, and 51 (45.5%) beforehand. The annual direct medical costs, excluding drug costs, were higher among treated PP vs untreated PP (AU$: $1,954 vs $1,202); and year of transplant TP vs pre-/post-transplant TP (AU$: pre-transplant $32,407, transplant $155,138, post-transplant $7,358).
Limitations: To aid interpretation of results, note that only patients with GT1 CHC who are actively managed are included, and MRU data were collected specifically from liver outpatient clinics. That said, movement of patients between hospitals is rare, and any uncaptured MRU is expected to be minimal.
Conclusions: CHC-related MRU increases substantially with disease severity. These real-world MRU data for GT1 CHC will be valuable in assessing the impact of new hepatitis C treatments.
Introduction
Chronic hepatitis C (CHC), which affects up to 150 million people globallyCitation1, is one of the leading causes of chronic liver disease, cirrhosis, and hepatocellular carcinoma (HCC), as well as the most common indication for liver transplantationCitation2. An estimated 500,000 people die each year from CHC-related diseasesCitation1. CHC genotypes vary throughout the world; in Australia, where this study was conducted, the two predominant hepatitis C genotypes are genotype 1 (GT1; ∼55%) and genotype 3 (GT3; ∼38%)Citation2.
Until very recently, the standard of care and reimbursed treatment for GT1 CHC treatment in Australia was triple therapy with a direct acting antiviral (DAA), such as telaprevir, simeprevir, or boceprevir, in combination with pegylated interferon and ribavirin (PR). Telaprevir and boceprevir are protease inhibitors (PIs) that were listed on the Pharmaceutical Benefits Scheme (PBS) in April 2013. Simeprevir, also a PI, was listed on the PBS in December 2014. The same interferon-based triple therapy continues to be the standard of care in many parts of the world. However, some patients are unable to receive interferon-based treatment due to medical or psychological comorbidities, substance abuse, or prior treatment failureCitation3. Additionally, previous research suggests that patients may delay treatment uptake until a new generation of interferon-free hepatitis C virus drugs become availableCitation4,Citation5. On 1 March 2016, the first interferon-free therapies for the treatment of GT1 CHC were listed on the PBS for public funding.
As part of the process of assessing whether new interferon-free treatments should receive public subsidy, it is important to understand how patients were being managed on triple therapy and to provide accurate estimates of the cost of caring for GT1 CHC patients. There is a lack of Australian real world data for this patient population. As a result, published cost estimates of CHC-related medical resource utilization (MRU) used in Australian economic models have been based on expert opinion or anecdotal evidenceCitation6–8. Similarly, many other published estimates of the cost of care for GT1 CHC patients outside of Australia rely on expert opinionCitation9–15. This approach for estimating MRU and costs may result in biased estimates of the cost of care. Expert opinion has been supplemented with MRU data from administrative claims databases in the USCitation3,Citation16–19, and observational data has been used for French and British cost estimatesCitation20,Citation21. However, the key American and British supplementary sources of MRU information pre-date the introduction of PIs and currently the French study has been published only as a conference abstractCitation22–25. Furthermore, the degree to which international MRU and cost data can be generalized to Australia may be limited.
Therefore, we conducted an observational study to evaluate the real world MRU and costs of Australian patients with GT1 CHC including those receiving PI-based triple therapy, to help inform the decision to fund new interferon-free therapies in Australia.
Patients and methods
Study design and data sources
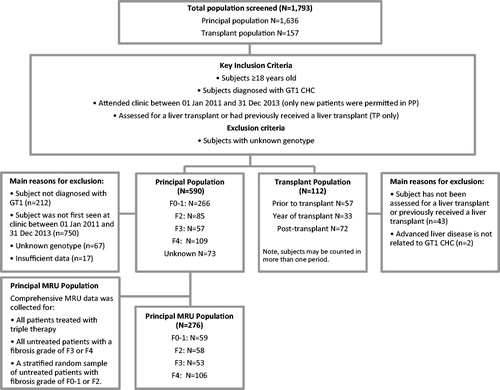
This was a non-interventional, retrospective chart review study of patients with GT1 CHC recruited from two liver clinics (Principal Population [PP]) and one liver transplant clinic (Supplementary Transplant Population [TP]), in Melbourne Australia. Ethics approval was sought and received for all three sites between June 2014 and August 2014. Data was collected from the clinic databases and hospital medical records. Patient demographics, disease characteristics, and past and current treatments were available in the clinic databases for the eligible sample. However, in-depth CHC-related MRU required intensive resources to retrieve and extract information from hospital medical records. Therefore, additional CHC-related MRU were collected for a sub-set of patients; including all patients treated with triple therapy, all untreated patients with F3–F4 at baseline, and a stratified random sample of patients with fibrosis grade 0–1 and 2 (F0–1 and F2, respectively). This was supplemented by all GT1 CHC patients attending the transplant clinic (see for details). CHC-related MRU was collected at all sites and included details of CHC treatment, outpatient consultations, laboratory and imaging tests, and hospitalizations between 1 January 2011 and 30 June 2014.
Figure 1. Patient eligibility and flow. CHC, chronic hepatitis C; F0–4, fibrosis grades 0–4; GT1, genotype 1; MRU, medical resource utilization; n, number; PP, principal population; TP, transplant population.
Principal population (PP)
New patients first attending the liver clinic with GT1 CHC between January 2011 and December 2013 were eligible for the study as this was when extensive baseline data was recorded prospectively in the clinic databases and to provide a more representative sample. To include those already attending clinics would bias the cohort towards those who failed treatment and/or had more advanced liver disease which are associated with higher MRU costs. Patients were classified into groups based on fibrosis grade at their first clinic visit. CHC-related MRU (percentage and annual rate of outpatient visit, hospitalization, laboratory, and imaging tests) were reported for the PP while on triple therapy (“treated”, telaprevir or boceprevir plus PR) and while “untreated” (), stratified by baseline fibrosis grade. Disease progression was defined as at least one of ascites, variceal hemorrhage, hepatic encephalopathy, hepatocellular cancer (HCC), or referral to a liver transplant clinic. Patients with baseline fibrosis grade of F4 were further divided into two: the cF4 group was defined as patients without symptoms of disease progression at baseline (compensated), while the dF4 group included patients with symptoms of disease progression at baseline (decompensated). For those without disease progression at baseline, but who developed an indicator of progression during the study, only MRU collected up until the day before progression were included.
Figure 2. (a) Examples of MRU data collection: Principal population. (b) Examples of MRU data collection: Transplant population. *A patient could contribute to estimates of MRU in more than one period (e.g. while on treatment and while not on treatment). MRU while on an excluded treatment (dual therapy or in a clinical trial) was not included. Notes: Last contact date may be date of death.
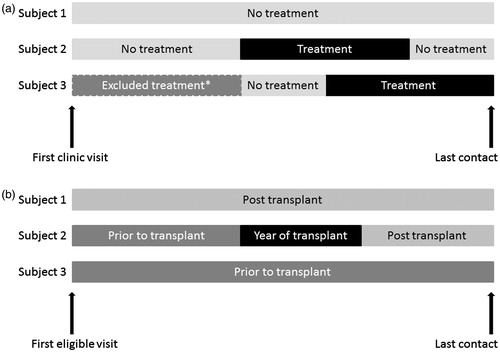
Subjects receiving treatment as part of a clinical trial for CHC were not included for the duration of time they were treated under a clinical trial protocol. Similarly, subjects receiving dual therapy (PR) for CHC were not included for the duration of time they were treated under this regimen. Data from before and after these excluded periods were collected. As the duration of triple therapy varies depending on response, MRU while undergoing treatment were included for 1 year from the initiation of pre-treatment activities (e.g. social worker visits) for all patients, regardless of the length of actual treatment. In instances where the treatment period was censored to 1 year, the observation period included firstly the time on triple therapy, secondly the pre-treatment period, and thirdly the post-treatment period. Simeprevir was not listed on the PBS until after the end of the data collection period and is, therefore, not included in this study.
Supplementary transplant population (TP)
Data on patient demographics, disease characteristics, and past and current treatments were sought for all TP patients. CHC-related MRU in the TP were reported in three periods: prior to transplant, year of transplant, and post-transplant (). The TP was divided into two sub-groups based on whether they had HCC within each of these periods.
Statistical methods
Statistical analyses were largely descriptive in nature and are presented as frequency and percentage, or mean with standard deviation or 95% confidence interval (CI). The annual rate of outpatient visits, hospitalization, laboratory, and imaging tests were estimated using a Poisson model with the log of the follow-up time as an offset and is reported as an annual rate. Subjects with high MRU costs were identified as those in the highest 20th-percentile. Factors potentially associated with high MRU cost (age, gender, ethnicity, country of birth, alcohol and intravenous drug use at first visit, comorbidities, estimated duration of disease and baseline fibrosis grade [PP] or Child Pugh Score [TP]) were initially assessed using univariate logistic regression with those significant at the 0.10 level retained in the multivariate model. All statistical programming was performed using Version 9.3 of the SAS® software package.
Calculation of costs
Costs were provided as 2015 Australian dollars (AU$1 is ∼€0.67 and US$0.76) and in accordance with the preferred method for Australian health technology assessment by the Pharmaceutical Benefits Advisory Committee (PBAC)Citation26. Unit costs were applied to frequently reported CHC-related items; that is visits to the hepatitis and transplant clinic, nurse, clinical psychologist, oncologist, and surgeon; key pathology (liver function [LFT], full blood examination [FBE], alpha fetoprotein, routine biochemistry [K, Na, Urea], RNA qualitative and quantitative assays) and imaging tests (ultrasound); and inpatient CHC-related hospitalization reported at an annual rate of 0.05 or higher overall in any period of interest. The costs of other CHC-related MRU were excluded; for example, the costs of drugs, visits to other healthcare professionals (GPs, social workers, dieticians) and to emergency departments, other imaging and laboratory tests. Unit costs for specialist visits, laboratory and imaging tests were obtained from the Medicare Benefits Schedule (MBS)Citation27. Even though length of stay data was collected in the audit, to improve generalizability, unit costs for inpatient hospitalization were based on the average cost for the Australian-refined diagnosis related group (AR-DRG); that is using the average length of stay nationally rather than within this sampleCitation26,Citation28.
Unit costs were applied to the utilization rate observed in the sample, and the mean annual MRU cost was estimated as the average cost per follow-up time weighted by follow-up duration (to reflect the Poisson approach taken above) and reported with bootstrap confidence intervals.
Costs are provided for commonly reported health states used in economic models: mild disease (F0–F1 from PP), moderate disease (F2 and F3 from PP), compensated disease (cF4 from PP), decompensated disease (dF4 from PP and pre-transplant from TP [all patients regardless of HCC status]), HCC (patients with HCC pre-transplant from TP), year of transplant, and post-transplant (both from TP).
Results
Characteristics of the study populations
Principal population (PP)
A total of 1,636 subjects were screened across the two centers, and 590 patients (36.1%) were included in the study. More than half of the population was male (61.7%), mean age was 49 years, and the majority were genotype 1a (73.4%) with a fibrosis grade of F0–F1 (45.2%). The mean duration of CHC infection was estimated to be 23.6 years (). Most patients (517 out of 590; 87.6%) had a fibrosis grade recorded at the time of their first clinic visit (baseline; ).
Table 1. Baseline characteristics of the study sample.
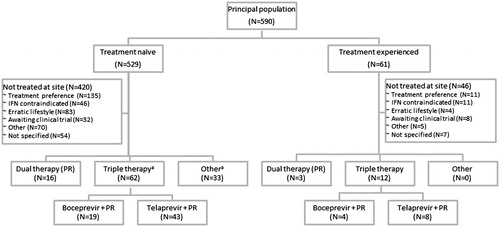
A high proportion of subjects were reported to have a history of depression (42.7%) and other mental health problems (37.2%), such as anxiety, bipolar disorder, or schizophrenia. The majority of patients (529, 89.7%) were treatment-naïve at their first clinic visit, and most (420, 71.2%) remained treatment-naïve at the end of the study (; mean age of 48 and baseline fibrosis score distribution indicating the majority with F0–F1: 60.4% F0–F1, 16.1% F2, 9.4% F3, and 14.1% F4). Sixty-one (10.3%) were treatment-experienced at their first clinic visit and 170 were treatment-experienced at the end of the study (mean age of 51 and baseline fibrosis score distribution: 31.4% F0–F1, 16.7% F2, 14.7% F3, and 37.2% F4). A total of 74 (12.6%) patients had only one clinic visit during the study period.
Figure 3. Treatment algorithm. PR, pegylated interferon + ribavirin. (a) N denotes number of courses. Two patients received two courses each at the liver clinic: one received telaprevir + PR and investigational treatment, and one received two different investigational courses of treatment. Notes: Except where indicated by ‘a’, N denotes the numbers of patients.
Supplementary transplant population (TP)
A total of 157 subjects were screened and 112 (71.3%) were included in the TP; TP included all eligible patients managed by the transplant clinic, regardless of transplant status at baseline. A higher proportion of males (86.6%) were identified across the study population with an average age of 55.6 years (). Almost half (45.5%) were transplanted prior to the study period, 33 (29.5%) received a transplant during the study (30 [26.8%] received their first transplant), and 25.0% had not yet received a liver transplant. Child Pugh Score was reported for 77 patients (A: 19.5%; B: 36.4%; and C: 44.2%). Meld score was available for 92 patients (<15: 53.3%; 15–20: 30.4%; and >20: 16.3%).
Medical resource use
Comprehensive MRU was collected for 276 PP patients (F0–1 n = 59, F2 n = 58, F3 n = 53, F4 n = 106; mean follow-up =17.3 months). The majority of patients within the F4 group (n = 99) were categorized as cF4 (compensated), not presenting any symptoms of disease progression at baseline. Seven of the F4 patients were categorized as dF4 (decompensated), presenting disease progression indicators at baseline; none of whom were treated with triple therapy. Nine patients without symptoms of decompensated disease at baseline (9.1% of the cF4 group) experienced at least one indication of disease progression during the study, and their MRU from that date onwards was excluded from estimates of MRU. Hepatocellular carcinoma was the most commonly reported disease progression state amongst the untreated sub-group (4.5%).
Thirty-eight (13.8% of the MRU population) were treatment-experienced prior to enrolment; 55 (19.9%) received triple therapy during the study period. The patient characteristics were similar to the larger PP from which they were selected and generally well balanced between treated and untreated patients in terms of gender, age, weight, and ethnic background. There was more severe disease in the MRU population (F3 = 19.2%, F4 = 38.4%) due to the sample design, whereby only a sub-set of untreated patients with fibrosis grades F0–2 were selected to have their MRU information extracted. Nonetheless, the proportion with F4 was higher (45.5%) among those patients who received triple therapy compared with those who did not (36.7%). There were no notable differences in the characteristics of patients between the two liver clinics (data not shown).
MRU was higher while treated, including annual rates of outpatient visits, psychiatric visits, nurse visits, laboratory and imaging tests, and hospitalization (). The high hospitalization rate while treated with triple therapy was dominated by one patient with multiple same-day admissions for skin ulcer and five patients with several visits for anemia (Supplementary Table). MRU was higher among patients with greater disease severity, including annual rates of outpatient visits, nurse visits, and hospitalization (). The anomaly to the gradient of increasing hospitalization rate by fibrosis grade (F2 rate of 0.22) was influenced by the same one patient with multiple admissions for skin ulcer following triple therapy treatment.
Table 2. Medical resource use among the principal population, annual rate per person year for all subjects, Mean (95% CI).
Liver function (86.2%), FBE/coagulation (87.7%), routine biochemistry (K, Na, urea) (84.4%) and HCV RNA quantitative assay (73.9%) were the most frequently reported laboratory tests across the PP. Generally, a gradient across fibrosis grade was observed among untreated patients (generally more tests per year for higher fibrosis grades). The dF4 sub-group demonstrated the highest annual rate of laboratory tests; however, these results are based on a small patient population (n = 7). The most commonly reported imaging test was fibroscan, and the overall number requiring at least one imaging test increased by fibrosis grade in the untreated population.
Comprehensive MRU were collected for 112 TP patients (mean follow-up =29.9 months). Of the 112 subjects included in the TP, 27 (24%) subjects were diagnosed with HCC at baseline or during the study. A total of 17 (15.2%) subjects were diagnosed with HCC at baseline, and 10 (8.9%) subjects were diagnosed with HCC during the study period.
MRU were higher during the transplant period, followed by the pre-transplant period; the lowest rates of MRU were observed in the post-transplant period including annual rates of outpatient visits, psychiatric visits, and hospitalization (). The variety of laboratory tests performed and the proportion of patients reported to have at least one laboratory test was generally highest in the pre-transplant period. Standard biochemistry tests, such as liver function and FBE/coagulation, were similar within each period with the highest volume (rate per person year) in year of transplant. The proportion of patients requiring at least one imaging test was higher amongst the pre-transplant and year of transplant groups. The most commonly reported imaging tests reported in the pre-transplant group were gastroscopy (89.5%), ultrasound (89.5%), and CT scans (86.0%). Ultrasounds and liver biopsies were the most commonly reported tests in the year of transplant and post-transplant groups.
Table 3. Medical resource use among the transplant population, annual rate per person year for all subjects, Mean (95% CI).
Costs
and present the annual direct medical costs. Total costs per year among the PP while untreated were F0–1: $403 (95% bootstrap CI = $270–$603), F2: $756 ($434–$1,238), F3: $631 ($472–$827), cF4: $1,049 ($609–$1,790), and dF4 $15,674 ($758–$37,413). The highest quintile of MRU cost while not treated with triple therapy in the PP was associated with increasing age, abstinence from alcohol, increasing fibrosis grade, and not having depression in the unadjusted model (p < .10). However, only fibrosis grade (p = .007) remained statistically significant in the adjusted model. Patients with fibrosis grade F3 and F4 were estimated to have 3.4- and 6.6-times the odds of being in the high MRU cost quintile than those with fibrosis grade F0–1 (F3: 95% CI = 0.8–13.8; p = .08; F4 95% CI = 1.9–23.7, p = .004), but those with grade F2 did not have statistically different odds for high MRU costs compared to those with grade F0–1 (p = .22).
Figure 4. (a) Annual direct medical costs: Patients without clinical indication of disease progression. cF4, compensated cirrhosis; F0–4, fibrosis grade 0–4. (b) Annual direct medical costs: Patients with clinical indication of disease progression dF4, decompensated cirrhosis; HCC, hepatocellular cancer; PP, principal population; TP, transplant population. Health states dF4 (PP) was defined as all F4 patients with indication of disease progression at baseline managed in the liver clinic (PP); dF4 (TP) was defined as all patients managed at transplant clinic prior to transplant (TP); and HCC as patients diagnosed with HCC and managed at transplant clinic prior to transplant.
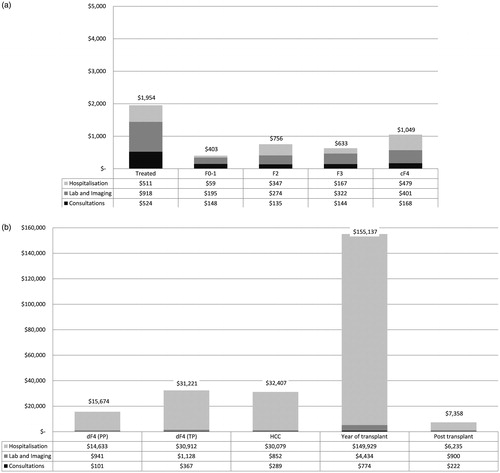
Total annual costs among the TP were HCC (pre-transplant): $31,221 ($23,514–$41,126), without HCC (pre-transplant): $33,370 ($21,919–$48,675), dF4 (all patients pre-transplant): $32,407 ($24,559–$41,349), year of transplant: $155,137 ($147,254–$163,492), and post-transplant: $7,358 ($5,256–$9,756). No factors were identified as being statistically significantly (p < .05) associated with the high MRU cost quintile among patients prior to transplant in the TP. The only factor associated with being in the highest MRU cost quintile at the 0.10 level was Caucasian/white ethnicity (odds ratio = 4.8; 95% CI = 0.94–24.3; p = .059).
Discussion
In most respects, apart from the proportion with genotype 1a, the study population was similar to another Australian observational study conducted prior to the introduction of PIsCitation29. Most patients (71.2%) had not received treatment by the end of the study, which is reflective of the low treatment rates in Australia prior to the introduction of interferon-free therapies, where only 26% of CHC patients nationally have ever received treatmentCitation5. The MRU observed represents the MRU for patients managed by accredited Australian treatment centers (irrespective of receiving treatment or not). These MRU estimates may not be generalizable to undiagnosed cases or those managed solely by their GP. Furthermore, it is important to note that many people with CHC are not engaged with the healthcare system and may not be comparable to the studied sample. However, the results are applicable to the large number of patients engaged with the system, waiting for treatment with new interferon-free therapies.
Consultations at outpatient clinics and hospitalizations were higher while undergoing triple therapy treatment, but laboratory and imaging testing were not. High MRU cost while not treated was associated with disease severity as measured by fibrosis grade, but no specific patient factors after adjustment for fibrosis grade. These results are similar to those reported by an English observational studyCitation23, but a large US database analyses of more than 4,000 patients recently reported both CHC-related and non CHC-related co-morbidities were associated with high MRU costsCitation30. CHC-related MRU was substantially higher for patients attending the transplant clinic, particularly prior to and during the year of transplant.
There is a lack of real-world MRU/cost data related to CHC in Australia that is not based on expert opinion. Previously the PBAC, which is responsible for recommending drugs for public funding after evaluating cost-effectiveness, has relied on expert opinion to estimate the MRU for patients with CHC for assessing the cost-effectiveness of new treatments. When our findings are compared with previous published estimates based on expert opinion, our real world cost estimates indicate that the cost of care may be higher than previously thought ().
Table 4. Comparison of published estimates of the annual cost of care in Australia.
Total costs in the PP mild and moderate groups are higher than previous Australian estimates (), with the exception of the estimated cost for mild patients in the year of diagnosis reported by the National Centre in HIV Epidemiology and Clinical Research: $858Citation6. While the estimated cost in the cF4 group was similar to previous estimates of compensated cirrhosis, the estimated cost of decompensated disease managed by the transplant clinic (dF4 TP) was substantially higher compared to the estimated costs of those managed by the liver clinics (dF4 PP) and those previously used in Australian models (). It is important to consider the relatively small sample of decompensated patients included in the analysis. In contrast to the decompensated patients, the estimated costs post-transplant were lower than previous Australian estimates which generally assumed patients reverted to pre-transplant MRUCitation6,Citation8. Information on antiviral therapy post-transplant were not collected in this study, as triple therapy was not publicly funded in Australia for this indication. Nonetheless, it is expected that such treatment was minimal, if any, given the rapidly shifting treatment landscape during the study period.
For a more global perspective, observational studies conducted in Europe confirm the plausibility of substantially lower costs more than 1 year post-transplant seen in this studyCitation23,Citation24. The cost of care during the year of transplant were generally comparable to our findings (due to the domination of the AR-DRG hospital cost for the transplant itself), and the highest among all health states (). A recently published database analysis of the costs of CHC among Medicare beneficiaries in the US also observed that annual costs for patients with chronic infection only and dF4 were higher than the values used in many previous cost-effectiveness studies with a US perspective. The US study found that treatment of dF4 accounted for 63.9% of total Medicare’s CHC expendituresCitation25.
Limitations
This study is somewhat dated, in that it was designed and executed to inform the PBAC decision-making for one of the new interferon-free treatments. Interferon-free therapies are now recommended in the Australian Hepatitis C treatment guidelinesCitation31 and are publicly funded. Only patients who were being actively managed were included. In addition, MRU data were collected from the participating liver clinics and their associated hospital; other MRU, such as from a general practitioner or at another hospital was not captured. Patients with HCC are likely to visit an oncologist; however, given these professional attendances occur in dedicated cancer centers, they were not fully captured. As such, the reported costs may be under-estimated. However, the clinical authors (AT, SR, PA) have indicated that movement of patients between hospitals is uncommon and, typically, at the time this study was conducted, patients do not receive CHC-related care from general practitioners; therefore, we expect any uncaptured MRU to be minimal. We assumed the duration of triple therapy treatment to be 1 year, which may over-estimate the cost of triple therapy. However, while the average duration of the PR therapy regimen itself was less than 1 year, most patients were considered to require management associated with triple therapy for longer, often more than 1 year from initiation of pre-treatment activities until the end of treatment including resolution of all sequelae. Finally, only GT1 CHC patients were included in the study; the results reported here may not be generalizable to patients with other genotypes.
Conclusions
The cost of managing CHC increases substantially with disease severity and is generally higher than previously estimated in the published literature. To our knowledge, these are the first real-world MRU reported for GT1 CHC in Australia and will be valuable in assessing the cost effectiveness and budget impact of new interferon-free therapies.
Transparency
Declaration of funding
This research was sponsored by AbbVie Pty Ltd.
Declaration of financial/other relationships
SM is an employee of AbbVie Pty Ltd. HJM is an employee of Covance (Asia) Pte Ltd, which was paid by AbbVie Pty Ltd for study design and execution. At the time of the study, SJM was also an employee of Covance Pty Ltd. EW is an employee of HERA Consulting, which was paid by AbbVie Pty Ltd for data analysis. SKR, AJT, and PWA were paid investigators for this study. They were not financially compensated for collaborative efforts on publication-related activities. JME peer reviewers on this manuscript have no relevant financial or other relationships to disclose.
Supplementary_data_table_1.docx
Download MS Word (21.8 KB)Acknowledgments
The authors wish to thank Rachael Mann for medical writing and editorial support. Rachael Mann is an employee of Covance Market Access Services Inc., which was paid by AbbVie Pty Ltd for medical writing support.
Related Research Data
References
- World Health Organization. Hepititis C Fact Sheet. Geneva, Switzerland: World Health Organization, 2015. http://www.who.int/mediacentre/factsheets/fs164/en/. Accessed October 9, 2015
- McCaw R, Moaven, L, Locarnini, SA. Hepatitis C virus genotypes in Australia. J Viral Hepatitis 1997;4:351-7
- Hagan LM, Sulkowski MS, Schinazi RF. Cost analysis of sofosbuvir/ribavirin versus sofosbuvir/simeprevir for genotype 1 hepatitis C virus in interferon-ineligible/intolerant individuals. Hepatology 2014;60:37-45
- Gidding H, Law M, Amin J, et al. Predictors of deferral of treatment for hepatitis C infection in Australian clinics. MJA 2011;194:398-402
- The Kirby Institute. HIV, viral hepatitis and sexually transmissible infections in Australia. Annual Surveillance Report 2015. Sydney: Kirby Institute, The Universitiy of New South Wales, 2015
- National Centre in HIV Epidemiology and Clinical Research. Epidemiological and economic impact of potential increased hepatitis C treatment uptake in Australia 2010. Sydney, NSW: National Centre in HIV Epidemiology and Clinical Research, 2010
- Visconti AJ, Doyle JS, Weir A, et al. Assessing the cost-effectiveness of treating chronic hepatitis C virus in people who inject drugs in Australia. J Gastroenterol Hepatol 2013;28:707-16
- Warren E, Wright A, Jones B. Cost-effectiveness of telaprevir in patients with genotype 1 hepatitis C in Australia. Value Health 2014;17:792-800
- Cure S, Bianic F, Gavart S, et al. Cost-effectiveness of telaprevir in combination with pegylated interferon alpha and ribavirin in previously untreated chronic hepatitis C genotype 1 patients. J Med Econ 2014;17:65-76
- Gellad ZF, Muir AJ, McHutchison JG, et al. Cost-effectiveness of truncated therapy for hepatitis C based on rapid virologic response. Value Health 2012;15:876-86
- Turnes J, Romero-Gomez M, Planas R, et al. Pharmacoeconomic analysis of the treatment of chronic hepatitis C with peginterferon alfa-2a or peginterferon alfa-2b plus ribavirin in Spain. Gastroenterol Hepatol 2013;36:555-64
- McEwan P, Ward T, Webster S, et al. Estimating the long-term clinical and economic outcomes of daclatasvir plus asunaprevir in difficult-to-treat Japanese patients chronically infected with hepatitis C genotype 1b. ViHRI 2014;3C:136-45
- Elbasha EH, Chhatwal J, Ferrante SA, et al. Cost-effectiveness analysis of boceprevir for the treatment of chronic hepatitis C virus genotype 1 infection in Portugal. Appl Health Econ Health Policy 2013;11:65-78
- McEwan P, Kim R, Yuan Y. Assessing the cost utility of response-guided therapy in patients with chronic hepatitis C genotype 1 in the UK using the MONARCH model. Appl Health Econ Health Policy 2013;11:53-63
- Obach D, Deuffic-Burban S, Esmat G, et al. Effectiveness and cost-effectiveness of immediate versus delayed treatment of hepatitis C virus-infected patients in a country with limited resources: the case of Egypt. Clin Infect Dis 2014;58:1064-71
- Liu S, Cipriano LE, Holodniy M, et al. New protease inhibitors for the treatment of chronic hepatitis C: a cost-effectiveness analysis. Ann Intern Med 2012;156:279-90
- Saab S, Gordon SC, Park H et al. Cost-effectiveness analysis of sofosbuvir plus peginterferon/ribavirin in the treatment of chronic hepatitis C virus genotype 1 infection. Aliment Pharmacol Ther 2014;40:657-75
- Chan K, Lai MN, Groessl EJ, et al. Cost effectiveness of direct-acting antiviral therapy for treatment-naive patients with chronic HCV genotype 1 infection in the veterans health administration. Clin Gastroenterol Hepatol 2013;11:1503-10
- Younossi ZM, Park H, Saab S, et al. Cost-effectiveness of all-oral ledipasvir/sofosbuvir regimens in patients with chronic hepatitis C virus genotype 1 infection. Aliment Pharmacol Ther 2015;41:544-63
- Deuffic-Burban S, Schwarzinger M, Obach D, et al. Should we await IFN-free regimens to treat HCV genotype 1 treatment-naive patients? A cost-effectiveness analysis (ANRS 95141). J Hepatol 2014;61:7-14
- Hartwell D, Jones J, Baxter L, et al. Shortened peginterferon and ribavirin treatment for chronic hepatitis C. Int J Technol Assess Health Care 2012;28:398-406
- McAdam-Marx C, McGarry LJ, Hane CA, et al. All-cause and incremental per patient per year cost associated with chronic hepatitis C virus and associated liver complications in the United States: a managed care perspective. J Manag Care Pharm 2011;17:531-46
- Wright M, Grieve R, Roberts J, et al; Investigators UKMHCT. Health benefits of antiviral therapy for mild chronic hepatitis C: randomised controlled trial and economic evaluation. Health Technol Assess 2006;10:1-113, iii
- Schwarzinger M, Deuffic-Burban S, Mallet V, et al. Lifetime costs attributable to chronic hepatitis C from the French healthcare perspective (ANRS No 12188). J Hepatol 2013;58:S21-S2
- Rein DB, Borton J, Liffmann DK, et al. The burden of hepatitis C to the United States Medicare system in 2009: descriptive and economic characteristics. Hepatology 2016;63:1135-44.
- Department of Health and Ageing. Manual of Resource Items and their Associated Costs. Canberra, Australia: Commonwealth Department of Health and Ageing, 2009
- Department of Health. MBS Online 1 July 2015. Canberra, Australia: Department of Health, 2015. http://www.mbsonline.gov.au/. Accessed August 5, 2015
- Independent Hospital Pricing Authority. National Hospital Cost Data Collection Australian Public Hospitals Cost Report 2012-2013, Round 17. Appendix B Cost Weights (Actual) for AR-DRG version 6.0x, Round 17 (2012-13). Darlinghurst, NSW, Australia: Independent Hospital Pricing Authority, 2015. http://www.ihpa.gov.au/internet/ihpa/publishing.nsf/Content/nhcdc-lp. Accessed 5 August, 2015
- National Centre in HIV Epidemiology and Clinical Research. Australian Chronic Hepatitis C Observational Study (ACHOS) Report No. 1 March 2010. Sydney: The University of New South Wales, 2010
- LaMori J, Tandon N, Laliberte F, et al. Predictors of high healthcare resource utilization and liver disease progression among patients with chronic hepatitis C. J Med Econ 2016;19:364-73
- Thompson AJ. Australian recommendations for the management of hepatitis C virus infection: a consensus statement. Med J Aust 2016;204:268-72