
Abstract
Background: QALYs are widely used in health economic evaluation, but remain controversial, largely because they do not reflect how many people behave in practice. This paper presents a new conceptual model (Load Model) and illustrates it in comparison with the QALY model.
Methods: Load is the average annual weight attributed to morbidity and mortality over a defined period, using weightings based on preference judgements. Morbidity Load is attributed to states of illness, according to their perceived severity. When people are in full health, Load is zero (no morbidity). Death is treated as an event with negative consequences, incurred in the year following death. Deaths may be weighted equally, with a fixed negative weight such as −100, or differ according to the context of death. After death, Load is zero. In a worked example, we use the standard gamble method to obtain a weighting for an illness state, for both Load and QALY models. A judge is indifferent between certainty of 1.5 years’ illness followed by death, or a 50/50 chance of 1.5 years’ full health or 1-year illness, each followed by death. The weightings calculated are applied to a hypothetical life, 72 years in full health followed by 3 years with illness then death, using both models. Three other hypothetical outcomes are also compared.
Results: For an example life, the relative size of the morbidity component compared with the mortality component is much higher in the Load model than in the QALY model. When comparing alternative outcomes, there are also substantial differences between the two models.
Conclusions: In the Load model the weight of morbidity, relative to mortality, is very different from that in the QALY model. Given the role of the QALYs in economic evaluation, the implications of an alternative, which generates very different results, warrant further exploration.
Background
The QALY (Quality-Adjusted Life-Year) model has been the dominant paradigm in health economic evaluation for almost 40 yearsCitation1,Citation2. The QALY model takes account of both the quantity and quality of life by placing a value on time spent in different health states. Although intuitively attractive, it remains controversial.
In the UK, NICE requires that health effects of interventions be expressed as changes in QALYs for cost-effectiveness analysisCitation3. In contrast, the 2010 Patient Protection and Affordable Care Act explicitly prohibits the US federal government from basing policy on QALYsCitation4. In Germany, the Institute for Quality and Efficiency in Health Care (IQWiG) has also rejected the use of QALYsCitation5,Citation6. The approach used for economic appraisal by the UK Department of Health differs from that of NICE, referring to QALYs in only eight out of 51 (16%) impact assessmentsCitation7.
QALYs have been criticized on the grounds that they are not really utilities, do not encapsulate all relevant attributes, and may not reflect social valuesCitation1. Any good theory or model should predict what happens in practice, but the QALY model predicts anomalous results. For example, the QALY model places a lower value on saving the life of a person who is more ill than the life of someone who is less ill, but most people are more concerned to help those who have worst health and greatest needCitation8. Also QALYs value long life expectancies and capacity to benefit more than people say they doCitation9. Empirical evidence about people’s priorities at the end of life shows multiple differing viewsCitation10. Writing as a surgeon, RawlesCitation11 suggests that clinical focus is on the relief of suffering and prolonging life, but the use of QALYs can lead to “absurd” anomalies.
An EU-funded study tested the validity of some of the assumptions that underlie the scaling methods used in QALYs. For example, QALY theory suggests that people should always prefer to live 10 years in a wheelchair followed by death rather than 5 years, but a significant minority (28%) say they would notCitation12. They suggested that the QALY theory fails to account for personal differences about medical outcomes. Many people say they would prefer a quick peaceful death rather than a drawn out demise with low quality-of-life.
Arguments for and against QALYs are well documentedCitation1,Citation2,Citation13, but no robust alternative has emergedCitation14. Remedial approaches have focused on improving the classification schemes for describing patient states of illness, the methods used to obtain scales of valuations for different states and using QALYs in situations where the anomalies are least apparent, such as comparing treatments for the same conditions.
Disability-adjusted life years (DALYs) are one alternative to QALYsCitation15. DALYs are years of healthy life lost, while QALYs are years of healthy life lived. Another approach is based on Sen’sCitation16 capabilities. The capability approach uses a scale from 0–1, where 0 represents no capability and 1 represents 100% capabilityCitation17. However, QALYs, DALYs and capabilities are variants of the same conceptual model. Each multiplies the number of years by the quality of those years.
The issue addressed in this paper is how best to value individual and population health, using a single number to combine morbidity and mortality aspects, for use in economic evaluation and other decision-making. At all levels, decision-makers are called upon to make trade-offs between programs that aim to improve quality-of-life and those that aim to reduce the probability of early death.
Materials and methods
In this paper, we set out a radically different new conceptual model (the Load model). We summarize the QALY and Load models and illustrate some of the differences by applying both models to a simple worked example.
The QALY model
The QALY model extends the concept of life expectancy using various levels of quality-of-life. Health status is expressed in terms of weighted life expectancy (QALY) as the sum over all health states of the product of the time spent in each state multiplied by the relative value of that state, on a scale where healthy (or full health) has qaly = 1 and dead has qaly = 0Citation18,Citation19. For an individual, i
(1)
where j indexes the states of illness including the states healthy and dead; hj is the utility score or weight attributed to state j, where hhealthy = 1.0 and hdead = 0; and tj is the expected duration of stay in state j.
This equation reduces to length of life if only states of alive and dead are considered. Because hdead = 0, there is no need to estimate the length of time spent in the state dead, tdead. The model allows for states worse than dead. The basic model can be extended for populations and for discounting future health.
The Load model
The Load model is based on the idea that the primary objective of health services is the prevention and relief of morbidity and mortality caused by illness. The term Load is used to represent the perceived consequences of morbidity and mortality to an individual or population.
When no morbidity is caused by disease, there is no load. The state of being well, without morbidity, has load 0. All time after death also has load 0. The load of death is attributed to the death event. Deaths may be treated as equal or weighted according to the context of death. States of illness have a load based on subjective preferences using the same scale as death.
For a population, load is the sum of the load due to death rates and prevalence of illness over a specified period of time. It is expressed as a rate. The choice of time period may vary according to the application and may be a year or a lifetime. The basic equation is:
(2)
where m is the mortality rate expressed as the proportion of individuals dying during a defined time period (e.g. 1 year); D is the Load attributed to death; j indexes possible health states 1, 2, … k. The set of states includes the state healthy and the state dead; pj is the probability that an individual, who is alive at the start of the year, will be in state j at any time during the year. This is the estimated point prevalence of state j (pj = Nj/N), where Nj is the number of cases in state j and N is the population. For the population the sum of probabilities is 1 (
); and lj is the load attributed to being in state j for a defined period (e.g. 1 year). The defined period is the same as that used for the estimation of mortality rate, m. The weights attributed to the states healthy and dead are both zero.
The component due to mortality alone is mD, which reduces to mortality rate m if D is given an arbitrary fixed load of 1 (D = 1.0). (Note that in the worked example in this paper we give D a value of D = −100). Similarly, the second expression reduces to point prevalence of illness if only one state j is considered, and lj is given an arbitrary weight of 1.
Other features can also be incorporated, but these add to complexity. For example, expressions can be created readily to allow for different weights for D, depending on the age and circumstances of death.
The essential concepts that distinguish the Load Model from the QALY model are defined in Equationequation (2)(2) . A physical analogy may be drawn between Load and the concept of power, which also uses the term “load” as in the load on the electricity supply system. Morbidity load lj is analogous to the rate of energy use per unit time (power), while mortality load D is analogous to a loss of energy attributed to the time of death.
A special case of EquationEquation (2)(2) is that of a single period of interest for one individual. We can estimate average loadi for one individual (i) over the period as the sum of that due to morbidity and mortality, divided by length of the period. The period of interest may be a fixed number of years, survival following diagnosis or treatment, or a whole lifetime.
(3)
Where D is load attributed to death of individual i; lj is load attributed to being in state j for time unit (e.g. 1 year); tj is the number of time units (e.g. years) spent by individual i in state j; and T is the total period of interest.
To avoid dividing by zero, immediate death is allocated to the time unit in which it occurs.
A worked example
A simple worked example demonstrates some of the differences between the Load and QALY models using the single lifetime special case. This is the simplest case to understand. The results are set out in six steps:
Standard gamble;
Derivation of load l2;
Derivation of qaly h2;
Load for a hypothetical life;
QALYs for a hypothetical life; and
Comparison of four alternative outcomes.
Results
Standard gamble
The von Neumann-Morgenstern standard gamble is the classical method of measuring cardinal preferencesCitation20. In this example we use a slightly modified version, although other preference methods could be used ().
Figure 1. Standard gamble example.
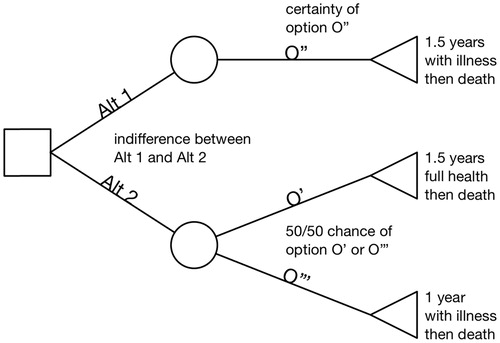
An individual judge, accepting the axioms of utility theory, expresses indifference to the following choice:
EITHER (Alt 1) life expectancy of 1.5 years with illness (j = 2) throughout (outcome O″)
OR (Alt 2) a lottery with 50/50 chance (p = .5) of EITHER (best option) 1.5 years life expectancy with full health (j = 1) throughout (outcome O′) OR (worst option) 1 year life expectancy with illness (j = 2) throughout (outcome O′″);
The indifference between certainty O″ and the lottery can be expressed as
In general terms
(4)
where weight(O) is the weight or utility attributed to outcome O.
Derivation of load l2
Using EquationEquation (3)(3) :
With a load of −100 attributed to the event death, D = − 100.
Applying these to EquationEquation (4)(4) with p = 0.5
which yields a load of l2 = − 33.3 for this state of illness.
Derivation of qaly h2
Exactly the same indifference judgement is used to derive qaly h2, using EquationEquation (4)(4) and the QALY model, EquationEquation (1)
(1) :
Using a similar calculation, this gives a value of h2 = 0.75 for illness.
Based on the EQ-5D-5L five-level descriptive frameworkCitation21 and value set for EnglandCitation22, this valuation (h2 = 0.75) is consistent with a person in EQ-5D-5L state 21322 for which h = 0.751 (Slight problems in walking about, no problems washing and dressing himself, moderate problems in doing usual activities (e.g. work, study, housework, family, or leisure activities), slight pain or discomfort, and slightly anxious or depressed).
These calculations h2 = 0.75 for the QALY model and l2 = − 33.3 for the Load Model are used in the second part of the worked example below.
The results so far are summarized in , showing the main conceptual differences between the QALY and Load models.
Table 1. Comparison of values and weights for different states using the Load and QALY models using the same judgment.
Load for a hypothetical life
Now we consider a hypothetical life span for an individual from birth T0 to his death. He is in full health for period t1 = 72 years, falls ill (with constant severity) for period t2 = 3 years and dies at the age of 75 (t1 + t2).
While he is in full health t1, no load (suffering) is generated by disease and l1 = 0. While he is sick the load is l2 per annum; over time t2 this is represented by l2 t2.
The load for his death is D. The state “dead” (after death) has load l = 0.
Average lifetime load is given by EquationEquation (2)(2) and simplifies as follows:
where D = − 100 and l2 = − 33.3:
In this example, the load due to mortality and morbidity components are equal.
QALYs for a hypothetical life
Now we apply the same data to the QALY model. His quality-adjusted life expectancy is given by Equationequation (1)(1) , which simplifies as follows:
Given t1 = 72 years, t2 = 3 years, and h2 = 0.75, as calculated above:
Given a length of life of 75 years, the reduction due to morbidity is 75 − 74.25 = 0.75 qaly. The length of life (mortality) and morbidity components are 75 and 0.75, respectively (ratio of 100/1).
These results, showing the number of years in each state and the weight attributed to each in both the QALY and Load models, are summarized in .
Table 2. Application of Load and QALY models to a hypothetical lifetime that is well for 72 years followed by 3 years of illness and death.
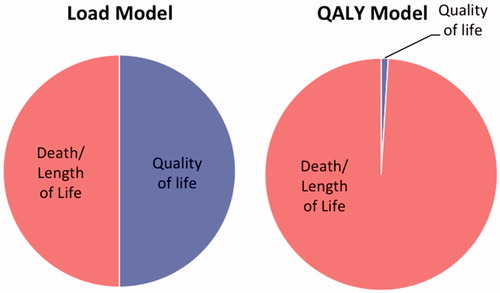
shows the relative sizes of the morbidity and mortality components of the Load and QALY views of a single lifetime.
Figure 2. Relative sizes of mortality and morbidity components for one lifetime using Load and QALY models.
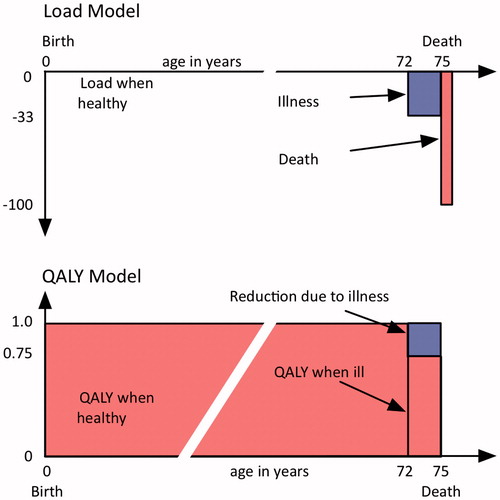
This information is shown on a time axis in . In the Load model, the component due to death is shown as accruing during the year following death. This convention also avoids the problem of dividing by zero when calculating the load for immediate death.
Figure 3. The Load model (top) and QALY model (bottom) for a hypothetical individual who dies aged 75 after 3 years of illness.
Compare alternative outcomes
In practice the main interest in these models is in examining differences between treatment outcomes. We can illustrate this by considering four alternative outcomes for our individual, based on a hypothetical operation at age 72 (). Both qalys and load are calculated from age 72.
Table 3. Comparing four outcomes starting at age 72.
Differences in QALYs (Δqaly) and Load (Δload) are relative to the base (option #1). For both models, higher values of qaly, Δqaly, load, and Δload are all good, negative numbers are worse. Option #2 (immediate death) is the least desirable option for both models. Options #3 (lives 3 years, illness completely relieved) and #4 (lives 4 years with illness) are equivalent in the QALY model, but option #3 is preferred to option #4 in the Load model.
Discussion
In our numerical example, the relative sizes of the components for morbidity and mortality in the two conceptual models (Load and QALY) differ greatly when looking at a whole lifetime. These calculations are based on identical patient data (length of life and amount of illness) and preference judgments. The only difference is the conceptual model. When comparing alternative outcomes for a specific individual or condition, as shown in , the differences are less pronounced, but are still substantial.
The motivation for developing the Load model was that the QALY model produces results that do not correspond with peoples’ behaviour. A desire to understand such anomalies is one of the reasons why new paradigms are developedCitation23.
The concept of life expectancy was developed originally in the 17th, 18th, and 19th centuries as a practical tool to aid the administration of pension and life insurance companies (friendly societies), whose income, based on contributions received from members, and expenditure such as payment of benefits, are directly related to life expectancy. The need to balance income and expenditure led to detailed surveys of mortality and sickness rates for different trades and localitiesCitation24 and the development of actuarial science. Life expectancy data was vital for business planning in pension companies, but was not originally designed as a measure of health.
Reduction of suffering (what we call load), rather than maximization of health, was the focus of seminal papers by authors such as Culyer et al.Citation25, and Rosser and WattsCitation26, before both WilliamsCitation27 and Rosser espoused QALYs. Rosser and WattsCitation28 used the QALY model with data from the General Household Survey to estimate the weighted life expectancy for the population of Great Britain. They found that the morbidity component was small (in the range 1–3% depending on various assumptions) and suggested that complete elimination of all morbidity would have about the same effect as an overall increase in life expectancy of `1 year. Their results are comparable to those in our QALY example.
This paper has its origins in the late 1970s, when the author worked with RosserCitation29. An early version was presented to the Health Economics Study Group at the University of York in 1979. The work was not developed further or published at that time, mainly because the author went on to work in digital healthCitation30. A brief outline (under the name Existential Model) was published as a letter to the BMJ in 1998Citation31.
Between 1981–2012 there were large increases in life expectancy at birth in England and Wales, rising by 8 years for men (from 71 to 79 years) and 6 years for women (from 77 to 83 years). During the same period death rates fell by `60% in men and 40% in women in most age groups (other than those 25–50 and over 85)Citation32; however, morbidity caused by chronic conditions is a growing problem. With more people living longer, society needs to focus increasingly on their quality-of-life and independence, or services will be overwhelmedCitation33. This means we need models, such as the Load model, which give greater weighting to morbidity than to extension of a poor quality-of-life.
Using data about fatal traumatic job injuries in people of working age, Gentry and ViscusiCitation34 analysed the fatality and morbidity components of the weight of statistical life and suggest a morbidity weight of between 11–25% of the total. The consequences of fatalities at work are likely to be perceived as being substantially higher than those attributed to death from natural causes later in life, which further supports the Load model rather than the QALY model. We have not found other work that combines a measure of morbidity and mortality as proposed in the Load model.
The QALY model places higher value on saving the life of someone who is initially less ill than on one who is more ill. In the Load model the benefit of saving a life, or delaying a death, is independent of the individual’s initial health state.
The QALY model treats all deaths in the same way, while the Load model allows for different loads to be attributed to death according to context, while still allowing for deaths to be treated as equal if desired. The QALY model includes difficult concepts such as states worse than being dead, which are not needed in the Load model. The Load model treats death as an event, not as a state.
An important difference between the two models is that in the QALY model, full health has a value of 1 (100% health) and being dead has a value of 0 (0% health), while in the Load model both full health and being dead have a load of zero (0% morbidity).
Many studies have shown that agreement between different preference-based measures is quite low and they give substantially different results for similar cohorts of patientsCitation2,Citation20,Citation35–37. It seems likely that some of the differences between different QALY-based measures may be explained by variation in the way in which the valuation questions are asked and results are processedCitation38. If people are directed to think about a problem in a particular way, they will try to do that, even when they find it hard to do so. If less strongly directed, they will do as they think best, which may be different. However, such differences are small in comparison to the differences demonstrated here between the Load and QALY conceptual models.
Philosophically, the welfarist QALY model is an example of classical utilitarianism, while the Load model is based on average negative utilitarianism. Philosophers in the 20th century, such as Heidegger, Popper, and Rawls, recognized that these were very different and argued strongly against applying classical utilitarianism to social problems.
Heidegger said that we are unaware of things when they are normal; our conscious concern is with the abnormal. For example, we are not aware of using a door handle when we enter a room unless it is brokenCitation39. Similarly, we are not consciously aware that our body is healthy; we become aware of our body when it gives us symptoms. This existential approach directs attention to aspects of health that we are aware of, such as distress, disability, and death.
PopperCitation40 exhorted us not to seek to maximize good, but to minimize misery and misfortune, and argued that these are asymmetrical. One person’s suffering or death may not be traded to improve another person’s happiness. There is an analogy here with Popper’sCitation40 premise that the task of science is to eliminate false theories, not to attain ultimate truth.
RawlsCitation41 suggests that classical utilitarianism is inconsistent with the principals of justice and that average utility is the most plausible form of utilitarianism. By the same argument a health indicator based on the principle of average negative utility should be preferred to one based on classical utilitarianismCitation42.
More recently, developments in behavioural economics and psychology, such as prospect theory, loss aversion, framing and projection bias, have raised many questions about the assumptions built into the neo-classical economics approachCitation43,Citation44.
Little attention has been paid to the underlying conceptual model of measures of health. The main controversies have been around welfareism, extra-welfareism, and capabilitiesCitation45. The prevailing view has been that most problems, such as findings that measurement tools generate substantially different resultsCitation46, can be solved by improving the survey instruments and valuation techniquesCitation2,Citation47. Work using the Load model can build on and reuse this work.
To bring the Load model into actual use, work will be needed to derive weights for different states of illness on the same scale as that used for death. This could use current descriptive classification systems and methods for measuring social preferences and even re-use existing data, as demonstrated in our example. A classification and weighting system for the circumstances and mode of death may be useful, although the Load model works if all deaths are considered to be equal. A scale for different deaths could be based on approaches used by governments for the value of statistical lifeCitation48.
The examples provided in this paper have been simplified to assist understanding, but the conclusions appear to be robust to variations in data. The core model is set out in Equationequation (2)(2) , but our worked example uses a simplified special case, as set out in Equationequation (3)
(3) . The Load model is a different paradigm from the QALY model. The QALY model has been in use for `40 years and a generation of economic evaluators has become used to dealing with it and the issues it creates. A similar learning curve may be needed for the Load model.
There are several difficulties with the Load model. As an average, rather than summative model, it depends on the length of time used in the denominator. For example, the load of death, assuming otherwise being in full health, is inversely related to longevity. This may or may not be valid. The potential problem of immediate death, which would involve dividing by zero, is handled by apportioning the weight of death to the year following death.
Any model is a simplified representation of aspects of either the real world or one we hope to create. We can test how accurate that representation is. For example, it would be relatively straightforward to test whether the Load or the QALY model is better at describing and predicting people’s preferences and behaviour, by using evidence about what people think and do in practice.
This paper is conceptual in nature, but provides a starting point for different lines of enquiry.
Conclusions
The purpose of this paper is to set out the core concepts of the Load model and compare these with the QALY model. The choice of conceptual model has substantial implications for many aspects of healthcare resource allocation and economic assessment.
The Load model differs from the QALY model in treating the objective of healthcare as the reduction of the rate of suffering and other consequences of illness and death, as opposed to increased quality-adjusted life expectancy. In the load model, death is treated as an event, not as a state, and may have a weight that varies according to context.
The two models give starkly different relative values to the morbidity and mortality components. In a worked example, the morbidity and mortality components in the Load model are similar, while in the QALY model, the morbidity component is only a small fraction of the length of life (mortality) component.
The purpose of all health indicators is to guide decision-making by representing social preferences. A good model should predict what people do in practice. Commentators stress the importance of healthcare in improving both the quality-of-life as well as its quantity, yet the QALY model gives a very low lifetime weight to quality-of-life relative to quantity, while the Load model suggests that the relative components due to morbidity and mortality are more comparable. When different models give such different relative weights for morbidity and mortality, it raises serious doubts, which need to be resolved, about the appropriateness of their use as a guide to decision-making and the robustness of the conclusions reached.
Transparency
Declaration of funding
No funding has been declared for this paper.
Declaration of financial/other relationships
TB is a shareholder in R-Outcomes Ltd. and Abies Ltd. JME peer reviewers on this manuscript have no relevant financial or other relationships to disclose.
Acknowledgments
The author wishes to acknowledge the suggestions and advice given at the meeting of the Health Economists Study Group, Gran Canaria, June 2016, and, in particular, invaluable comments from the discussant, Professor Aki Tsuchiya of Sheffield University. Many of her suggestions have been included. I also wish to acknowledge the helpful suggestions of JME peer reviewers.
References
- Drummond MF, Sculpher MJ, Claxton K, et al. Methods for the economic evaluation of health care programmes, 4th edn. Oxford, UK: Oxford University Press, 2015
- Brazier J, Ratcliffe J, Salomon JA, et al. Measuring and valuing health benefits for economic evaluation. Oxford, UK: Oxford University Press, 2007
- Timmins N, Rawlings M, Appleby J. A terrible beauty: a short history of NICE, the National Institute for Health and Care Excellence. Nonthaburi: Health Intervention and Technology Assessment Program (HITAP), 2016
- Weinstein M. Cost-per-QALY in the US and Britain: damned if you do and damned if you don't. 18th Annual Lecture 2011. London: Office of Health Economics Monograph, 2015
- IQWiG. General methods (Allgemeine Methoden). Version 4.2. Cologne: Institute for Quality and Efficiency in Health Care (Institut für Qualität und Wirtschaftlichkeit im Gesundheitswesen), 2015
- Porzsolt F, Pressel H, Maute-Stephan C, et al. Appraisal of health care: from patient value to societal benefit. J Public Health 2009;18:297-302
- Shah K, Praet C, Devlin N, et al. Is the aim of the English health care system to maximize QALYs? J Health Serv Res Policy 2012;17:157-63
- Schlander M. Measures of efficiency in healthcare: QALMS about QALYs? Z Evid Fortbild Qual Gesundhwes 2010;104:214-26
- McHugh N, Baker RM, Mason H, et al. Extending life for people with a terminal illness: a moral right and an expensive death? Exploring societal perspectives. BMC Medical Ethics 2015;16:1
- Nord E. Cost-value analysis in health care: making sense out of QALYs. Cambridge, UK: Cambridge University Press, 1999
- Rawles J. Castigating QALYs. J Med Ethics 1989;15:143-7
- Beresniak A, Medina-Lara A, Auray JP, et al. Validation of the underlying assumptions of the quality-adjusted life-years outcome: results from the ECHOUTCOME European project. Pharmacoeconomics 2015;33:61-9
- Schlander M, Garattini S, Holm S, et al. Incremental cost per quality-adjusted life year gained? The need for alternative methods to evaluate medical interventions for ultra-rare disorders. J Comp Eff Res 2014;3:399-422
- Reed Johnson F. Moving the QALY forward or just stuck in traffic? Value Health 2009;12(1 Suppl):S38-S9
- Arnesen T, Nord E. The value of DALY life: problems with ethics and validity of disability adjusted life years. BMJ 1999;319:1423-5
- Sen A. 1993. Capability and well-being. In: Nussbaum M, Sen A, eds. The quality of life. Oxford, UK: Oxford University Press, 1993. p 270-93
- Coast J, Flynn TN, Natarjan L, et al. Valuing the ICECAP capability index for older people. Soc Sci Med 2008;67:874-82
- Fanshel S, Bush JW. A health-status index and its application to health-services outcomes. Oper Res 1970;18:1021-66
- Torrance GW, Thomas WH, Sackett DL. A utility maximization model for evaluation of health care programs”. Health Serv Res 1972;7:118-33
- Torrance GW. Measurement of health state utilities for economic appraisal: a review. J Health Econ 1986;5:1-30
- Herdman M, Gudex C, Lloyd A, et al. Development and preliminary testing of the new five-level version of EQ-5D (EQ-5D-5L). Qual Life Res 2011;20:1727-36
- Devlin N, Shah K, Feng Y, et al. Valuing health-related quality of life: an EQ-5D-5L value set for England. London: Office of Health Economics, 2016. Research Paper 16/01
- Kuhn T. The structure of scientific revolutions. Chicago, IL: University of Chicago Press, 1962
- Ratcliffe H. Observations on the rates of mortality and sickness existing amongst friendly societies. Manchester, UK: The Manchester Unity of the Independent Order of Oddfellows, 1850
- Culyer AJ, Lavers RJ, Williams A. Social indicators: health. Social Trends 1971;2:31-42
- Rosser R, Watts V. The measurement of hospital output. Int J Epidemiol 1972;1:361-8
- Williams A. Discovering the QALY, or how Rachel Rosser changed my life. In: Oliver A, ed. Personal histories in health research. London: Nuffield Trust, 2005. p 191-206
- Rosser R, Watts V. The measurement of illness. J Oper Res Soc 1978;29:529-40
- Rosser R, Benson T. New tools for evaluation: their application to computers. In: Anderson J, ed. Medical Informatics Europe 78. Berlin Heidelberg: Springer, 1978. p 701-10
- Benson T, Grieve G. Principles of health interoperability: SNOMED CT, HL7 and FHIR. London: Springer, 2016
- Benson T. How should different life expectancies be valued? Existential model may be better than scale using quality adjusted life years. BMJ 1998;317:1155
- Bennett JE, Li G, Foreman K, et al. The future of life expectancy and life expectancy inequalities in England and Wales: Bayesian spatiotemporal forecasting. Lancet 2015;386:163-70
- Newton JN. Future inequalities in life expectancy in England and Wales. Lancet 2015;386:115-17
- Gentry PE, Viscusi WK. The fatality and morbidity components of the value of statistical life. Vanderbilt University Law and Economics working paper. 2015. 15-4
- Kopec JA, Willison KD. A comparative review of four preference-weighted measures of health-related quality of life. J Clin Epidemiol 2003;56:317-25
- Moock J, Kohlmann T. Comparing preference-based quality-of-life measures: results from rehabilitation patients with musculoskeletal, cardiovascular or psychosomatic disorders. Qual Life Res 2008;17:485-95
- Quercioli C, Messina G, Barbini E, et al. Importance of sociodemographic and morbidity aspects in measuring health-related quality of life: performances of three tools: comparison of three questionnaire scores. Eur J Health Econ 2009;10:389
- Feng Y, Devlin N, Shah K, et al. New methods for modelling EQ-5D-5L value sets: an application to English data. London: Office of Health Economics, 2016. Research Paper 16/02
- Dreyfus H. Husserl, Heidegger and modern existentialism. In: Magee B, ed. The great philosophers: an introduction to Western philosophy. London: BBC Books, 1987. p 252-77
- Popper K. The open society and its enemies. Vol I. The spell of Plato, 5th edn. London: Routledge Kegan Paul, 1966. p 284-5
- Rawls J. A theory of justice. Cambridge, MA: Harvard University Press, 1971. p 161-6
- Jones MB. Health Status Indexes: the trade-off between quantity and quality of life. Social-Econ Plan Sci 1977;11:301-5
- Hough DE. Irrationality in healthcare: what behavioural economics reveals about what we do and why. Stanford, CA: Stanford University Press, 2013
- Kahneman D. Thinking, fast and slow. New York, NY: Farrar, Sraus and Giroux, 2011
- Cookson R, Claxton K. The humble economist: Tony Culyer on health, health care and social decision making. York, UK: University of York and Office of Health Economics, 2012
- Richardson J, Khan PA, Iezzi A, et al. Comparing and explaining differences in the magnitude, content, and sensitivity of utilities predicted by EQ-5D, SF-6D, HUI 3, 15D, QWB and AQoL-8D multiattribute utility instruments. Med Dec Making 2015;35:276-91
- Appleby J, Devlin N, Parkin D. Using patient reported outcomes to improve health care. Oxford: John Wiley & Sons, 2016
- Viscusi WK, Aldy JE. The value of a statistical life: a critical review of market estimates throughout the world. J Risk Uncertain 2003;27:5-76