
Abstract
Objectives: This analysis aimed to evaluate the cost-effectiveness of pembrolizumab compared with docetaxel in patients with previously treated advanced non-squamous cell lung cancer (NSCLC) with PD-L1 positive tumors (total proportion score [TPS] ≥ 50%). The analysis was conducted from a US third-party payer perspective.
Methods: A partitioned-survival model was developed using data from patients from the KEYNOTE 010 clinical trial. The model used Kaplan-Meier (KM) estimates of progression-free survival (PFS) and overall survival (OS) from the trial for patients treated with either pembrolizumab 2 mg/kg or docetaxel 75 mg/m2 with extrapolation based on fitted parametric functions and long-term registry data. Quality-adjusted life years (QALYs) were derived based on EQ-5D data from KEYNOTE 010 using a time to death approach. Costs of drug acquisition/administration, adverse event management, and clinical management of advanced NSCLC were included in the model. The base-case analysis used a time horizon of 20 years. Costs and health outcomes were discounted at a rate of 3% per year. A series of one-way and probabilistic sensitivity analyses were performed to test the robustness of the results.
Results: Base case results project for PD-L1 positive (TPS ≥50%) patients treated with pembrolizumab a mean survival of 2.25 years. For docetaxel, a mean survival time of 1.07 years was estimated. Expected QALYs were 1.71 and 0.76 for pembrolizumab and docetaxel, respectively. The incremental cost per QALY gained with pembrolizumab vs docetaxel is $168,619/QALY, which is cost-effective in the US using a threshold of 3-times GDP per capita. Sensitivity analyses showed the results to be robust over plausible values of the majority of inputs. Results were most sensitive to extrapolation of overall survival.
Conclusions: Pembrolizumab improves survival, increases QALYs, and can be considered as a cost-effective option compared to docetaxel in PD-L1 positive (TPS ≥50%) pre-treated advanced NSCLC patients in the US.
Introduction
Lung cancer is a common malignancy in the US, with 224,390 new cases and 158,080 deaths projected to occur in 2016Citation1. Non-small cell lung cancer (NSCLC) represents 85% of all lung cancersCitation2. Long-term prognosis is poor, since ∼70% of subjects with NSCLC have advanced disease not amenable to surgical resection at the time of diagnosis. Furthermore, a significant percentage of patients with early stage NSCLC who undergo treatment subsequently develop distant recurrenceCitation3. First-line therapy for advanced NSCLC consists of platinum-based doublets with or without bevacizumab and/or maintenance therapyCitation4. Patients with activating epidermal growth factor receptor (EGFR) mutations or anaplastic lymphoma kinase (ALK) gene rearrangements are also eligible to receive tyrosine kinase inhibitor (TKIs) targeted to these genetic tumor aberrations. Despite the benefits of platinum doublets and TKIs, virtually all patients experience progression of disease. For patients with progression following initial therapy, single agent regimens have traditionally been the standard of care, with docetaxel, pemetrexed (non-squamous), erlotinib, and gemcitabine the most commonly used regimensCitation5. Median overall survival for previously treated NSCLC receiving these therapies ranges from 5.7–9.3 monthsCitation6–8.
Immunotherapy is a new paradigm for NSCLC treatment, and targeting the programmed cell death-1 (PD-1) pathway is a promising therapeutic option. Binding of PD-1 to its ligands (PD-L1 and PD-L2) on tumor cells suppresses T-cells through a negative feedback loop, leading to evasion of the immune responseCitation9,Citation10. Pembrolizumab is a humanized monoclonal PD-1 antibody that blocks the interaction between PD-1 and PD-L1 receptors, thereby potentiating the expression of T-cells including anti-tumor response. Pembrolizumab received approval by the US Food and Drug Administration (FDA) in October 2015 for metastatic NSCLC whose tumors express PD-L1 in patients with disease progression on or after platinum-containing chemotherapy. The use of PD-L1 as a predictive biomarker for anti-PD1 therapy was supported by KEYNOTE-001, where the objective response rate (ORR) was 43.9% for pembrolizumab in previously treated patients with a tumor proportion score (TPS) ≥50%. This ORR was well above the historically reported ORR for docetaxelCitation11.
Recently, the KEYNOTE 010 trial demonstrated that patients with TPS ≥50% treated with pembrolizumab 2 mg/kg every 3 weeks had superior overall survival (OS) as compared to docetaxel treated patients, with a hazard ratio for mortality of 0.54 (95% CI =0.38–0.77; p = 0.000,24)Citation12. Progression-free survival was significantly longer with pembrolizumab 2 mg/kg than with docetaxel (median 5.0 months vs 4.1 months; HR =0.59, 95% CI =0.44–0.78; p = 0.0001). Grade 3–5 treatment related adverse events were less common with pembrolizumab 2 mg/kg than docetaxelCitation12.
In this study, we extend understanding of the implications of results from the KEYNOTE 010 trial by comparing pembrolizumab with docetaxel on overall survival, quality-adjusted survival, cost, and cost effectiveness in previously treated advanced NSCLC with TPS ≥50% from a US third-party payer perspective.
Methods
To evaluate the economic implications of treating biomarker-identified (TPS ≥50%) advanced NSCLC patients with pembrolizumab 2 mg/kg vs docetaxel, incremental cost per quality-adjusted life-year (QALY) gained and incremental cost per life-year (LY) gained were estimated in generating an incremental cost-effectiveness ratio (ICER). A model-based decision-analytic approach was taken, with partitioned survival modelling utilized. Main clinical efficacy, utility, and safety data used in the model were derived from the KEYNOTE 010 trialCitation12.
Treatment population
The treatment population of the model was based on the KEYNOTE 010 eligibility criteria. This included advanced NSCLC patients who were at least 18 years of age (average age of 62 years) who had experienced disease progression after a platinum-containing systemic therapy. Patients with EGFR or ALK genomic tumor aberrations who demonstrated progression of disease on an appropriate TKI prior to receiving pembrolizumab were also included.
Randomization of the KEYNOTE 010 was stratified by PD-L1 status, with the intention-to-treat (ITT) population in the TPS ≥50% PD-L1 stratum and the overall positive (TPS ≥1%) PD-L1 population the primary populations for the analyses of efficacy data in KEYNOTE 010. Pembrolizumab is currently indicated in the US for previously treated metastatic NSCLC patients with PD-L1 TPS ≥50%, with data from TPS ≥50% patients utilized in the model unless otherwise specified.
Model structure
A cohort simulation model was used to estimate health outcomes and costs for each regimen in the specific patient population. The transition diagram of the cohort simulation model is shown in . There are three mutually exclusive health states in the model: Progression-free state (PF), Progressive-disease state (PD), and Death.
Figure 1. Transition diagram for the cohort simulation model.
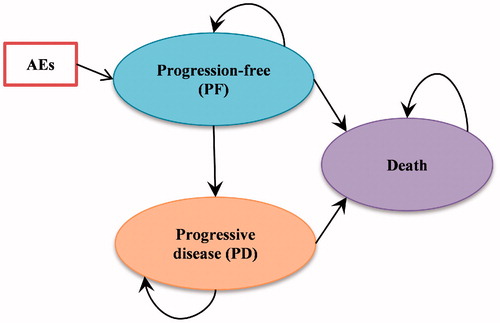
In this model, progression was defined by independent review committee (IRC) review using RECIST V1.1 criteriaCitation13, and patients were censored according to this definition with respect to the endpoint of progression within the KEYNOTE 010 clinical trial. A model cycle length of 1 week was considered sufficient to reflect the patterns of treatment administration and the transitions to disease progression and death.
The analyses adopted a partitioned-survival model approach, which partitions the overall survival (OS) time into progression-free survival (PFS) and post-progression survival. It is very similar to a Markov model, where outcomes (cost, life time, and quality-adjusted life time) are evaluated for each health state. However, unlike a Markov model, in which transition probability between any two health states is needed, a partitioned-survival model directly estimates proportions of patients in each health state at each time point. The partitioned-survival approach utilizes the PFS and OS survival data directly, without using transition probabilities.
For each health state, a specific cost and quality-of-life adjustment weight (i.e. utility) is assigned within each time period for calculating the cumulative costs and cumulative quality-adjusted life years over the course of time.
Time horizon, discount rate
In line with recommendations from multiple HTA agencies (e.g. NICE UKCitation14; CADTH CanadaCitation15), a time horizon long enough to accommodate life expectancy for advanced NSCLC patients was selected to assure important differences in costs and outcomes between the technologies were considered. For the model base case, a 20-year time horizon was used. Time horizon was varied in sensitivity analyses.
Pembrolizumab has evidence of durable clinical benefit in advanced NSCLCCitation11,Citation16, when compared with prior RCTs of other regimens for a similar disease stage. The median follow-up available from KEYNOTE 010 was 57 weeks. The lifetime horizon required extrapolating the survival data many years beyond the trial duration. The base case OS modeling approach projected that 0.7% of patients would still be alive at 20 years after initiating pembrolizumab, therefore justifying the use of a 20-year time horizon.
As recommended by the US Guidelines for the Economic Evaluation of Health TechnologiesCitation17, costs and health outcomes were discounted at a rate of 3% per year. Discount rates of 0% and 5% were explored in sensitivity analyses.
Clinical parameters and model inputs
The model effectiveness parameters were estimated from KEYNOTE 010 patient-level data for time on treatment (ToT), PFS and OS. For pembrolizumab, only the results from the 2 mg/kg Q3W dosing were considered.
As an overall modeling approach, parametric models were fit to the KM ToT (pembrolizumab only), PFS, and OS data to extrapolate the outcomes over the model time horizon. The survival curve fitting was carried out in line with the NICE Decision Support Unit (DSU) guidelinesCitation18. The proportional hazard assumption was verified to assess whether independent survival models were to be explored in each treatment arm. The parametric models fit were the Weibull, the exponential, the log-normal, the log logistic, and the Gompertz distributions. Statistical tests based on the Akaike Information Criterion (AIC) and the Bayesian information criterion (BIC), combined with visual inspection (comparing fitted distributions to study KM plots), were used to select the best-fitting parametric distributions for the base-case. Finally, the clinical plausibility of the extrapolated results was considered in selecting the final distribution functions for the model.
Time on treatment
In KEYNOTE 010, some patients were kept on pembrolizumab treatment and derived clinical benefit after documented disease progression. Therefore, the ToT data were analyzed to better capture the treatment cost. Considering that many patients were still on pembrolizumab treatment by the data cut-off date, a parametric function was fit to the KM data to estimate treatment duration. The AIC and BIC combined with visual inspection were used to select the Gompertz distribution for the base-case. For docetaxel, the Kaplan Meier curve reached 0% for ToT, thus avoiding the need for parametric extrapolation.
Progression-free survival
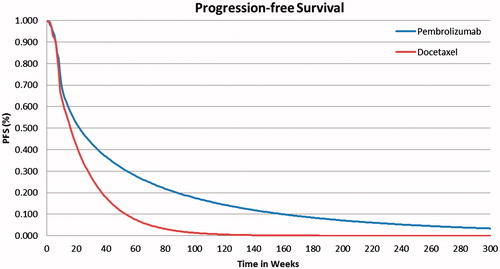
In KEYNOTE 010, the first radiologic tumor response assessment was performed at week 9. This resulted in a protocol-driven drop of PFS between weeks 8 and 9, making the fitting of a parametric curve very challenging in both treatment arms. As a consequence, the KM data were used directly for the first 9 weeks of the model time horizon and parametric functions were fitted onwards. Because violation of the proportional hazard assumption was confirmed, separate models were used for pembrolizumab and docetaxel.
The best fitting model for pembrolizumab PFS according to the AIC and BIC and visual inspection used a Weibull parametric function. The log logistic was the second best fitting and its impact was tested in a scenario analysis. For docetaxel PFS outcomes, an exponential parametric function provided the best fitting model by both statistical criteria and visual inspection. The Gompertz distribution was closely competing for the best fit; it too was tested in a scenario analysis. The base case PFS curves are presented in for pembrolizumab and docetaxel, respectively.
Figure 2. Modeled progression-free survival from KEYNOTE 010 for pembrolizumab and docetaxel.
Overall survival
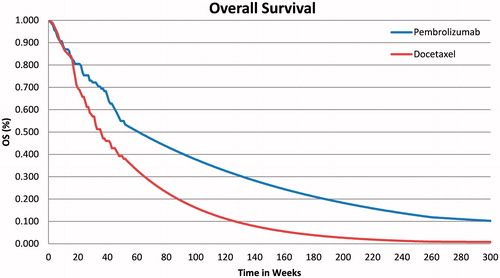
For the OS outcomes, the standard parametric curves tested did not seem to provide good visual fit to the observed KM data, especially for the pembrolizumab arm. All tested parametric curves appear to under-estimate observed OS between weeks 21–39 and over-estimate observed OS between weeks 39–65. Therefore, a 2-phase piecewise model was explored. The first phase used unadjusted KM data followed by projections of long-term OS using an exponential model fitted to the remaining KM data in the second phase. In recent NSCLC Guidance reportsCitation19,Citation20, the NICE Evidence Review Group (ERG) has preferred this approach to fitting a parametric function distribution over the entire time horizon period.
For both treatment arms, inspection of the cumulative hazard plots showed the changes in hazard to not be constant over time. Results suggested a piecewise model with a turning point at ∼52 weeks would be appropriate. The proportional hazard assumption was not supported, and, thus, the OS for pembrolizumab and docetaxel were modeled separately. To model OS for pembrolizumab, the area under the KM OS curve was used directly for the first 52 weeks (34 patients at risk of death at 52 weeks) and an exponential distribution was then used to estimate OS for the subsequent time period up to 5 years of follow-up. Similar to the pembrolizumab arm, the KEYNOTE 010 KM OS distribution for docetaxel was used for the first 52 weeks (30 patients at risk of death) of the model and an exponential distribution was used for extrapolating OS thereafter, up to 5 years.
For longer-term OS extrapolation, the US SEER data in advanced stage IIIB and IV NSCLC patients were included in the model, representing the baseline disease stages for patients in the trialCitation21. The cumulative hazard plot of the SEER OS data was used to derive a plausible constant hazard rate applied in the model from year 5 onwards. As the SEER survival data are defined from the time of diagnosis to death and do not specify the line of therapy, for modeled survival time after 5 years, we applied the derived constant hazard rate to the OS models in both pembrolizumab and docetaxel arms, assuming the long-term survival trend was independent of prior therapy. Considering the mean time of 76 weeks (1.5 years) from diagnosis to randomization in KEYNOTE 010 patients, the constant hazard rate was estimated from year 6.5 onwards from the SEER stage IIIB and IV data. This approach was implemented in the base case of the model. The resulting OS curves are presented in for pembrolizumab and docetaxel, respectively.
Figure 3. Modeled overall survival from KEYNOTE 010 for pembrolizumab and docetaxel.
Adverse experiences and subsequent therapies
The model included all-cause adverse events (AEs) of Grade 3+ reported in ≥5% of patients in KEYNOTE 010 for either pembrolizumab or docetaxel. The incidences of these AEs in KEYNOTE 010 are described in . Hospitalization costs and disutility associated with the selected grade 3–5 AEs were considered in the model.
Table 1. Summary of key model inputs.
From KEYNOTE 010, 40% of pembrolizumab patients and 44% of docetaxel patients received a subsequent active therapy post-regimen discontinuationCitation12. The cost of those initial subsequent therapies was included in the model and the OS impact is assumed to be part of the OS Kaplan-Meier data from KEYNOTE 010. In the absence of data needed to model treatment sequencing, given the advanced nature of the disease and the lack of data on further subsequent lines of therapy, only one line of subsequent therapy is modeled. The top seven most common systemic therapies from the KEYNOTE 010 were included, and the percentages of patients receiving any other treatment were redistributed among the top seven treatments to ensure that the total proportion receiving subsequent therapy in either arm was aligned with the trial data. All patients received best supportive care (BSC) for the duration of their survival after disease progression, independent of both the treatment previously received and of whether they have received subsequent active therapy.
Utility data
The utilities for the base case were based on utility data collected from patients enrolled in the KEYNOTE 010 clinical trial. The EQ-5D questionnaire was administered at treatment cycles 1, 2, 3, 5, 9, 13 and every 4 treatment cycles as long as patients were on study treatment, at the treatment discontinuation visit, and at a 30-day post-treatment safety follow-up visit. Two approaches of defining health state utilities were considered: time-to-death and progression-based health states. The time-to-death approach, recently described by Hatswell et al.Citation23 in patients with metastatic melanoma, reflects the decline in cancer patients’ quality-of-life as they approach death. Five time-to-death categories were examined for use in the model base case. As there were no statistically significant or clinically meaningful differences in the mean time-to-death category EQ-5D scores by treatment arm, the scores from the pooled treatment groups were used ().
The utility by progression status approach was used in the scenario analyses. For each treatment arm, the mean EQ-5D scores associated with each health state (PF, PD) were estimated.
The generic health statuses assessed from the EQ-5D questionnaire were converted to population-based utility values using published algorithms. For the base case analysis, US-based scoresCitation24 were applied to US patients, UK-based scoresCitation25 for UK patients, and EU-based scoresCitation26 for all other patients. Utilities were similar in pembrolizumab and docetaxel treatment groups at baseline. Therefore, the model used a pooled utility score of 0.761 for the PF and a score of 0.687 for the PD health states, respectively, for both pembrolizumab and docetaxel. Utilities by treatment arm are explored in a scenario analysis. The death health state was assigned a utility of 0.
Utility data from KEYNOTE 010 were inadequate to robustly inform the disutilities associated with grade 3 + AEs. To model the disutility of AEs of Grade 3 or higher, disutility of AEs from literature data were implemented () using the utility values associated with KEYNOTE 010 patients not experiencing Grade 3+ AEs in the PF state and applying disutility of AEs from literature data. Mean duration (21.6 days) of grade 3+ AEs was estimated from KEYNOTE 010.
Resource utilization and costs
In this section, all costs prior to 2016 are updated to 2016 US dollars (USD) based on the Medical Care component of the Consumer Price Index (CPI)Citation27.
Pembrolizumab is available in single-use vials of 100 mg and is administered at a dose of 2 mg/kg every 3 weeks. The list price for pembrolizumab is $4,380.74 per 100-mg vial. The average number of vials per dose was calculated using the weight distribution of patients in the Flatiron databaseCitation28; the average weight of the participants was 73.26 kg (SD =17.99 kg). The average number of pembrolizumab vials per patient was 2.01 vials, with an average cost per dose of $8,805, 80% of which was assumed to be paid by third-party healthcare payers. Multiple vial sizes are available for docetaxel. At the recommended dose of 75 mg/m2 every 3 weeks, the average number of vials per dose was calculated using the body surface area distribution (mean =1.84 m2, SD =0.26 m2) of patients in the Flatiron database and an optimal vial mix algorithm to minimize the vial wastage under the scenario of no vial sharing. The cost per dose of docetaxel was estimated at $1,281, 80% of which was assumed to be paid by third-party healthcare payers. Administration costs for IV infusions based on the 2016 Center for Medicare and Medicaid Services (CMS) payment rates are presented in . No administration costs are assumed for oral regimens as they are self-administered. Administration times of pembrolizumab and docetaxel are 30 min and 60 min, respectively. Thus, the 1-h $280.27 per administration cost was incurred for each dose, 80% of which was assumed to be paid by healthcare payers.
In clinical practice, pembrolizumab or docetaxel treatment is expected to be continued until documented disease progression, unacceptable adverse events, or patient/physician decision to interrupt treatment. When none of these criteria is met, a stopping rule of 2 years was implemented per the KEYNOTE 010 protocol.
Concomitant medication for pembrolizumab and docetaxel was estimated using usage from KEYNOTE 010, and unit costs obtained from the 2016 Center for Medicare and Medicaid Services (CMS) payment ratesCitation29. Concomitant medication use was $13 per treatment cycle for pembrolizumab and $280 for docetaxel.
Disease management costs
The average weekly cost of disease management (excluding drug related costs) in the PF state were estimated based on the healthcare resource utilization data observed in the KEYNOTE 010 trial. Unit cost per HCRU item was obtained from the 2016 Center for Medicare and Medicaid Services (CMS) payment rates. The weekly disease management cost associated with pembrolizumab and docetaxel was estimated to be $1,282 and $1,623, 80% of which was assumed to be paid by third-party healthcare payers.
The average weekly cost of disease management for PD was estimated at $1,938 (third-party healthcare payer’s portion) based on a report by Ramsey et al.Citation30 on the cost of lung cancer in a US healthcare claim database. The cost associated with third-line lung cancer treatment was used to inform the cost in the progressive disease state in the model, as resource use was not collected following progression in the trial. The costs of chemotherapy administrations were excluded. The resulting cost was converted to a weekly cost ($2,178) and inflated to a 2016 value ($2,423), 80% of which was assumed to be paid by healthcare payers.
In KEYNOTE 010, the type and duration of additional anti-neoplastic treatments prescribed after discontinuation of the assigned study treatment were collected. A total of 40% of pembrolizumab patients and 44% of docetaxel patients received subsequent active therapy. Average treatment duration with those therapies was 88 days. It is worth noting that significantly more patients in the docetaxel arm (13%) received subsequent immunotherapy (<1%) treatment, which could have contributed to inflating the OS in that group.
Using prevalence of use, list price and number of doses estimated from average treatment duration received in KEYNOTE 010, the average cost of post-progression active therapy was estimated at $3,328 per patient in the pembrolizumab arm and $5,903 per patient in the docetaxel arm, including administration costs. No monitoring or AE management costs were, however, applied. These costs were one-time costs inputted at the first post-progression cycle in the model. The source of drug acquisition cost information was the Analysource databaseCitation31.
For the base case, the one-time cost of terminal care, assumed to include health care in the last month of life, was estimated based on a published cost for US patients with cancer at the end of lifeCitation32 ($25,300 in 2009 USD) inflated to 2016 costs. This cost included hospitalization, palliative chemotherapy, physician consultations, and laboratory and diagnostic tests. The resulting cost of terminal care considered in the base care was $31,114.
The model included all-cause adverse events (AEs) of Grade 3/4 reported in ≥5% of patients in KEYNOTE 010 for either pembrolizumab or docetaxel. Incidence and costs of such AEs from KEYNOTE 010 are summarized in . Based on incidences of AEs and management costs, the total average cost per patient for managing adverse events was estimated to be $346 for pembrolizumab and $889 for docetaxel.
Sensitivity analyses
Multiple scenario analyses were performed to explore the impact of different methodological choices. These include varying assumptions on treatment duration, the utility estimation approach, and the utility measure evaluated. Specifically, state-based utilities and the use of utilities calculated using a transformation of the QLQ-C30 quality-of-life instrumentCitation33 were explored.
One-way deterministic sensitivity analyses (DSA) were performed to evaluate the robustness of model results to plausible changes in model parameters including individual parameters from fitted extrapolative models, costs, time horizons, and discount rates. To test the robustness of the model with respect to uncertainty in model input parameters, a probabilistic sensitivity analysis (PSA) was performed using a second-order Monte Carlo simulation. In this analysis, each key model parameter was given a theoretical probability distribution. A random number generator was used to draw parameter values from each distribution, and these values were run through the model to generate estimates for the analysis. The Monte Carlo simulation included 1,000 iterations. The PSA was used to approximate the 95% credible interval (CI) for the ICER. Deterministic sensitivity analysis ranges and parameter distributions used in the PSA are detailed in .
Table 2. Base-case, deterministic sensitivity analyses parameter ranges, and probabilistic sensitivity analysis distributions.
Results
Base case results
Base-case results show a difference of $160,522 in the total average per-patient direct cost of treatment with pembrolizumab ($297,443) vs docetaxel ($136,921) over a 20-year time horizon (). The higher cost in the pembrolizumab arm was mainly driven by the drug acquisition cost and the disease management costs, which were directly impacted by PFS and OS benefits. Patients treated with pembrolizumab were projected to spend an average of 13.3 months in the PF health state and 13.7 months in the PD health state, resulting in a mean survival estimate of 2.25 years. Results for docetaxel-treated patients yield an average of 5.44 months in the PF state and 7.36 months in the PD state for a total mean survival time of 1.07 years. Pembrolizumab was projected to improve expected survival by 1.18 years. Pembrolizumab was also associated with an average QALY gain of 0.95 over docetaxel. The incremental cost per QALY gained with pembrolizumab vs docetaxel was $168,619.
Table 3. Base case economic results.
Sensitivity analyses
A variety of sensitivity analyses were performed, including one-way, two-way, scenario, and probabilistic analyses.
To evaluate the impact of PFS and OS extrapolations used in the model, the time horizon was varied between 5–20 years. Most of the costs are incurred in the first 2 years of the time horizon. While survival gains continued to be realized after 2 years, the gain in survival between 10–20 years was no longer as impactful on the ICER. With the shorter time horizon of 5 years, cost per LY gained was $158,896, and cost per QALY gained was $194,884.
Changes in the discount rate did not have a great impact on the results. The incremental cost per QALY gained ranged from $140,204 in the most advantageous situation where the costs were discounted at 5% and the health benefit at 0% to $200,295, where costs were discounted at 0% and health benefit at 5%.
Changes in the practice patterns were made from the base-case assumptions regarding time on treatment. Additional scenarios varied methodological choices such as the utility approach and its measures and the choice of base-case extrapolation distributional family.
Implemented practice impacting time on treatment for pembrolizumab will affect the results significantly. Treating all pembrolizumab patients until progression rather than the trial-based maximum of 2 years results in an ICER of $214,735 compared to the base case of $168,619. Use of projected PFS as a proxy for time on treatment when the two year stopping rule was applied did not result in a more meaningful difference (ICER = $167,374) than when using the time on treatment projections directly.
Alternative utility approaches and measures were explored in sensitivity analyses. Implementation of EQ-5D state-based utilities (pooled across patient groups) resulted in an expected gain of 0.86 QALYs with pembrolizumab, and an ICER of $186,213. Use of treatment-level utilities improved expected QALY outcomes and reduced the ICER, regardless of method. Application of QLQ-C30-based utilities yielded lower ICERs (e.g. $154,450 for time-to-death approach) than implementation of the EQ-5D utilities.
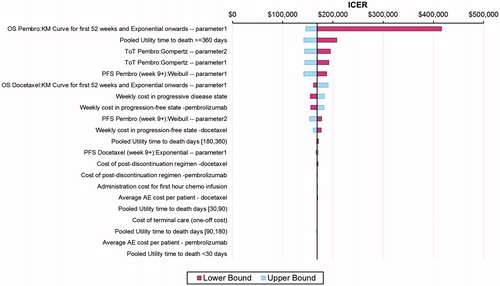
The tornado diagram depicted in shows the impact of parameter variation on the ICER as derived from the deterministic sensitivity analyses. The variables that had the most impact on the ICER were extrapolation of OS, extrapolation of time on treatment for pembrolizumab, and utilities for time greater or equal to 360 days from death. Less impactful on the comparative analyses were post-discontinuation costs, costs for terminal care, infusion costs, and costs for adverse experiences. (Note: parameter 1 and parameter 2 are intercept and log-scale of the parametric functions derived from R statistical software.)
Figure 4. Tornado diagram for one-way sensitivity analyses.
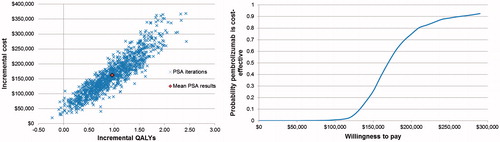
Probabilistic sensitivity analyses show mean expected costs of $142,305,158 and $304,236 for docetaxel and pembrolizumab, respectively. Expected QALYs from the PSA were 0.78 for docetaxel and 1.75 for pembrolizumab. The expected ICER was $167,476, with a 95% credible interval of $114,055/QALY to $424,787/QALY.
Results of the Monte Carlo simulations for incremental cost per QALY gained are presented in . The plot shows incremental cost vs incremental QALYs for each of the 1,000 iterations of the PSA. The cost-effectiveness acceptability curve presented in the same figure shows median ICER from the PSA to be $168K, with a 75% probability that the ICER will be below $200,000/QALY.
Figure 5. Probabilistic sensitivity analysis scatter plot and cost-effectiveness acceptability curve for base case.
Discussion
The present study estimated the cost-effectiveness of pembrolizumab in comparison to docetaxel in PD-L1-positive advanced NSCLC progressing after a platinum-containing chemotherapy in the US. PD-L1 biomarker identified (TPS ≥50%) patients with advanced NSCLC who were treated with pembrolizumab were predicted to have 1.18 years longer overall survival and a 7.86-month longer progression-free survival than those treated with docetaxel. Compared to docetaxel, treatment with pembrolizumab was associated with an incremental cost per QALY of $168,619 and incremental cost per LYG of $135,552. The key drivers of the cost-effectiveness of pembrolizumab are the projection of overall survival and the treatment duration on pembrolizumab, as well as the disease management cost in the US.
There has been no general agreement on a single cost-effectiveness ratio threshold for the US. Braithwaite et al.Citation34, in 2008, cite multiple decision rules including the commonly cited $50,000 per QALY gained and the WHO criteria of 3-times the gross domestic product per capita per disability-adjusted life-yearCitation35. They noted that the oft-cited decision rule of $50,000/QALY gained was inconsistent with US resource allocation. Their analyses suggested (in 2003 US$) a range for the willingness-to-pay threshold in the US of $95,000–$264,000 per LY gained and $109,000–$297,000 per QALY gained. Adjusted to 2016 costs, these ranges become $122,360–$340,000 and $140,392–$382,536 for LYs gained and QALYs gained, respectively. An estimate of 2016 gross domestic product per capita for the US, adjusted to current prices (accessed July 5, 2016) was $57,220Citation36, with 3-times this figure being $171,660. More recently, in 2014, Neumann et al.Citation37 examined the referenced and recommended cost-utility thresholds for the US, with their research concluding that a threshold of $50,000/QALY gained is too low. They recommend that analyses allow for examination of multiple thresholds up to $200,000/QALY gained. Results from our analyses show that pembrolizumab falls into these ranges of acceptable CE (cost/LY gained) and CU (cost/QALY gained) thresholds.
The recent demonstration by Goeree et al.Citation38 that the partitioned survival model and the Markov model yield similar ICER estimates in advanced NSCLC confirmed the structural validity of the partitioned survival model and provided robust evidence against the plausibility of an inherent bias in partitioned survival models recently raised using hypothetical models. The partitioned survival model is considered a valid approach in the current analysis.
Sensitivity analyses illustrated the importance of the projected long-term outcomes associated with pembrolizumab. The extrapolations of PFS and OS beyond the trial were carried out in line with the NICE Decision Support Unit (DSU) guidelinesCitation18. Verification of the suitability of the proportional hazard assumption was performed to understand whether independent survival models were to be explored in each treatment arm. The long-term OS extrapolation was validated using SEER survival data in advanced stage IIIB and IV NSCLC patients. The clinical plausibility of the projected long-term outcomes was also verified by independent clinical experts. Additional real world data will help validate the model in the long-term.
This work includes comprehensive sensitivity analyses that were both deterministic and probabilistic. In general, sensitivity analyses showed the results to be robust across plausible ranges of inputs, including costs, discount rates, time horizons, utility weights, and modelling approaches.
The major strength of the base-case analysis is its reliance on a direct comparison of pembrolizumab vs docetaxel from KEYNOTE 010. The per-protocol certainty of pembrolizumab treatment duration (i.e. maximum of 2 years) represents an additional strength, for there is more uncertainty around treatment duration in the scenario of treating until disease progression.
The implementation of the time-to-death utilities in this economic analysis also represents an important contribution to the modelling of NSCLC. In KEYNOTE 010, post-progression utility data were only collected at a single visit occurring 30-days post-progression. Use of such utilities carried forward in a state-based utility approach does not fully ensure the decline of patient quality-of-life near the end of life. However, analyses utilizing the relatively new time-to-death utility approach enabled more extensive use of the observed clinical trial data from KEYNOTE 010 and the modeling of a fuller patient experience on the basis of observed empirical data. Other methodological choices regarding utility measurement may be considered conservative. The EQ-5D was explicitly included in KEYNOTE 010 to enable the calculation of QALYs for the economic analysis and, thus, represents the base-case. The QLQ-C30 algorithm-based utilities serve as a useful alternative source for determination of QALY data.
Disease management costs used in the analysis are reflective of US clinical practice in advanced NSCLC. Nearly half (45%) of total expected cost differences between pembrolizumab and docetaxel are due to the incremental disease management costs. Further analyses that exclude drug treatment costs showed that the additional disease management costs associated with extended progression-free and overall survival exceed $50,000 per LY gained ($61,752).
Several caveats should also be noted with respect to the present analysis. Major clinical data were based on an RCT with specific inclusion and exclusion criteria and may not reflect real life clinical practice in the US. Additionally, the clinical trial was done in mostly urban, large, academic centers (including ex-US), where practices are likely different from general oncology practices in the US. Due to a lack of data, consequences of follow-up therapy after pembrolizumab and docetaxel were not modeled in detail. Finally, base case results are sensitive to long-term survival projections, and results could differ with the availability of long-term data.
Conclusion
Pembrolizumab has been shown to significantly improve overall survival and progression-free survival for patients with previously treated advanced NSCLC with PD-L1 positive (TPS ≥50%). The results of this study suggest that pembrolizumab improves quality-adjusted expectancy and can be considered to be a cost-effective option compared to docetaxel in these biomarker-identified advanced NSCLC patients in the US.
Transparency
Declaration of funding
This study and manuscript were funded by Merck & Co. Inc.
Declaration of financial/other relationships
MH, JP, TB, FXL, and RX are employees of Merck & Co. Inc., the sponsor of this study and manuscript. VV provides advisory and consultancy services to Merck, BMS, and Genentech. YL provides advisory and consultancy services to Merck and BMS. JME peer reviewers on this manuscript have no relevant financial or other relationships to disclose.
Acknowledgments
The authors would like to thank Jane Liao for her dedicated work on data analyses and Ralph Insinga for his thoughtful review of this manuscript.
References
- NIH National Cancer Institute. SEER Cancer Statistics Factsheets: lung and bronchus cancer. http://seer.cancer.gov/statfacts/html/lungb.html. Accessed July 13, 2016
- Howlader N, Noone AM, Krapcho M, et al, Surveillance, Epidemiology, and End Results (SEER) Program. SEER Cancer Statistics Review, 1975-2012 (updated August 20, 2015). National Cancer Institute, Bethesda, MD, based on November 2014 SEER data submission, posted to the SEER web site, April 2015. Available at: http://seer.cancer.gov/csr/1975_2012/. Accessed July 13, 2016
- Pisters KM, Le Chevalier T. Adjuvant chemotherapy in completely resected non-small-cell lung cancer. J Clin Oncol 2005;23:3270-8
- National Comprehensive Cancer Network. NCCN guidelines: non-small cell lung cancer version 4.2016. US, 2016. Available at: http://www.jnccn.org/content/suppl/2016/03/08/14.3.255.DC1/255.pdf. Accessd July 13, 2016
- McKay C, Burke T, Cao X, et al. Treatment patterns for advanced non-small-cell lung cancer after platinum-containing therapy in U.S. Community Oncology Clinical Practice. Clin Lung Cancer Forthcoming 2016
- Scagliotti G, Hanna N, Fossella F et al. The differential efficacy of pemetrexed according to NSCLC histology: a review of two Phase III studies. Oncologist 2009;14:253-63
- Fossella FV, DeVore R, Kerr RN et al. Randomized phase III trial of docetaxel versus vinorelbine or ifosfamide in patients with advanced non-small-cell lung cancer previously treated with platinum-containing chemotherapy regimens. The TAX 320 Non-Small Cell Lung Cancer Study Group. J Clin Oncol 2000;18:2354-62
- Shepherd FA, Dancey J, Ramlau R et al. Prospective randomized trial of docetaxel versus best supportive care in patients with non-small-cell lung cancer previously treated with platinum-based chemotherapy. J Clin Oncol 2000;18:2095-103
- Dong H, Strome SE, Salomao DR et al. Tumor-associated B7-H1 promotes T-cell apoptosis: a potential mechanism of immune evasion. Nat Med 2002;8:793-800
- Iwai Y, Ishida M, Tanaka Y, et al. Involvement of PD-L1 on tumor cells in the escape from host immune system and tumor immunotherapy by PD-L1 blockade. Proc Natl Acad Sci USA 2002;99:12293-7
- Garon EB, Rizvi NA, Hui R et al. Pembrolizumab for the treatment of non-small-cell lung cancer. N Engl J Med 2015;372:2018-28
- Herbst RS, Baas P, Kim DW et al. Pembrolizumab versus docetaxel for previously treated, PD-L1-positive, advanced non-small-cell lung cancer (KEYNOTE 010): a randomised controlled trial. Lancet 2016; 3871540-50
- Eisenhauer EA, Therasse P, Bogaerts J, et al. New response evaluation criteria in solid tumours: revised RECIST guideline (version 1.1). Eur J Cancer 2009;45:228-47
- National Institute for Health and Clinical Excellence (NICE). NICE guide to methods of technology appraisal, UK, 2013. Available at http://www.nice.org.uk/article/pmg9/chapter/foreword. Accessed July 13, 2016
- Canadian Agency for Drugs and Technologies in Health. Guidelines for the economic evaluation of healthtechnologies: Canada, 3rd edn. Ottawa: Canadian Agency for Drugs and Technologies in Health, 2006
- Hui R, Gandhi L, Carcereny Costa E, et al. [Abstract] Long-term OS for patients with advanced NSCLC enrolled in the KEYNOTE-001 study of pembrolizumab (pembro). J Clin Oncol 2016;34(Suppl):abstr 9026
- Weinstein MC, Siegel JE, Gold MR, et al. Recommendations of the panel on cost-effectiveness in health and medicine. JAMA 1996;276:1253-8
- Latimer N. NICE DSU Technical Support Document 14: survival analysis for economic evaluations alongside clinical trials - Extrapolation with patient-level data. Sheffield: Report by the Decision Support Unit, 2011. http://docplayer.net/11340696-Nice-dsu-technical-support-document-14-survival-analysis-for-economic-evaluations-alongside-clinical-trials-extrapolation-with-patient-level-data.html. Accessed July 13, 2016
- National Institute for Health and Care Excellence. Single Technology Appraisal: evidence review group report. Nintedanib for previously treated locally advanced or metastatic non-small cell lung cancer. NICE, UK, 2014. Available at: https://www.nice.org.uk/guidance/indevelopment/gid-tag449. Accessed July 13, 2016
- National Institute for Health and Care Excellence. NICE Single Technology Appraisal. Nivolumab for previously treated locally advanced or metastatic squamous non-small-cell lung cancer. NICE, UK, 2015. https://www.nice.org.uk/guidance/indevelopment/gid-tag506/documents. Accessed July 13, 2016
- NIH National Cancer Institute. SEER Data, 1973-2013, US, 2015. http://seer.cancer.gov/data/. Accessed July 13, 2016
- Nafees B, Stafford M, Gavriel S, et al. Health state utilities for non small cell lung cancer. Health Qual Life Outcomes 2008;6:84.
- Hatswell AJ, Pennington B, Pericleous L, et al. Patient-reported utilities in advanced or metastatic melanoma, including analysis of utilities by time to death. Health Qual Life Outcomes 2014;12:140
- Shaw JW, Johnson JA, Coons SJ. US valuation of the EQ-5D health states: development and testing of the D1 valuation model. Med Care 2005;43:203-20
- Dolan P. Modeling valuations for EuroQol health states. MedCare 1997;35:1095-108
- Greiner W, Weijnen T, Nieuwenhuizen M, et al. A single European currency for EQ-5D health states. Results from a six-country study. Euro J Health Econ 2003;4:222-31
- Bureau of Labor Statistics. Consumer Price Index, US, 2016. Available at http://www.bls.gov/cpi/. Accessed July 13, 2016
- Flatiron database. Flatiron Health, US, 2015. http://www.flatiron.com/life-sciences. Accessed May 12, 2015
- Centers for Medicare & Medicaid Services, (CMS), US, FY2016.. https://www.cms.gov/apps/ama/license.asp?file/Medicare/Medicare-Fee-for-Service-Part-BDrugs/McrPartBDrugAvgSalesPrice/downloads/2016-July-ASPPricing-File.zip. Accessed July 13, 2016
- Ramsey S, Henk HJ, Smith GL, et al. First-, second-and third-line lung cancer treatment patterns and associated costs in a US healthcare claims database. Lung Cancer Manage 2015;4:131-43
- AnalySource. Suite of drug pricing services, US, 2016. http://www.Analysource.com. Accessed July 13, 2016
- Chastek B, Harley C, Kallich J, et al. health care costs for patients with cancer at the end of life. J Oncol Pract 2012;8:75s-80s
- Kim SH, Jo MW, Kim HJ, et al. Mapping EORTC QLQ-C30 onto EQ-5D for the assessment of cancer patients. Health Qual Life Outcomes 2012;10:151
- Braithwaite RS, Meltzer DO, King JT, et al. What does the value of modern medicine say about the $50,000 per quality-adjusted life-year decision rule? Med Care 2008;46:349-56
- Murray CJ, Evans DB, Acharya A, et al. Development of WHO guidelines on generalized cost-effectiveness analysis. Health Econ 2000;9:235–51
- KNOEMA. IMF World Economic Outlook (WEO), US, 2016. https://knoema.com/pjeqzh/gdp-per-capita-by-country-1980-2014. Accessed July 13, 2016.
- Neumann PJ, Cohen JT, Weinstein MC. Updating cost-effectiveness - The curious resilience of the $50,000-per-QALY threshold. New Engl J Med 2014;371:796-7
- Goeree R, Villeneuve J, Goeree J, et al. Economic evaluation of nivolumab for the treatment of second-line advanced squamous NSCLC in Canada: a comparison of modelling approaches to estimate and extrapolate survival outcomes. J Med Econ 2016;19:630-44