
Abstract
Objective: The purpose of this study was to determine the cost effectiveness (from a payer’s perspective) of adding clostridial collagenase ointment (CCO) to selective debridement compared with selective debridement alone (non-CCO) in the treatment of stage IV pressure ulcers among patients identified from the US Wound Registry.
Methods: A 3-state Markov model was developed to determine costs and outcomes between the CCO and non-CCO groups over a 2-year time horizon. Outcome data were derived from a retrospective clinical study and included the proportion of pressure ulcers that were closed (epithelialized) over 2 years and the time to wound closure. Transition probabilities for the Markov states were estimated from the clinical study. In the Markov model, the clinical outcome is presented as ulcer-free weeks, which represents the time the wound is in the epithelialized state. Costs for each 4-week cycle were based on frequencies of clinic visits, debridement, and CCO application rates from the clinical study. The final model outputs were cumulative costs (in US dollars), clinical outcome (ulcer-free weeks), and incremental cost-effectiveness ratio (ICER) at 2 years.
Results: Compared with the non-CCO group, the CCO group incurred lower costs ($11,151 vs $17,596) and greater benefits (33.9 vs 16.8 ulcer-free weeks), resulting in an economically dominant ICER of −$375 per ulcer. Thus, for each additional ulcer-free week that can be gained, there is a concurrent cost savings of $375 if CCO treatment is selected. Over a 2-year period, an additional 17.2 ulcer-free weeks can be gained with concurrent cost savings of $6,445 for each patient.
Conclusions: In this Markov model based on real-world data from the US Wound Registry, the addition of CCO to selective debridement in the treatment of pressure ulcers was economically dominant over selective debridement alone, resulting in greater benefit to the patient at lower cost.
Introduction
A pressure ulcer is an injury to the skin and underlying tissue, often over a bony prominence, as a result of prolonged periods of uninterrupted pressureCitation1. Estimates of the incidence of pressure sores vary depending on the population evaluated (hospitalized patients, nursing home residents, and long-term care residents). For example, it has been reported that 4.5% of Medicare patients developed at least one new pressure ulcer during their hospitalizationCitation2, and 31.6% of elderly patients with hip fractures developed pressure ulcers during their initial acute hospital stayCitation3. With regard to nursing home facilities, data from the National Nursing Home SurveyCitation4 conducted in 2004 showed that 11% of nursing home residents developed pressure ulcers, whereas 19% of residents in long-term care facilities developed a pressure ulcer, while participating in the National Pressure Ulcer Long-Term Care StudyCitation5. Finally, in combined care settings, which included acute care, long-term care, and rehabilitation facilities, data from the International Pressure Ulcer Prevalence Survey™ showed that prevalence rates were 13.5% in 2008 and 12.3% in 2009Citation6.
In 2006, adult hospital stays for pressure ulcers totaled $11 billionCitation7. A retrospective chart analysis of patients with stage IV pressure ulcers revealed that the average hospital treatment costs associated with stage IV pressure ulcers and related complications were $129,248 for hospital-acquired ulcers during one hospital stay and $124,327 for community-acquired ulcersCitation8. These findings highlight the substantial economic burden associated with the management and care of pressure ulcers.
Debridement, the process of removing dead and/or infected tissue from the wound bed, is an essential step in the treatment of pressure ulcers because it promotes proliferation of healthy tissue and decreases the risk of infectionsCitation1,Citation9. Debridement methods include mechanical, autolytic, selective, and enzymatic techniquesCitation1,Citation9. Mechanical debridement uses force or physical energy to remove necrotic tissue and is relatively non-selective; autolytic debridement is accomplished by applying moist interactive dressings and may take from days to several weeks to be effectiveCitation10; selective debridement includes sharp debridement using scissors, scalpels, or curettes, and must be performed by a qualified professional and may result in the removal of healthy tissue; and enzymatic debridement is a selective method in that it removes necrotic tissue while sparing healthy tissueCitation9,Citation11.
Although selection of a debridement method is based on the status and size of the wound, the patient’s clinical characteristics, and the expertise of the healthcare provider, there is evidence that enzymatic debridement of pressure ulcers using clostridial collagenase ointment (CCO, Santyl ointment; Smith & Nephew Inc., Fort Worth, TX) was more effective than autolytic debridement in a study of 27 nursing home residentsCitation12,Citation13. There is also evidence that enzymatic debridement is more cost-effective than the autolytic method in the treatment of pressure ulcersCitation14. In addition, increased epithelialization rates were reported in a recent study of the clinical effectiveness of CCO as an adjunct to selective debridement for an outpatient population of patients with stage IV pressure ulcersCitation15. As the clinical effectiveness of CCO in the treatment of pressure ulcers has been established, there is a need to determine the cost effectiveness of this therapy using real-world data. The purpose of this study was to determine the cost effectiveness (from a payer’s perspective) of adding CCO to selective debridement in the treatment of stage IV pressure ulcers among patients identified from the US Wound Registry (USWR).
Patients and methods
Study participants, design, and interventions
The clinical data used in this economic analysis were derived from a previously published studyCitation15 assessing the clinical effectiveness of adding CCO to selective debridement (non-CCO) in the treatment of stage IV pressure ulcers in a hospital outpatient department (HOPD) setting. Outcome data were obtained from patient electronic health records that are part of the USWR national database. The USWR is a non-profit organization recognized by the Centers for Medicare and Medicaid Services as part of the Physician Quality Reporting SystemCitation16. The USWR provides data on outcomes and resource utilization among patients with chronic, hard-to-heal wounds, such as diabetic foot ulcers, venous stasis ulcers, arterial ulcers, and pressure ulcers at more than 100 HOPDs in the US and Puerto Rico. Data contained in the USWR database are compliant with the Health Insurance Portability and Accountability Act (HIPAA). The Woodlands institutional review board (IRB; The Woodlands, TX) has determined that retrospective analysis of HIPAA-compliant data as described in this study is exempt from the requirement for patient consent.
In the clinical study performed by Carter et al.Citation15, a total of 9,203 patients with 20,358 wounds and 149,680 visits for pressure ulcers were identified during the 6-year period from January 2007 to January 2013. Patients were selected for analysis if they had more than one visit for pressure ulcer treatment, resulting in 20,339 wounds. Wounds treated with CCO were then identified using the word “Santyl®” from the wound filler (16,745 wounds in the non-CCO group; 3,594 in the CCO group). All patients who received selective debridement were identified using current procedural terminology (CPT) codes 97578 and 97579, resulting in 4,578 wounds (3,486 non-CCO; 1,093 CCO). Fifty-four patients who were <18 years of age were excluded, resulting in 4,524 wounds for analysis. Propensity scores were calculated for each pressure ulcer using logistic regression based on treatment group as the dependent variable (CCO = 1; non-CCO = 0). Covariates included in the logistic regression model included patient age, wound age, initial area, arrival score, number of concurrent wounds, infection surrogate score, stage of pressure ulcer, presence of end-stage renal disease, history of paralysis, or being underweightCitation5. Propensity score matchingCitation17,Citation18 was performed to adjust for selection bias using the nearest neighbor algorithm without replacement and a target caliper of 0.002. Propensity score matching reduced the number of wounds available for analysis from 4,524 wounds to 2,148 wounds (1,074 wounds per treatment group). Finally, patients with stage IV pressure ulcers were identified from the matched groups, which included 202 patients (337 wounds) in the CCO group and 232 patients (336 wounds) in the non-CCO group.
No statistically significant differences in baseline demographics between the CCO and non-CCO groups were seen (average age was 66.0 years for CCO and 63.6 years for non-CCO, ∼50% of each group was male, 63% of each group was white, and 64% of each group was ambulatory). With regards to wound characteristics of the treatment groups, stage IV pressure ulcers were significantly deeper in the non-CCO group compared with the CCO group (61.7% vs 45.9% of wounds with depth ≥0.3 cm, p < .0001), tended to have more exudate in the “heavy” category (18.5% vs 9.5%, p < .0001), and varied with regard to location of the pressure ulcer, with a significantly lower percentage in the heels (12.5% vs 22.0%, p = .012).
Clinical outcomes
Carter et al.Citation15 assessed the clinical effectiveness of CCO as an adjunct to selective debridement compared with selective debridement alone. The clinical outcomes evaluated included the proportion of stage IV pressure ulcers that were closed (epithelialized) over a 2-year period and the time to wound closure. Carter et al.Citation15 showed that the proportion of wounds closed at 1 year (22.2% [75/337] vs 11.0% [37/336], p < .0001) and at 2 years (26.7% [90/337] vs 13.7% [46/336], p < .0001) was 2-times greater in stage IV pressure ulcers treated with CCO compared with those not treated with CCO. The time to wound closure at 2 years was significantly faster in the CCO group compared with the non-CCO group (465 days [95% confidence interval [CI] = 415.9–496.0] vs 589 days [95% CI = 553.4–624.5], p < .0001). In the present study, this clinical benefit is presented as ulcer-free weeks. In the Markov model, ulcer-free weeks represent the time the pressure ulcers are in the closed or epithelialized state.
Economic analysis
Markov models represent a class of stochastic models that describe a sequence of possible events in which the probability of each event depends only on the state attained in the previous event. They are often used to assess decision-making in clinical situations where events and costs change over timeCitation19. In this study, a Markov simulation model was designed to evaluate the cost effectiveness of CCO in stage IV pressure ulcers using results obtained from the USWR outpatient studyCitation15 over a horizon time of 2 years. The initial epithelialization and mortality rates are provided in . The Markov health states included non-epithelialized, epithelialized, and death, and evaluated two comparative pathways: CCO added to selective debridement vs selective debridement alone. Four-week cycles were used to examine the costs and outcomes associated with the three Markov health states. The non-epithelialized state was equated to having a pressure ulcer and the epithelialized state was equated to having a pressure ulcer in which regeneration of the epidermis across the wound surface occurred. Clinical outcome and costs were calculated for each cycle with half-cycle corrections. The final model outputs were cumulative costs (in US dollars), clinical outcome (ulcer-free weeks), and the incremental cost-effectiveness ratio (ICER; cost/ulcer-free week) at 2 years.
Table 1. Initial epithelialization and mortality probabilities.
Model inputs
Time horizon and perspective
A time horizon of 2 years was chosen as a compromise between a timeframe that was too short in which epithelialization of few pressure ulcers would occur and a longer timeframe in which a high percentage of patients would die or experience other complications that could create large uncertainties in the model. The perspective of the study was the third party payer.
Health state transition probabilities
Epithelialization rates
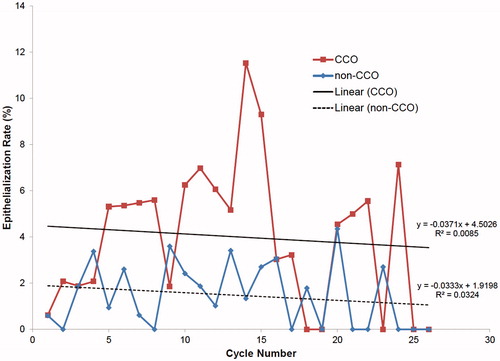
Epithelialization rates were modeled based on wound closure rates from the outpatient study using linear regression equations and the extrapolated percentage of patients with epithelialized pressure ulcers in each cycle after accounting for those lost to follow-up. Because the data used were heavily right censored, a Kaplan-Meier analysis was used to create an actuarial table for each group based on dividing the 2-year data into equal increments of 28 days to reflect the cycle length in the economic analysis. The epithelialization rate of censored wounds was based on the rate of epithelialization of non-censored wounds in the interval. This approach assumes that no individuals die during each cycle and would be an over-estimate; therefore, death rates were applied at each cycle to compensate for the over-estimate. Plots of epithelialization rates (which included death and loss to follow-up) of stage IV pressure ulcer for the CCO and non-CCO groups are provided in . As the Markov model was built from real-world data, actual cycle values were used instead of imputing mean values over longer time intervals.
Figure 1. Epithelialization rates of stage IV pressure ulcers for clostridial collagenase ointment (CCO) added to selective debridement and selective debridement alone (non-CCO) in 4-week cycles.
Death
Mortality rates were modeled using age structure in 5-year increments for each treatment group and adjusted using national census dataCitation20. The percentage of patients in each age interval was calculated. To obtain a mean age-adjusted annual mortality rate for each treatment group, the following calculation was made:
where F is the percentage of patients in the ith age group and Pi is the probability of death in moving from the ith age group to the ith +1 age group, F1 is associated with the age group 20-24 years, and Fn is associated with the age group ≥95 years. The values were divided by 13 to obtain a 4-week mortality rate. Even though the difference in mean ages for the CCO and non-CCO groups was not statistically significant (66.0 years and 63.6 years, respectively), they were sufficiently different that different mortality rates were used in the model. Mean 4-week mortality rates were 0.0126 and 0.0103 for the CCO and non-CCO groups, respectively.
Location of pressure ulcer
Treatment approaches for pressure ulcers are dependent on the size, depth, and location of the wound and can range from very conservative management to promote epithelialization to surgical management to close the woundCitation21–23. Because some of the deeper and more severe wounds require surgical intervention, the location of the pressure ulcer affects offloading costs and surgical closure costs. The locations of pressure ulcers included the sacrum/back, buttocks (ischium), hip/thigh (trochanter), heel/ankle, foot (no heel/ankle), and other. Final cost calculations were weighted according to the percentages of pressure ulcer locations in each treatment group, as shown in . Besides the treatment group, only pressure ulcer location was a significant factor in the final Cox regression model (time to heal = 2 years)Citation15; consequently, no other factors that might be expected to affect healing rates, such as depth or wound exudate level, were considered.
Table 2. Classification of pressure ulcer location to cost unit categories.
Unit costs
Unit costs included outpatient visits at HOPDs, dressing changes, debridement (selective debridement at various levels and the cost of CCO application), and offloading. Outpatient clinic visits, debridement, dressing changes, and offloading occurred only during the non-epithelialized state. The basis for non-epithelialized unit cost calculations is provided in . All costs were based on the first half of 2015 Medicare national average reimbursement ratesCitation16, with the exception of pillow and body wedges, which were based on the lowest commercial cost. Offloading modes for different pressure ulcer locations were based on National Pressure Ulcer Advisory Panel, European Pressure Ulcer Advisory Panel, and Pan Pacific Pressure Injury Alliance clinical practice guidelinesCitation1 and refined practically by discussion with pressure ulcer care practitioner/consultants.
Table 3. Unit costs (US dollars).
Outpatient clinic visits
The evaluation and management code used in the initial visit was set to a mid-level of complexity, even though the complexity is often a level 4 or 5. This was done because many patients have multiple pressure ulcers or other chronic wounds, and assigning all costs in these cases to a higher complexity level would likely result in an over-estimate of the charges for a single pressure ulcer case.
The visit frequency for CCO-treated wounds was slightly lower and statistically significant (2.8 vs 3.2, respectively, p = .038, Student t-test) compared with non-CCO-treated wounds; selective debridement frequency was also lower and statistically significant (0.74 vs 1.0, respectively, p = .007, Student t-test) compared with the non-CCO group. Because CCO application distributions cannot be easily handled in a stochastic model, the mean CCO application frequency was based on the data from the clinical study and was defined as follows: CCO frequency/patient visit frequency where the CCO frequency was the number of CCO applications/period of time in which the CCO was administered; the mean CCO application frequency was subsequently adjusted to a per time unit of 4 weeks. The derived mean CCO application rate was 1.65.
Cycle costs
All costs for each cycle are based on summing the total costs for each pressure ulcer location using the weighting factor. The first cycle incorporates the initial visit costs and subsequent visit costs. Initial visit costs comprise costs arising from the initial office visit and offloading costs (). For example, for sacral pressure ulcers in the non-CCO group, the cost calculation was: $0.286 × (a + b + c + d) + (0.053 × j) + k + n), where 0.286 is the proportion of pressure ulcers located on the sacrum in this group (the weighting factor) (see ), the letters (e.g. a and b) are unit costs shown in (second column) with the cost for k adjusted for 4 weeks rather than 1 month, and 0.053 is the proportion of subjects who are wheelchair bound and have this location of pressure ulcer.
The balance of the first cycle costs depends on the group assignment. For example, for the CCO-treated group, the number of visits remaining is 2.8 − 1 = 1.8. There are three possible combinations for treatment costs (these are mutually exclusive): (a) selective debridement (no CCO application), (b) CCO application, and (c) established office visit with no debridement or CCO application. The coefficients for these costs for this group must sum to 1.8 and are based on the selective debridement rate per 4 weeks, the CCO application rate (minus the first application at the initial visit). The coefficient for (c) was obtained by adding the coefficients for (a) and (b) and subtracting from 1.8. The calculated coefficients were 0.74, 0.65, and 0.41 for (a), (b), and (c), respectively. For non-CCO-treated pressure ulcers, the coefficient of (b) was always 0, because no CCO is ever applied.
For subsequent cycles, calculations for the CCO group used the same methodology to calculate coefficients of (a), (b), and (c), taking into account that the total number of visits per cycle was 2.8. For the non-CCO group, the calculated coefficients for (a) and (c) were 1.0 and 2.2, respectively. There were some periodic offloading costs that were included, which depended on wound location. For example, every cycle included rental costs for group 2 low-air-loss mattresses used for pressure ulcers located on the sacrum/back, buttocks/ischium, and hips/upper thighs, and both heel protectors and Heelift traction boots were periodically replaced (see ). The final costs for each cycle were summed by location of wound, and are shown by cycle and intervention group for unhealed wounds in .
Table 4. Four-week cycle costsTable Footnotea (US dollars) for each intervention.
Surgical costs
The percentage of stage IV pressure ulcers that have to be surgically closed in a given population depends on many factors, such as frailty, patient age, ability to tolerate surgery, and lack of epithelialization. In one community study in the UKCitation25, ∼30% of stage IV pressure ulcers were surgically closed, and this percentage was adopted in the Markov model to analyze surgical costs as part of the sensitivity analysis. Epithelialization after surgical closure typically occurred over a 4–8-week periodCitation22,Citation25, of which a small proportion was spent in the hospital and in some instances in an acute skilled nursing facility. The mean cost of hospitalization principally for a pressure ulcer in 2006 was $16,800, with a mean stay of 14.1 daysCitation7. The costs associated with surgical closureCitation16 for pressure ulcers are shown in , demonstrating that the majority of the cost was associated with the inpatient stay.
Table 5. Unit costs (US dollars) associated with surgical wound closure.
Ulcer recurrence
In this study, patients were assigned to one of two groups: those who required surgery to close the pressure ulcer and those who achieved epithelialization without surgical intervention. Two studies in the published literature have reported on ulcer recurrence rates among patients who need surgery to close the pressure ulcer and those who do not need surgery. The first study was a systematic reviewCitation26 of the common types of flap surgery used to close pressure ulcers; this study provided sufficient data to calculate a recurrence rate for surgically treated pressure ulcers corrected for follow-times of 4.7% over 2 years. The second report was a community studyCitation25 that indicated the annual recurrence for non-surgically treated stage IV pressure ulcers was ∼4%. Data from the systematic review and the community study suggest that the recurrence rate is not likely to significantly impact any findings; therefore, ulcer recurrence was not included in the model.
Sensitivity analysis
Eight variables were assessed in the sensitivity analysis (). These variables included the distribution of pressure ulcers, differences in epithelialization rates, CCO application rates, levels of selective debridement, variations in costs of visits, offloading variations, need for surgical closures, and various reimbursement rates to accommodate commercial vs public insurance.
Table 6. Variables used in sensitivity analysis.
Because the location of the pressure ulcer can influence the treatment, we assessed the impact of standardizing the location of the pressure ulcer. In the sensitivity analysis, the pressure ulcer location proportions were changed to a scenario in which proportions were equal by group and more reflective of commonly cited percentages of pressure ulcers by locationCitation22. Using the proportions specified in (variable 1), non-CCO epithelialization rates were set to 75% of the CCO epithelialization rates at each cycle, as the baseline and values of 0.65 and 0.85 were used to approximate the uncertainty. In the base case, subcutaneous debridement was chosen as part of first-visit costs. In the sensitivity analysis, costs associated with muscle or bone debridement were assessed along with a more complex initial visit (level 5) for the initial visit clinic costs. More expensive but not necessarily more effective options were chosen to explore offloading costs. An increase of 50% was chosen because there is no easy way to ascertain these costs. Surgical costs were also assessed by including them when epithelialization of a pressure ulcer occurred.
A probabilistic sensitivity analysis was performed to evaluate parameter uncertainty by using a second-order Monte-Carlo simulation of 10,000 trials in which the following model inputs were varied simultaneously: same proportions of pressure ulcer locations, epithelialization rates of non-CCO group set to 0.75 at every cycle of CCO epithelialization rates, and cost of surgical closure when epithelialization of the pressure ulcer occurs set to 0.3 of total surgical cost (variables 1 and 7, ). Using this method, a dummy dataset was created by re-sampling with replacement (i.e. randomly selecting one patient at a time) from the original dataset. This random patient selection was repeated until the dummy dataset reached the same size as the original. The ICER was then re-calculated from the dummy dataset and the entire process was repeated multiple (e.g. 10,000) times. For probabilities, beta distributions were applied with parameters calculated from mean values for each cycle and a standard deviation of 50% of the mean value. Likewise, gamma distributions were created and applied for assessing variances in costs at each cycle.
Model validation
We used the most current data from the literature as model inputsCitation1,Citation7,Citation15,Citation22,Citation25,Citation26 and consulted with several experts on pressure ulcer care. Because the target population was outpatient-based rather than acute or long-term care, we used real-world data as this population is likely to be significantly different from acute or long-term care populations. Where there were uncertainties, we developed variables that could be examined in sensitivity analyses.
The Markov model was calibrated in stages using a dependent validity method to ensure that final results were within prescribed limits when compared against dataset parameters. Accuracy was checked in stages: first, with costs, epithelialization rates, and mortality rates for each cycle in Excel spreadsheets; second, at the model input stage (tables for the model); and, finally, by cycle in the cumulative model results for the base model and sensitivity analyses in regard to costs and benefits.
Using the epithelialization rates divided by 100 for the CCO group, the best fit was obtained for the following linear equation: Y = 0.0004X + 0.045, where X is the cycle number and Y is the epithelialization rate. The same was done for the non-CCO group for the linear equation Y = 0.0003X + 0.0324. The epithelialization rates obtained () were inputted into the Markov model. The proportion of wounds calculated as closed at 2 years without any censoring was 65.9% and 32.1% for the CCO and non-CCO groups, respectively, using the original calculated 4-week epithelialization rates. The calculated proportions represented the targets; goodness of fit for this stage of the model was defined as reaching the target within 1% after 2 years (26 cycles) at which point first-stage calibration was stopped. Adjustment to reach the targets was achieved by progressively changing the coefficient of X. This calibration was carried out with mortality rates at each cycle set to 0. Final results were 65.4% and 32.0%, for the CCO and non-CCO groups, respectively.
The estimated deceased population, which was carried out independently at 2 years for the CCO and non-CCO groups, was 28.1% and 23.6%, respectively. After setting up a table for each cycle equating to the 4-week rates, cumulative deaths by 2 years were examined in the Markov model while setting epithelialization rates to 0%. Again, these represented the targets; goodness of fit for this stage of the model was defined as reaching the target within 1% after 2 years (26 cycles) at which point second-stage calibration was stopped (stopping rule). In this instance, no further calibration was necessary after initial input.
Results
Base case
Clinical outcomes and wound closure rates
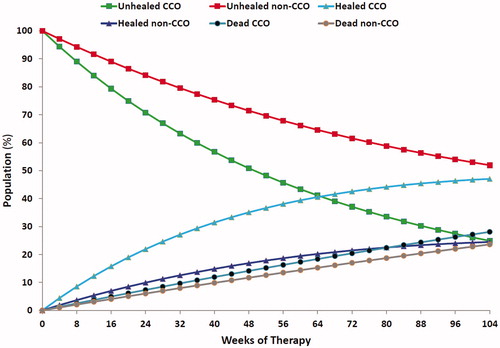
Data in illustrate how the populations associated with the different health states in the Markov model change with respect to time. Most noticeable are the percentages of individuals associated with non-epithelialized wounds at the end of 2 years: 24.9% and 51.9% for the CCO and non-CCO groups, respectively. In contrast, at the end of the same time period, 47.0% and 24.5% of wounds were epithelialized for the CCO and non-CCO groups, respectively. In reality, greater numbers of wounds were epithelialized, but the high mortality rates mean that some individuals with epithelialized wounds died before the end of the 2-year period.
Figure 2. Population metrics for individuals in different health states in clostridial collagenase ointment (CCO) added to selective debridement and selective debridement alone (non-CCO) over the 2-year period.
Cost effectiveness
The findings presented in indicate that, by the end of 2 years, individuals treated with CCO accumulated more than double the benefit in terms of ulcer-free weeks compared with individuals treated with selective debridement alone. Cumulative costs were also substantially higher by the end of the same time period for the non-CCO group compared with the CCO group ().
Figure 3. Epithelialized wound weeks with clostridial collagenase ointment (CCO) added to selective debridement and selective debridement alone (non-CCO) over the 2-year period.
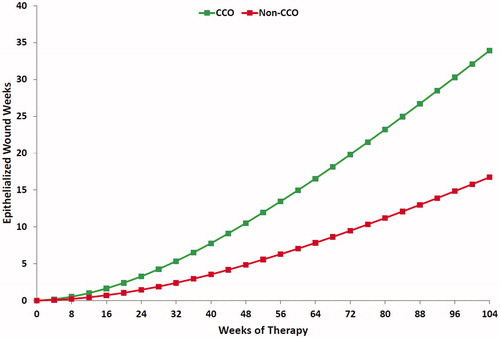
Figure 4. Cumulative costs with clostridial collagenase ointment (CCO) added to selective debridement and selective debridement alone (non-CCO) over the 2-year period.
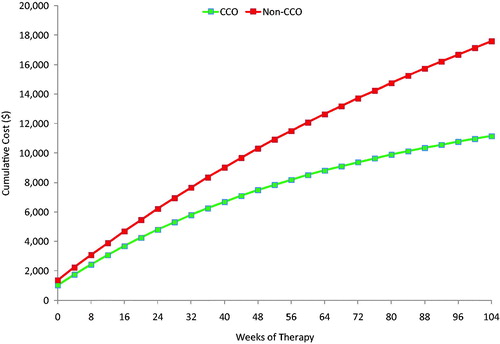
Overall, the results from the Markov model over the specified time horizon show that, relative to the non-CCO group, the CCO group incurred lower costs and higher benefits: $11,151 vs $17,596 and 33.9 vs 16.8 ulcer-free weeks, resulting in an economically dominant ICER of –$375 per ulcer-free week. This indicates that, for each additional ulcer-free week that can be gained, there is a concurrent cost savings of $375 if the additional CCO treatment is selected. Over a 2-year period, an additional 17.2 ulcer-free weeks can be gained with a concurrent cost savings of $6,445 for each patient.
Sensitivity analyses
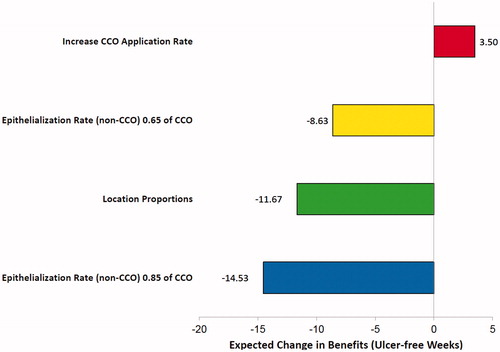
Changes in costs and benefits based on the variables assessed in the 1-way sensitivity analyses are shown graphically in and . These diagrams illustrate changes in results relative to the changes made in model input assumptions, and rank these changes according to their magnitude. In terms of costs, equalizing the proportions with regard to body location of the pressure ulcers increased costs substantially, with a proportional increase or decrease in costs using this as a base case depending on where the epithelialization rate of non-CCO was set. Inclusion of surgical costs also increased costs, although not as much as changing proportions or epithelialization rates. Deeper debridement, higher CCO application rates, or increased initial visit costs made negligible changes. In terms of benefits, increasing the CCO application rate increased benefits slightly, but changing the proportions of body locations for pressure ulcers and/or the epithelialization rate of the non-CCO group decreased benefits enormously.
Figure 5. Influence of parameter uncertainty on the expected cost of clostridial collagenase ointment (CCO) added to selective debridement relative to selective debridement alone (non-CCO).
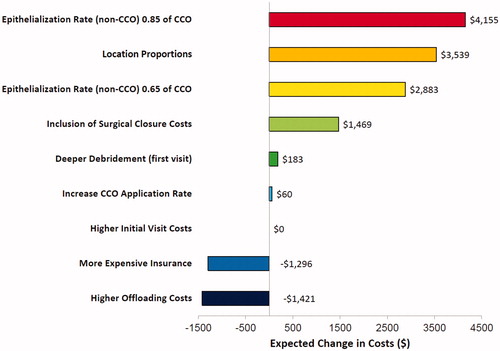
Figure 6. Influence of parameter uncertainty on the expected benefits of clostridial collagenase ointment (CCO) added to selective debridement relative to selective debridement alone (non-CCO).
CCO therapy dominated in all the sensitivity analyses conducted. Using the results obtained in the sensitivity analyses, we determined that the best-case scenario was obtained by increasing the CCO application rate, increasing insurance reimbursement rates, and adding higher offloading costs to the base case. For the best-case scenario, the respective costs were $16,220 and $25,788 for the CCO and non-CCO groups, while the benefits were 37.4 and 16.8 ulcer-free weeks, respectively. This translates to an ICER of –$462 with cost savings of $9,568 and a benefit of 20.7 ulcer-free weeks for CCO added to selective debridement compared with selective debridement alone.
In contrast, the worst-case scenario was obtained when the proportions of pressure ulcer locations were equalized, the epithelialization rate for the non-CCO group was 0.85 × CCO group, surgical costs of closure were included, and deeper levels of debridement were included. For the worst-case scenario, the respective costs were $15,120 and $17,008 for the CCO and non-CCO groups, while the benefits were 33.9 and 31.3 ulcer-free weeks, respectively. This translates to an ICER of –$710, with costs savings of $1,888 and a benefit of 2.7 ulcer-free weeks for CCO added to selective debridement compared with selective debridement alone.
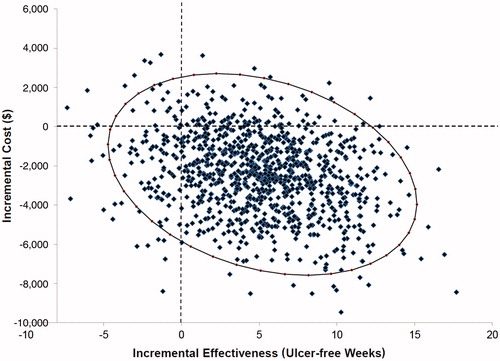
Based on the 95% CIs, the probabilistic sensitivity demonstrated that at least 81% of the time costs were lower with concurrent increased benefits by adding CCO to selective debridement ().
Figure 7. Probabilistic sensitivity analysis. Each point on the plot corresponds to one trial in the Monte Carlo simulation comparing the incremental effectiveness and costs of therapy. The ellipse encompasses 95% confidence intervals.
Discussion
Stage IV pressure ulcers can be difficult-to-treat and slow-to-heal wounds. These wounds are often treated in an HOPD, where the wound can be evaluated and treated by a group of specialists knowledgeable in wound care. At HOPDs, evaluation and management of the wound include documentation of the condition of the wound, such as wound location, wound measurement, tissue type, periwound skin condition, and wound exudate, and development of a treatment plan that addresses any comorbidities that may affect the patient’s ability to heal. Recording this information and making periodic assessments allow staff at the HOPD to track the progress of the wound throughout treatment and make changes to the treatment plan based on these outcomes. Wounds that do not close properly can lead to skin or bone infection or result in hospitalization owing to the need to surgically close the wound. The addition of CCO to selective debridement compared with selective debridement alone has been shown to promote a faster rate of wound closureCitation15, although whether by extension it may reduce the risk of infection or hospitalization among patients with slow-to-heal pressure ulcers remains to be confirmed.
In general, higher-level evidence in regard to the debridement of pressure ulcers is scarce. A randomized controlled trial compared collagenase vs fibrinolysin/deoxyribonuclease in the debridement of pressure ulcers, but the authors reported no significant differences in regard to wound-related parametersCitation27. Other controlled trials have shown significant differences between groups treated with hydrogel dressings vs collagenase ointment in terms of time required to completely remove necrotic tissue from their pressure ulcers as well as time to complete epithelialization, both in favor of CCOCitation12,Citation13. ShermanCitation28 also reported that maggot therapy compared to other kinds of debridement significantly improved reduction of necrotic tissue and wound area, but this was not a controlled trial. In a very large retrospective analysis of over 300,000 wounds, Wilcox et al.Citation29 also demonstrated that faster healing of pressure ulcers was generally correlated with more frequent debridement. Nevertheless, given the high incidence of pressure ulcers, the body of evidence available to guide clinicians in regard to debridement approaches is surprisingly limited, and absent for stage IV pressure ulcers.
In the present study, we assessed the cost effectiveness of adding CCO as an adjunct to selective debridement among an HOPD patient population with stage IV pressure ulcers. At the time of initiating treatment at the HOPD, the average age of these pressure ulcers was ∼1 year, demonstrating the slow-to-heal nature of the wounds being assessedCitation15. Overall, the results of the Markov analysis demonstrated robust findings in favor of adding CCO as an adjunct to selective debridement for stage IV pressure ulcers, even in the worst-case scenario. Increasing the epithelialization rates of the non-CCO group to 0.85 of that of the CCO group and equalizing the proportions of pressure ulcer locations closed the cost savings the most, followed by inclusion of surgical costs. However, when costs were increased across the board to simulate greater insurance reimbursement rates or when offloading costs were increased, the cost savings between the CCO and non-CCO groups increased in favor of the CCO group.
Benefits increased slightly when application rates were marginally increased, but decreased between the two groups when epithelialization rates were increased for the non-CCO group or when the proportions of pressure ulcer locations were equalized. In all cases, adding CCO treatment to selective debridement still dominated, and the probabilistic sensitivity analysis – which included equalization of the proportions of pressure ulcer locations, a higher epithelialization rate for the non-CCO group, and the costs of surgical closure – demonstrated that the vast majority of results produced costs savings and increased benefits in terms of additional ulcer-free weeks.
The primary strength of this study is the use of real-world data to develop and populate the Markov model. Results of real-world data analyses can provide insight into how a therapy is used in clinical practice in a broad patient population more reflective of the general population. Thus, real-world data analyses have an advantage over analyses derived from randomized clinical trial data, which are collected in specific patient populations where adherence to protocol-defined procedures is strictly monitored and unlikely to be influenced by cost or availability issues. Other strengths of this study include a realistic simulation of health states of the chosen population and comprehensive healthcare provider costs, as well as pragmatic variations of model parameters.
There are some limitations to this study that should be noted. First, data inputs to the model were drawn from relatively small samples. Second, epithelialization rates had to necessarily be simplified owing to the high variance in both groups resulting from loss to follow-up and death. Third, the model did not incorporate any ulcer recurrence or severe complications such as amputation, which would be associated with pressure ulcers located on the foot or heel, although these rates would not be expected to be high over the specified time period. Fourth, while other adjunctive therapies such as NPWT were similar between groupsCitation15, we cannot rule out the possibility that the incidence of other therapies might have been different. Finally, mortality rates were modeled on national census statistics adjusted for the age structure of the population, as mortality rates for an outpatient population could not be assessed. While we accounted for differences in the location of the pressure ulcers in both groups in the sensitivity analysis, the generalizability of our study could be problematic to other populations in which the overall location proportions are substantially different. Comparison to other studies may also be difficult because the study population is outpatient-based, rather than long-term care-based (such as a nursing home or skilled long-term care facility) or an inpatient population.
Conclusion
In summary, adding CCO to selective debridement in the treatment of pressure ulcers resulted in an ICER of −$375 per ulcer-free week with 17.2 additional ulcer-free weeks and a cost savings of $6,445 per patient over a 2-year period. Given the cost savings and added benefit of ulcer-free weeks, healthcare providers should consider adding CCO as an adjunct to selective debridement for the treatment and management of pressure ulcers. Although the addition of CCO to selective debridement in the treatment of pressure ulcers may be expected to reduce the risk of hospitalization and infection based on higher healing rates in the HOPD setting, further research will be necessary to confirm these points.
Transparency
Declaration of funding
This study was funded by Smith & Nephew, Inc., Fort Worth, TX.
Declaration of financial/other relationships
MJC is a consultant and was paid by Smith & Nephew for this investigation. AMG is a former employee of Smith & Nephew and has no conflicts of interest to disclose. CRW & KS are employees of Smith & Nephew, Fort Worth, TX, and may own shares of Smith & Nephew. CEF is Executive Director of the Chronic Disease Registry (d/b/a the US Wound Registry), a 501c(3) organization that provided some of the data used in this study. JME peer reviewers on this manuscript have no relevant financial or other relationships to disclose.
Acknowledgments
The authors thank Joann Hettasch, PhD, of Arbor Communications, Inc., a member of the Fishawack Group of Companies, Conshohocken, Pennsylvania, who provided medical writing assistance on behalf of Smith & Nephew.
Related Research Data
References
- Haesler E, editor. National Pressure Ulcer Advisory Panel, European Pressure Ulcer Advisory Panel, and Pan Pacific Pressure Injury Alliance. Prevention and treatment of pressure ulcers: quick reference guide. Perth, Australia: Cambridge Media, 2014
- Lyder CH, Yu C, Stevenson D, et al. Validating the Braden Scale for the prediction of pressure ulcer risk in blacks and Latino/Hispanic elders: a pilot study. Ostomy Wound Manage 1998;44(3A Suppl):42S-9S
- Baumgarten M, Margolis DJ, Orwig DL, et al. Pressure ulcers in elderly hip fracture patients across the continuum of care. J Am Geriatr Soc 2009;57:863-70
- Park-Lee E, Caffrey C. Pressure ulcers among nursing home residents: United States, 2004. NCHS data brief, no 14. Hyattsville, MD: National Center for Health Statistics, 2009
- Horn SD, Fife CE, Smout RJ, et al. Development of a wound healing index for patients with chronic wounds. Wound Repair Regen 2013;21:823-32
- VanGilder C, Amlung S, Harrison P, et al. Results of the 2008–2009 International Pressure Ulcer Prevalence Survey and a 3-year, acute care, unite-specific analysis. Ostomy Wound Manage 2009:55:39-45
- Russo CA, Steiner C, Spector W. Hospitalizations related to pressure ulcers among adults 18 years and older, 2006. HCUP Statistical Brief #64. Rockville, MD: Agency for Healthcare Research and Quality, 2008. http://www.hcup-us.ahrq.gov/reports/statbriefs/sb64.pdf. Accessed November 3, 2015
- Berm H, Maggi J, Nierman D, et al. High cost of stage IV pressure ulcers. Am J Surg 2010;200:473-7
- Whitney JA, Phillips L, Aslam R, et al. Guidelines for the treatment of pressure ulcers. Wound Rep Reg 2006;14:663-79
- Bain RM. Pressure ulcers. In: Soriano RP, Fernandez HM, Kassel CK, et al., eds. Fundamental of geriatric medicine. New York, NY: Springer, 2007. pp. 540
- McCallon SK, Weir D, Lantis JC, 2nd. Optimizing wound bed preparation with collagenase enzymatic debridement. J Am Coll Clin Wound Spec 2015;6:14-23
- Milne CT, Ciccareli AO, Lassy M. A comparison of collagenase to hydrogel dressings in maintenance debridement and wound closure. Wounds 2012;24:317-22
- Milne CT, Ciccareli AO, Lassy M. A comparison of collagenase to hydrogel dressings in wound debridement. Wounds 2010;22:270-4
- Waycaster C, Milne CT. Clinical and economic benefit of enzymatic debridement of pressure ulcers compared to autolytic debridement with a hydrogel dressing. J Med Econ. 2013;16:976-86
- Carter MJ, Gilligan AM, Waycaster CR, et al. Treating pressure ulcers with clostridial collagenase ointment: results from the US wound registry. Wound Repair Regen 2016; 24:904-12
- Centers for Medicare & Medicaid Services. 2015 Physician quality reporting system qualified clinical data registries. Baltimore, MD. https://www.cms.gov/Medicare/Quality-Initiatives-Patient-Assessment-Instruments/PQRS/Downloads/2015QCDRPosting.pdf. Accessed August 23, 2016
- Rosenbaum P, Rubin D. The central role of the propensity score in observational studies for causal effects. Biometrika 1983;70:41-55
- Baser O. Too much ado about propensity score models? Comparing methods of propensity score matching. Value Health 2006;9:377-85
- Sonnenberg FA, Beck JR. Markov models in medical decision making: a practical guide. Med Decis Making 1993;13:322-38
- National Center for Health Statistics, Centers for Disease Control and Prevention. National Vital Statistics System: mortality data, 2013. Atlanta, GA. http://www.cdc.gov/nchs/deaths.htm. Accessed August 23, 2016
- Gould L, Stuntz M, Giovannelli M, et al. Wound healing society 2015 update on guidelines for pressure ulcers. Wound Repair Regen 2016;24:145-62
- Thomas DR. Prevention and treatment of pressure ulcers. J Am Med Dir Asso. 2006;7:46-69
- Allman RM. Pressure ulcers among the elderly. N Engl J Med 1989;320:850-3
- Gold M, Siegel JE, Russell LB, et al., eds. Cost-effectiveness in health and medicine. New York, NY: Oxford University Press, 1996. Appendix A304–11
- Dale M, Cox-Martin B, Shaw P, et al. Cost-effective non-surgical treatment of chronic pressure ulcers in the community. Br J Community Nurs 2014;S6(Suppl):S8-S12
- Sameem M, Au M, Wood T, et al. A systematic review of complication and recurrence rates of musculocutaneous, fasciocutaneous, and perforator-based flaps for treatment of pressure sores. Plast Reconstr Surg 2012;130:67e-77e
- Püllen R, Popp R, Volkers P, et al. Prospective randomized double-blind study of the wound-debriding effects of collagenase and fibrinolysin/deoxyribonuclease in pressure ulcers. Age Ageing 2002;31:126-30
- Sherman RA. Maggot versus conservative debridement therapy for the treatment of pressure ulcers. Wound Repair Regen 2002;10:208-14
- Wilcox JR, Carter MJ, Covington S. Frequency of debridements and time to heal: a retrospective cohort study of 312 744 wounds. JAMA Dermatol 2013;149:1050-8