
Abstract
Background: The cost-effectiveness of a heart failure management intervention can be further informed by incorporating the expected benefits and costs of future survival.
Methods: This study compared the long-term costs per quality-adjusted life year (QALY) gained from home-based (HBI) vs specialist clinic-based intervention (CBI) among elderly patients (mean age = 71 years) with heart failure discharged home (mean intervention duration = 12 months). Cost-utility analysis was conducted from a government-funded health system perspective. A Markov cohort model was used to simulate disease progression over 15 years based on initial data from a randomized clinical trial (the WHICH? study). Time-dependent hazard functions were modeled using the Weibull function, and this was compared against an alternative model where the hazard was assumed to be constant over time. Deterministic and probabilistic sensitivity analyses were conducted to identify the key drivers of cost-effectiveness and quantify uncertainty in the results.
Results: During the trial, mortality was the highest within 30 days of discharge and decreased thereafter in both groups, although the declining rate of mortality was slower in CBI than HBI. At 15 years (extrapolated), HBI was associated with slightly better health outcomes (mean of 0.59 QALYs gained) and mean additional costs of AU$13,876 per patient. The incremental cost-utility ratio and the incremental net monetary benefit (vs CBI) were AU$23,352 per QALY gained and AU$15,835, respectively. The uncertainty was driven by variability in the costs and probabilities of readmissions. Probabilistic sensitivity analysis showed HBI had a 68% probability of being cost-effective at a willingness-to-pay threshold of AU$50,000 per QALY.
Conclusion: Compared with CBI (outpatient specialized HF clinic-based intervention), HBI (home-based predominantly, but not exclusively) could potentially be cost-effective over the long-term in elderly patients with heart failure at a willingness-to-pay threshold of AU$50,000/QALY, albeit with large uncertainty.
Introduction
Heart failure (HF) has been recognized as a major clinical and public health problem, associated with significant mortality, morbidity, and healthcare expenditures, particularly among those aged ≥65 yearsCitation1. As the population ages and lives longer, HF becomes increasingly prevalent in many parts of the world, and HF remains the most common cause of hospitalization among elderly patients. Patients hospitalized with HF are at high risk for all-cause re-hospitalization, with a 1-month readmission rate of 25%Citation2, the cost of hospitalization accounting for the majority of total healthcare expenditure in these patientsCitation3,Citation4, and up to one-third of readmissions is considered preventableCitation5. The reduction of costs and the improvement in health outcomes has been a focus of new pharmaceuticals, medical devices, and prevention strategies such as disease management interventions. Although, once diagnosed, HF persists for the remainder of a patient’s lifetime, the duration of most clinical trials is limited to 6–12 monthsCitation6–8. In a recent systematic review of within-trial cost-effectiveness studies for HF disease management programsCitation9, only two studies (6%)Citation10,Citation11 followed patients up for a minimum of 2 years. We recently reportedCitation12, based on the median follow-up of 3.2 years, that a home-based disease management intervention (HBI) for elderly HF patients is likely to be cost-effective compared with a clinic-based intervention (CBI), mainly due to shorter hospital stay in the HBI group. To further inform policy decisions, a long time horizon is usually advocated, particularly for interventions that concern conditions that affect one’s remaining lifeCitation13–15. Improved survival could mean postponing the inevitable surge of costly readmissions often seen in patients with end-stage HFCitation16,Citation17. A long time horizon such as 10 or 20 years takes into account such subsequent costs instead of just the benefits and costs captured within a follow-up period. In this study, we aim to evaluate the long-term cost-effectiveness of HBI vs CBI over a future period where all costs and benefits of a program are likely to be realized by extrapolating the observed data within the multi-center, randomized Which Heart Failure Intervention Is Most Cost-Effective & Consumer Friendly in Reducing Hospital Care? (WHICH?) Trial.
Methods
A model-based analysis was conducted to assess the long-term cost-effectiveness of HBI vs CBI. The primary data source of a model-based analysis was the “WHICH?” trial, a pragmatic multi-center randomized trial comparing home- vs clinic-based management of chronic heart failure (CHF), conducted between 2008–2011. The details of the trial have been previously publishedCitation18,Citation19. Briefly, prior to hospital discharge from three Australian tertiary hospitals, 143 and 137 patients with a cardiologist-confirmed diagnosis of CHF (New York Heart Association [NYHA] Functional Class II to IV) were randomized into HBI or CBI, respectivelyCitation20. Both groups received nurse-led multidisciplinary care over 12 months, with the same principles and components of gold-standard management. However, the HBI was predominantly delivered in the patient’s own home and in close liaison with community-based healthcare professionals; whereas the CBI was predominantly delivered via a specialist CHF outpatient clinic with no home visits. Both varied the intensity and complexity of management according to the patient’s clinical needs, with a minimum requirement of a home visit (HBI) or clinic visit (CBI) 7–14 days post-discharge and increased surveillance following an unplanned admission to hospitalCitation20. The duration of follow-up was: mean = 2.7, median = 3.2, and maximum = 4.8 years. Within the WHICH study, the clinical outcomes were ascertained after period 1 (≤15 months) and period 2 (months 16–32), which informed model inputs. TreeAge Pro Software 2015 was used to build the model. Statistical analyses to derive model input parameters were performed using Stata 14 (Stata Corporation, College Station, TX).
Model structure
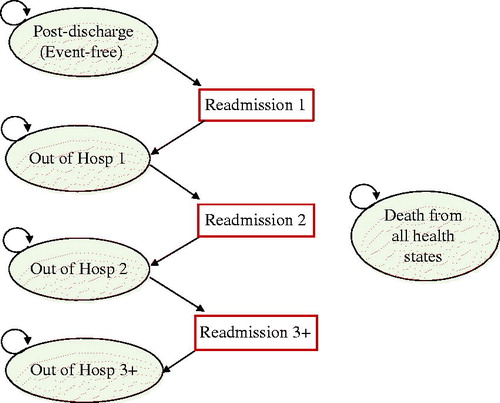
A Markov cohort model was used to represent repetitive events and the time dependence of probabilitiesCitation21. The model is expected to approximate the progression of HF where the impact of continuous deterioration is deemed to be marked by additional hospitalizationCitation22. Several cost-effectiveness studies of HF-MPsCitation23–25 have used the number of readmissions as a proxy for clinical deterioration. A 1-month cycle was chosen because it is short enough to represent the frequency of hospitalization and deathCitation26. depicts the Markov model. The ovals represent health states, the rectangles represent readmission events (a transient event), and the arrows represent transitions between the states. Consistent with the trial, patients were assumed to start from the “event-free” state at post-discharge. Within a 1-month cycle, those discharged from the index hospitalization could remain out of hospital, experience a further readmission, or die from any cause. The model was projected over a 15-year time horizon, by which time most patients are predicted to have died (97%). The time horizon was also informed by a previous report on the average lifespan of patients discharged from hospital with HF, which ranged from 2.9 for high-risk octogenarian men, to 19.5 years for low-risk womenCitation27.
Figure 1. Markov model diagram (health states defined by readmission).
Model inputs
Transition probabilities of readmission or death were derived from the WHICH? Trial over the median follow-up of 3.2 years (mean = 2.7 years). In this trial, there were potentially important differences in the baseline profiles of the two groups that may explain some differences in health and cost outcomesCitation20 (on average, those in CBI were 3 years older and 0.6 units higher in Charlson Comorbidity Index). Thus, we obtained covariate-adjusted means of costs and rates of death and readmissions (adjusted for age and the Comorbidity Index) and calculated the factors that convert an unadjusted to an adjusted rate. shows model input parameters.
Table 1. Model input parameter data.
Cost data
Costs in the model were described from a perspective of the Australian government-funded healthcare system, with only direct costs included (hospital-activity, community-based care, intervention). A societal perspective was not considered as the study population was mostly of retirement age or older (mean age = 71), lost wages for patients or caregivers would be negligible, and the study intervention is unlikely to induce cost-shifting (e.g. from paid work to unpaid work).
To estimate the costs per hospitalization, the total hospital costs in each group were divided by the number of hospitalizations ascertained during the trial at periods 1 and 2, respectively. This assumes that the hospital costs per patient per month reflected the intervention effect (i.e. reduced length of hospital stay in HBI, as observed in the trial)Citation20. We also derived the costs of community-based care per patient per month spent out of hospital. To extrapolate the hospital costs and the costs of community-based care beyond the trial duration, we increased the costs in period 2 by 10%, as resource use is expected to increase thereafter, with no residual intervention effects from either HBI or CBI assumed. That is, multiplying 1.1-times the upper limit of 95% confidence interval of the cost in either group (whichever is higher), and this value was used for both groups for extrapolation. The costs of intervention during the mean follow-up of 15 months (telephone follow-up, travel, HF specialist nurse coordinator’s labor) were available, which were spread across the first 15 months in each group. We estimated the costs of intervention per patient per month, and this was not extrapolated beyond 15 months, as each intervention was implemented only once.
The costs and outcomes accrued after 1 year were discounted at an annual rate of 5%, as per the guidelines of the leading health technology assessment body in AustraliaCitation28, with sensitivity tested over the range of 0%, 3%, and 7%Citation29. All costs are reported in the year of study completion, 2013 Australian dollars (AU$) (the purchasing power parity for 1 AU$in 2013 was 0.67 US dollars in 2015)Citation30.
Transition probabilities
To estimate the mean survival over time, survival curves were plotted according to the number of readmissions (0, 1, 2, ≥3) in each group. Seven parametric models were fitted independently to each intervention arm, stratified by the number of readmissions (0, 1, 2, ≥3). A Weibull distribution was chosen based on their visual fit to the Kaplan-Meier curve as well as their statistical fit to the observed data (Akaike and Bayesian information criterion (AIC, BIC)). We then performed Weibull regression and obtained the parameters that determine time-dependent trajectories according to the number of hospitalizations (0, 1, 2, ≥3) for each group. These parameters were used to calculate time-dependent probabilities of death. Monthly transition probabilities were calculated based on the cumulative hazard from the Weibull regression. The Weibull distribution assumes that the baseline hazard is time-dependent; it allows the hazard to increase or decrease over time at a different rateCitation31. To adjust for the baseline covariates that somewhat favored HBI during the WHICH? Trial, we multiplied the Weibull-based probabilities by the factor that converted an unadjusted to an adjusted rate. We also compared a Markov model with Weibull-based probabilities of death against an exponential model where the hazard was assumed to be constant over time as a sensitivity analysis. During the extrapolation phase, to account for the increase in the probability of dying as the cohort ages, we multiplied the mortality rates for those with ≥3 readmissions by the factor that the mortality rate increased annually in the general population as per the Australian life tablesCitation32, matched to the sex/age distribution of the WHICH population (males = 73%, mean age = 71).
The probabilities of additional hospital readmissions could not be obtained in the same way as for deaths, because the data on time to readmission was only partially available. Thus, we estimated the average probabilities of readmission by dividing the total number of events by the average duration for period 1 (≤15 months) and period 2 (months 16–32), respectively. To extrapolate beyond the trial duration (>32 months), we increased the rate in period 2 by 10%, as readmission was expected to increase thereafter if no residual effects from either HBI or CBI is assumed. That is, multiplying 1.1-times the upper limit of a plausible range of the cost in either group (whichever is higher), and this value was used for both groups.
Utility
The mean baseline utility score measured in all patients during the trial (no readmission at baseline by definition) (0.71) was used for both groups. To estimate a disutility value for each additional readmission, we regressed baseline utility, age, and the number of all-cause readmissions against post-intervention utility values (15 months on average). The disutility value per hospitalization (−0.001) was then subtracted from the baseline utility score per additional readmission.
Cost-effectiveness analyses
We calculated quality-adjusted life-years (QALY) based on the baseline utility value multiplied by time spent with that utility value less any disutility per additional readmission. Cost-effectiveness was assessed by the incremental cost per QALY gained from HBI over that of CBI. The incremental cost-utility ratio (ICUR) was calculated and the uncertainty surrounding it was quantifiedCitation33 with probabilistic sensitivity analysis (PSA). Using the cost-effectiveness acceptability curve, the probability of HBI being cost-effective for a range of willingness-to-pay threshold per additional QALY gained was then estimatedCitation34. Incremental net monetary benefit (INMB) was calculated as INMB = λ ∗ ΔQALY – Δcost, where λ is the decision maker's maximum willingness to pay for a QALY, and Δ is the difference between the HBI and CBI groups. If INMB is above zero, the intervention is deemed cost-effective at the chosen λ. We used $50,000 per QALY gained, as it is a commonly cited threshold in Australian cost-effectiveness analysesCitation35–37. All costs and QALYs were discounted at a rate of 5% per year.
Assumptions made in the base-case model
We assumed that HBI’s survival gain observed within the trial did not persist beyond the median follow-up duration of the trial. Thereafter, the same mortality rates were applied to both groups (HF-specific rate multiplied by the effect of increasing age derived from national life tables).
The intervention itself was assumed to have no effect on utility (health-related quality-of-life); the same utility values were used for both groups.
The movement between health states was assumed to be independent of any medical history or other non-clinical characteristics.
The probabilities of transition to the third or higher readmission were assumed to be constant (e.g. from the 3rd to 4th is the same as the 10th to 11th).
The intervention was implemented only once as done in the trial (i.e. no repeat intervention “boosters” in the extrapolation).
Sensitivity analysis
First, one-way sensitivity analysesCitation38 were conducted to test the robustness of the base-case results to the changes in key variables where uncertainty is likely to arise. A tornado diagram was used to identify the variables most likely to impact the net monetary benefit (NMB) at a willingness-to-pay threshold of AU$50,000 per QALY gained. NMB is calculated by multiplying AU$50,000 by the additional QALY gained from the intervention and then subtracting the additional cost incurred from the interventionCitation39. The higher the NMB, the higher the benefit of the intervention while taking costs into account.
Second, we performed probabilistic sensitivity analyses (PSA) where the model parameters were allowed to vary simultaneously using Monte Carlo simulation (20,000 iterations). Probability distributions were assigned to the model’s input parameters; normal distributions for start age, gamma distributions for cost, while event rate and utility parameters were assigned beta distributions within the plausible range specified in . The effects of parameter uncertainty assessed using PSA were graphically presented on the cost-effectiveness plane and with cost-effectiveness acceptability curves.
Third, we also compared the results from a Weibull model where death was adjusted for age and comorbidity (base-case) against those from an unadjusted Weibull model as well as an exponential model where empirical rates of death found in the randomized trial were used.
Results
Base-case
At 15 years after the index hospital discharge, the cumulative number of readmissions was estimated to be 26.7 and 19.8 in HBI and CBI, respectively. At 15 years, 96% and 97% were estimated to be dead in HBI and CBI, respectively. The cumulative costs and QALYs at 15 years were AU$102,852 and 2.9 in HBI, whereas they were AU$88,976 and 2.3 in CBI. The ICUR and incremental NMB were AU$23,352/QALY and AU$15,835 (HBI vs CBI).
Sensitivity analysis
shows the main results of the base-case and one-way sensitivity analyses. The variables identified by the tornado diagram () as having the greatest impact on the incremental NMB (at $50,000/QALY) were HBI’s cost and probability of readmission in period 1, followed by discount rate, HBI’s cost and probability of readmission in period 2, HBI’s cost of community-based care, baseline utility (pooled), time horizon, disutility for each additional readmission, and cost of intervention in HBI (). The variables shown not to have a discernible impact on NMB in the Tornado diagram were: baseline age, CBI’s cost, and probability of readmission in period 1 and 2, CBI’s cost of community-based care and cost of intervention in CBI. Although HBI’s hospital cost and readmission rate in period 1 influenced the cost-effectiveness the most, HBI’s incremental NMB remained positive and its ICURs were less than AU$50,000/QALY) (). Smaller discount rates were associated with a higher incremental NMB, despite higher costs. Overall, the variations in NMB due to this uncertainty were all within the positive range, suggesting HBI being generally cost-effective at the AU$50,000 threshold.
Table 2. Base-case and one-way sensitivity analysis results.
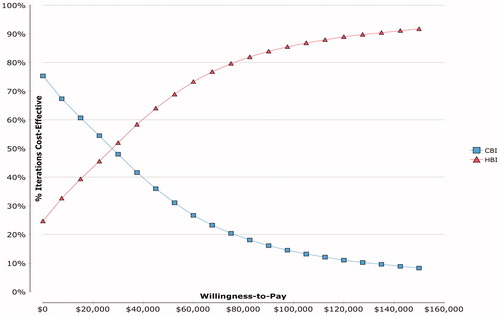
The cost-effectiveness plane () shows incremental effectiveness (QALY) on the horizontal axis and incremental cost (total healthcare cost) on the vertical axis. The ellipsis shows the 95% confidence interval. The line labeled “WTP = $50,000” intersects the origin of the plot, and the area below the line encompasses the dots that are cost-effective at the AU$50,000 threshold. A cost-effectiveness acceptability curve () shows the probability of HBI being cost-effective was 68% and 86% at willingness-to-pay thresholds of AU$50,000/QALY and AU$100,000/QALY, respectively.
Figure 2. Cost-effectiveness plane (incremental cost and effectiveness relative to CBI). The dots represent 20,000 Monte Carlo simulation trials. The ellipse corresponds to the 95% CIs around the results. The diagonal line represents a government-funded health system’s willingness to pay ($50,000/QALY). The trials (dots) to the right of the WTP line indicate more favorable cost-effectiveness. CBI: clinic-based intervention; HBI: home-based intervention; QALY: quality-adjusted life year; WTP: willingness to pay ($/QALY).
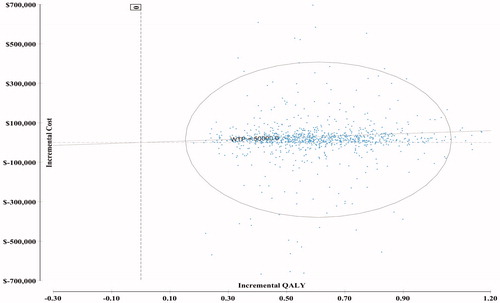
Figure 3. Cost-effectiveness acceptability curve. The curve indicates the probability of each strategy being cost-effective relative to the other strategy for different willingness to pay thresholds (based on 20,000 Monte Carlo simulation trials). The probability of HBI being more cost-effective was 68% at the $50,000 threshold and 86% at the $100,000 threshold. CBI: clinic-based intervention; HBI: home-based intervention; QALY: quality-adjusted life year; WTP: willingness to pay ($/QALY).
We also compared the results from the Weibull model against those from the exponential model, both of which indicated HBI’s cost-effectiveness at AU$50,000/QALY, and the probabilities of HBI being cost-effective was 68% (base-case: Weibull adjusted for age and comorbidity), 68% (Weibull unadjusted), and 67% (exponential). Their incremental cost, QALY, NMB, and ICUR also suggest HBI being cost-effective at the AU$50,000 threshold ().
Readmission—its impact on cost and its pattern over time
During the WHICH? Trial, a higher number of readmissions was generally associated with higher total costs (). The mean total cost was the highest in those with ≥3 readmissions in both groups. In the CBI, death occurred most frequently in those with only one readmission (70%), whereas in the HBI it was most frequent in those with two readmissions (40%). then introduces a time dimension showing the monthly probability of death according to the number of hospitalizations, as estimated from the WHICH trial data using Weibull regression. The Weibull model revealed time-dependent trajectories according to the number of hospitalizations (1, 2, ≥3), which greatly varied across the groups. The probability of death was the highest in those with 0 readmission (HBI: 10.6%; CBI: 11.4%) and 1 readmission in CBI (CBI: 11.8%) within 30 days of discharge. Thereafter, experiencing one readmission in the CBI had the highest risk until it subsided to 2% at month 39. In the HBI, the probability of death remained below 2% after the first 30 days, regardless of the number of readmissions experienced. The hazards for two readmissions for HBI and for ≥3 readmissions in both groups were almost constant over time.
Figure 4. Probability of death stratified by the number of readmissions during the WHICH? trial.
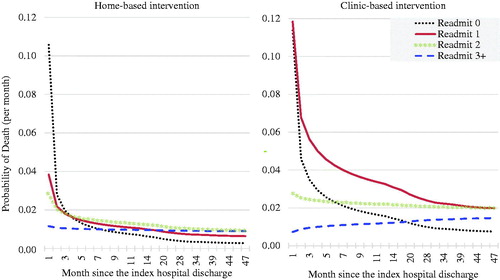
Figure 5. Tornado diagram for one-way sensitivity analysis (effects of net monetary benefit at $50,000/QALY).
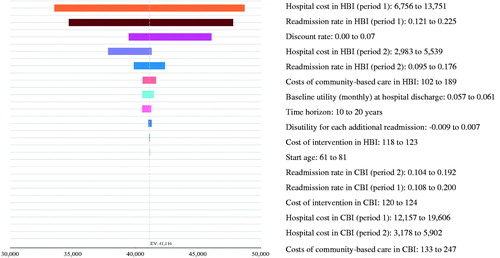
Table 3. The total cost and the frequency of death stratified by the number of readmissions during the WHICH? trial.
Model validation
We assessed the fit of the model to the observed data in terms of mortality and readmissions. At 32 months (mean follow-up), the ratios of predicted:observed mortality in HBI and CBI were 109% and 102%, respectively (HBI = 39.2/35.7%, CBI = 52.6/51.8%). As for the total number of hospital readmissions, the predicted-observed ratios in HBI and CBI were 90% and 79%, respectively (HBI = 3.74/4.15; CBI = 3.14/4.00). In order to assess how plausible the extrapolation of our model was, we compared our modeled event rates (deaths, readmissions) with those of the control groups in other modeled studies previously publishedCitation24,Citation25. These rates were relatively comparable (within 30%), considering the limited comparability in patient characteristics, intervention duration, or time horizon adopted.
Discussion
We explored the long-term cost-effectiveness of HBI vs CBI in elderly patients with HF by accounting for the impact of hospital readmissions on health and cost outcomes. Given the ICUR of AU$23,352 from our model, HBI could potentially be a preferred strategy compared with CBI over the long term in elderly patients with CHF, albeit with uncertainty due mainly to the variability in the cost and risk of readmissions. The probability that HBI is a cost-effective strategy compared with CBI was 68%, thus, on average, is likely to be the better investment from a healthcare funders perspective. While a long time horizon may be deemed policy-relevant for a life-long condition, the long-term projections of cost-effectiveness can increase uncertainty. This is further complicated by the fact that the post-discharge period immediately after hospitalization carries a high risk of poor clinical outcome, known as the “vulnerable phase”Citation40,Citation41. Evidence suggests that ∼10% of patients hospitalized with HF die within 30 days of dischargeCitation25,Citation42, and ∼25% of patients hospitalized with HF are readmitted during this periodCitation43,Citation44.
In our study, we found somewhat counterintuitively that a higher number of readmissions was not always accompanied by a higher rate of death (). The probability of death among those with 0 readmission was the highest within 30 days of discharge in both groups: 10.6% in HBI and 11.4% in CBI, which is strikingly similar to the 10% mortality within 30 days that was previously found in the US Medicare beneficiariesCitation43,Citation44. It is likely that those with 0 readmission are the representation of those too sick to survive the first 30 days without getting readmitted, and those who survived long enough to eventually confer the lowest risk of death. In the HBI, those with 0 readmission had the lowest risk across the strata from the 8th month onward, whereas, in CBI, this did not occur until the 18th month. After 30 days of discharge, the first readmission (i.e. “Readmit 1”) in the CBI remained at high risk of death until it subsided to 2% by month 39, whereas in the HBI the risk was already below 2% from month 3. These suggest a possibility that, under certain circumstances, the risk of death during the “vulnerable phase” can be almost halved, while a readmission is still a new experience (but not after being readmitted three times or more).
Except those who were too sick to survive the first 30 days without getting readmitted, much of the elevated readmission-specific risk in the CBI appeared “collapsed” at the lower level of risk in the HBI (), although whether this observed difference was mainly due to HBI warrants careful considerations. The Weibull distribution was based on the observed data within the trial (the empirical probability of surviving past certain times in the study sample). Given the previously-noted baseline imbalance in age and comorbidity which somewhat favored HBI, despite randomizationCitation20, we cannot entirely preclude the possibility that the between-group difference is attributable to the factors other than the study intervention, although it can also be argued that the patients in the HBI group (at baseline) had had a longer stay in a specialist/intensive care unit and were more likely to have self-reported depressive symptoms than in the CBICitation20. Therefore, we developed a model with inputs adjusted for baseline age and comorbidity, and this is used as a base-case because the incremental NMB of HBI under this scenario was smaller than the other two models shown in “monthly probabilities of death” in (i.e. selection of the most conservative assumption). Although the results somewhat varied, all parametric models suggested the cost-effectiveness of HBI at the AU$50,000 threshold, albeit with uncertainty. is instructive in suggesting that, in some sub-populations, the 1-month or 6-month mortality (for instance) can be reduced by some means. This may be attributable, if not to HBI, to age, comorbidity, reason for readmission, a clinical threshold of readmission criteria, or the combination of some of these factors.
In general, a longer time horizon is likely to improve the intervention’s cost-effectiveness if a fixed component of the intervention cost allocated to the trial period in a within-trial analysis is then assumed to be allocated to a longer term in a modeled analysis. In this study, however, we compared two active interventions which incurred very similar intervention costs (), and the extrapolation did not affect the incremental cost-effectiveness. Thus, the source of between-group differences during the extrapolation hinged mainly on the trade-off between the benefits and the costs of survival beyond the trial duration, and a longer time horizon did not necessarily improve the HBI’s cost-effectiveness. The covariate-adjusted incremental NMB of HBI in a 15-year model presented here was AU$15,835, whereas in the within-trial analysis previously reported, it was AU$25,159Citation45.
In this study, we made conservative assumptions. First, as the extent and speed at which benefits of intervention wane over time is unobservedCitation9, we assumed that the HBI’s survival gain observed within the trial did not persist beyond the trial duration. Second, key model inputs (cost, readmission, death rates) were adjusted for baseline age and comorbidity to conservatively estimate HBI’s intervention effect, despite randomization.
The limitations of this study are as follows. First, as for the probability of readmissions, we used period-specific rates in period 1 (≤15 months) and period 2 (16–32 months) and averaged them out in each period, instead of accounting for the time to each event, which was not possible due to data availability. This may not have predicted the true rates at a particular point in time, although less so over 1–2 years combined. Second, we used the average cost per readmission. This may have over-/under-estimated the true cost of readmissions at specific time points. Third, risk of readmission is known to be the highest immediately after discharge and just before deathCitation46. The use of a long-term horizon is supposed to take into account such subsequent end-of-life costs instead of just the benefits and costs captured within a trial duration. However, such a peri-death surge was only reflected in 44% of the study participants who died within the trial, not for the remaining 56% who lived past the end of the trial. This would have under-estimated the lifetime readmission risk and associated costs for both intervention arms, but more so for the HBI, as fewer patients died in HBI within the trial (35.7% vs 51.8%).
Conclusion
Compared with CBI (outpatient specialized HF clinic-based intervention), HBI (home-based predominantly, but not exclusively) could potentially be cost-effective over the long-term in elderly patients with CHF at a willingness-to-pay threshold of AU$50,000/QALY, albeit with large uncertainty.
Transparency
Declaration of funding
This work was supported by a National Health and Medical Research Council of Australia program grant [grant #519823], and in part by the Victorian Government’s Operational Infrastructure Support Program.
Declaration of financial/other relationships
MC and SS are supported by the National Health and Medical Research Council of Australia. JME peer reviewers on this manuscript have no relevant financial or other relationships to disclose.
Notice of correction
Please note that the abstract and Figure 4 have been amended since the article was first published online (1 December 2016).
Acknowledgement
We thank all the cardiac nurses, health care professionals and patients who participated and staff who contributed to data management.
References
- Roger VL. Epidemiology of heart failure. Circ Res 2013;113:646-59
- Yancy CW, Jessup M, Bozkurt B, et al. 2013 ACCF/AHA guideline for the management of heart failure: a report of the American College of Cardiology Foundation/American Heart Association task force on practice guidelines. J Am Coll Cardiol 2013;62:e147-239
- Berry C, Murdoch DR, McMurray JJ. Economics of chronic heart failure. Eur J Heart Fail 2001;3:283-91
- Stewart S. Financial aspects of heart failure programs of care. Eur J Heart Fail 2005;7:423-8
- Oddone EZ, Weinberger M, Horner M, et al. Classifying general medicine readmissions. Are they preventable? Veterans affairs cooperative studies in health services group on primary care and hospital readmissions. J Gen Intern Med 1996;11:597-607
- Yu DSF, Thompson DR, Lee DTF. Disease management programmes for older people with heart failure: crucial characteristics which improve post-discharge outcomes. Eur Heart J 2006;27:596-612
- Whellan D, Hasselblad V, Peterson E, et al. Meta-analysis and review of heart failure disease management randomized controlled clinical trials. Am Heart J 2005;149:722-9
- Feltner C, Jones CD, Cené CW, et al. Transitional care interventions to prevent readmissions for persons with heart failure. A systematic review and meta-analysis. Ann Intern Med 2014;160:774-84
- Maru S, Byrnes J, Carrington MJ, et al. Systematic review of trial-based analyses reporting the economic impact of heart failure management programs compared with usual care. Eur J Cardiovasc Nurs 2016;15:82-90
- Del Sindaco D, Pulignano G, Minardi G, et al. Two-year outcome of a prospective, controlled study of a disease management programme for elderly patients with heart failure. J Cardiovasc Med (Hagerstown) 2007;8:324-9
- Pulignano G, Del Sindaco D, Di Lenarda A, et al. Usefulness of frailty profile for targeting older heart failure patients in disease management programs: a cost-effectiveness, pilot study. J Cardiovasc Med (Hagerstown) 2010;11:739-47
- Maru S, Byrnes J, Carrington MJ, et al. Cost-effectiveness of home versus clinic-based management of chronic heart failure: Extended follow-up of a pragmatic, multicentre randomized trial cohort—The WHICH? study (Which Heart Failure Intervention Is Most Cost-Effective & Consumer Friendly in Reducing Hospital Care). Int J Cardiol 2015;201:368-75
- Latimer NR. Survival analysis for economic evaluations alongside clinical trials—extrapolation with patient-level data: inconsistencies, limitations, and a practical guide. Med Decis Making 2013;33:743-54
- Briggs A, Claxton K, Sculpher M, et al. Decision modelling for health economic evaluation. New York: Oxford University Press; 2006
- Gold M, Siegel J, Russell L, et al. Cost-effectiveness in health and medicine. New York: Oxford University Press, Inc; 1996
- Inglis SC, Pearson S, Treen S, et al. Extending the horizon in chronic heart failure: effects of multidisciplinary, home-based intervention relative to usual care. Circulation 2006;114:2466-73
- Holland R, Battersby J, Harvey I, et al. Systematic review of multidisciplinary interventions in heart failure. Heart 2005;91:899-906
- Stewart S, Carrington MJ, Marwick T, et al. The WHICH? trial: rationale and design of a pragmatic randomized, multicentre comparison of home- vs clinic-based management of chronic heart failure patients. Eur J Heart Fail 2011;13:909-16
- Stewart S, Carrington MJ, Marwick TH, et al. Impact of home versus clinic-based management of chronic heart failure: The WHICH? (Which Heart Failure Intervention Is Most Cost-Effective & Consumer Friendly in Reducing Hospital Care) multicenter, randomized trial. J Am Coll Cardiol 2012;60:1239-48
- Stewart S, Carrington MJ, Horowitz JD, et al. Prolonged impact of home versus clinic-based management of chronic heart failure: extended follow-up of a pragmatic, multicentre randomized trial cohort. Int J Cardiol 2014;174:600-10
- Sonnenberg F, Beck J. Markov models in medical decision making: a practical guide. Med Decis Making 1993;13:322-38
- Stewart S, Ekman I, Ekman T, et al. Population impact of heart failure and the most common forms of cancer: a study of 1 162 309 hospital cases in Sweden (1988 to 2004). Circ Cardiovasc Qual Out 2010;3:573-80
- Chan DC, Heidenreich PA, Weinstein MC, et al. Heart failure disease management programs: a cost-effectiveness analysis. Am Heart J 2008;155:332-8
- Gohler A, Conrads-Frank A, Worrell SS, et al. Decision-analytic evaluation of the clinical effectiveness and cost-effectiveness of management programmes in chronic heart failure. Eur J Heart Fail 2008;10:1026-32
- Moertl D, Steiner S, Coyle D, et al. Cost-utility analysis of NT-proBNP-guided multidisciplinary care in chronic heart failure. Int J Technol Assess Health Care 2013;29:3-11
- Siebert U, Alagoz O, Bayoumi AM, et al. State-transition modeling: a report of the ISPOR-SMDM Modeling Good Research Practices Task Force–3. Value Health 2012;15:812-20
- Alter DA, Ko DT, Tu JV, et al. The average lifespan of patients discharged from hospital with heart failure. J Gen Intern Med 2012;27:1171-9
- Australian Government DoH. The pharmaceutical benefits advisory committee (PBAC) guidelines. Version 4.4; 2013. http://www.pbac.pbs.gov.au/information/table-of-contents.html. Accessed November 19, 2014
- Australian Government. Best practice regulation handbook. Canberra: Australian Government; 2007. p 140. http://regulationbodyofknowledgeorg/wp-content/uploads/2013/03/AustralianGovernment_Best_Practice_Regulationpdf. Accessed August 3, 2015
- Campbell and Cochrane Economics Methods Group and the Evidence for Policy and Practice Information and Coordinating Centre. ‘CCEMG – EPPI-Centre Cost Converter’ (v.1.4). 2015, http://eppi.ioe.ac.uk/costconversion/default.aspx. Accessed February 15, 2016
- Allison P. Survival analysis using SAS: a practical guide. Cary, NC: SAS Publishing; 1995
- Australian Bureau of Statistics. Life tables 2011–2013 (cat. no. 3302.0). Released on 06/11/2014. http://www.abs.gov.au/ausstats/[email protected]/mf/3302.0.55.001. Accessed February 15, 2016
- Johnston K, Gray A, Moher M, et al. Reporting the cost-effectiveness of interventions with nonsignificant effect differences: example from a trial of secondary prevention of coronary heart disease. Int J Technol Assess Health Care 2003;19:476-89
- Drummond M, Sculpher M, Torrance G, et al. Methods for the economic evaluation of health care programmes. 3rd edn. New York: Oxford University Press; 2005
- Chim L, Kelly PJ, Salkeld G, et al. Are cancer drugs less likely to be recommended for listing by the Pharmaceutical Benefits Advisory Committee in Australia? Pharmacoeconomics 2010;28:463-75
- George B, Harris A, Mitchell A. Cost-effectiveness analysis and the consistency of decision making: evidence from pharmaceutical reimbursement in Australia (1991 to 1996). Pharmacoeconomics 2001;19:1103-9
- Harris AH, Hill SR, Chin G, et al. The role of value for money in public insurance coverage decisions for drugs in Australia: a retrospective analysis 1994–2004. Med Decis Making 2008;28:713-22
- Yu J, Shah BM, Ip EJ, et al. A Markov model of the cost-effectiveness of pharmacist care for diabetes in prevention of cardiovascular diseases: evidence from Kaiser Permanente Northern California. J Manag Care Pharm JMCP 2013;19:102-14
- Rascati KL. Essentials of pharmacoeconomics. 2nd edn. Philadelphia: Lippincott Williams & Wilkins; 2013
- Gheorghiade M, Vaduganathan M, Fonarow GC, et al. Rehospitalization for heart failure problems and perspectives. J Am Coll Cardiol 2013;61:391-403
- Metra M, Gheorghiade M, Bonow RO, et al. Postdischarge assessment after a heart failure hospitalization: the next step forward. Circulation 2010;122:1782-5
- Greene SJ, Fonarow GC, Vaduganathan M, et al. The vulnerable phase after hospitalization for heart failure. Nat Rev Cardiol 2015;12:220-9
- Bueno H, Ross JS, Wang Y, et al. Trends in length of stay and short-term outcomes among medicare patients hospitalized for heart failure, 1993–2006. JAMA 2010;303:2141-7
- Dharmarajan K, Hsieh AF, Lin Z, et al. Diagnoses and timing of 30-day readmissions after hospitalization for heart failure, acute myocardial infarction, or pneumonia. JAMA 2013;309:355-63
- Maru S, Byrnes J, Carrington MJ, et al. Cost-effectiveness of home versus clinic-based management of chronic heart failure: extended follow-up of a pragmatic, multicentre randomized trial cohort; the WHICH? study (Which Heart Failure Intervention Is Most Cost-Effective & Consumer Friendly in Reducing Hospital Care). Int J Cardiol 2015;201:368-75
- Desai AS, Stevenson LW. Rehospitalization for heart failure: predict or prevent? Circulation 2012;126:501-6
- Hirst NG, Whitty JA, Synnott RL, et al. Predictors of government subsidized pharmaceutical use in patients with diabetes or cardiovascular disease in a primary care setting: evidence from a prospective randomized trial. J Med Econ 2011;14:698-704