
Abstract
Background: Nab-paclitaxel plus gemcitabine (NAB-P + GEM) and FOLFIRINOX have shown superior efficacy over gemcitabine (GEM) in the treatment of metastatic pancreatic ductal adenocarcinoma (mPDA). Although the incremental clinical benefits are modest, both treatments represent significant advances in the treatment of a high-mortality cancer. In this independent economic evaluation for the US, the aim was to estimate the comparative cost-utility and cost-effectiveness of these three regimens from the payer perspective.
Methods: In the absence of a direct treatment comparison in a single clinical trial, the Bucher indirect comparison method was used to estimate the comparative efficacy of each regimen. A Markov model evaluated life years (LY) and quality-adjusted life years (QALY) gained with NAB-P + GEM and FOLFIRINOX over GEM, expressed as incremental cost-effectiveness (ICER) and cost-utility ratios (ICUR). All costs and outcomes were discounted at 3%/year. The impact of parameter uncertainty on the model was assessed by probabilistic sensitivity analyses.
Results: NAB-P + GEM was associated with differentials of +0.180 LY and +0.127 QALY gained over GEM at an incremental total cost of $25,965; yielding an ICER of $144,096/LY and ICUR of $204,369/QALY gained. FOLFIRINOX was associated with differentials of +0.368 LY and +0.249 QALY gained over GEM at an incremental total cost of $93,045; yielding an ICER of $253,162/LY and ICUR of $372,813/QALY gained. In indirect comparison, the overall survival hazard ratio (OS HR) for NAB-P + GEM vs FOLFIRINOX was 0.79 (95%CI = 0.59–1.05), indicating no superiority in OS of either regimen. FOLFIRINOX had an ICER of $358,067/LY and an ICUR of $547,480/QALY gained over NAB-P + GEM. Tornado diagrams identified variation in the OS HR, but no other parameters, to impact the NAB-P + GEM and FOLFIRINOX ICURs.
Conclusions: In the absence of a statistically significant difference in OS between NAB-P + GEM and FOLFIRINOX, this US analysis indicates that the greater economic benefit in terms of cost-savings and incremental cost-effectiveness and cost-utility ratios favors NAB-P + GEM over FOLFIRINOX.
Introduction
Pancreatic cancer is the fourth cause of cancer death in the US, and expected to become the second by 2020. More than half of the cases are diagnosed in the advanced/metastatic stage, and 1-year and 5-year survival rates are 15% and 2%, respectivelyCitation1. The standard of care has long been chemotherapy with gemcitabine (GEM), which showed an improvement in overall survival (OS) compared to fluorouracil (5.6 vs 4.4 months, p = .002)Citation2,Citation3. Recent evidence indicates that FOLFIRINOX and GEM in combination with nab-paclitaxel (NAB-P + GEM) may have greater efficacy than GEM aloneCitation3,Citation4. The PRODIGE4/ACCORD11 phase III trial of 342 treatment-naïve metastatic pancreatic ductal adenocarcinoma (mPDA) patients with ECOG score of 0/1 compared FOLFIRINOX (leucovorin 400 mg/m2, 5-fluorouracil 400 mg/m2, irinotecan 180 mg/m2, and oxaliplatin 85 mg/m2 in bolus followed by 2400 mg/m2 as 46-hour continuous infusion Q2W) to GEM. Significant improvements in median OS (11.1 vs 6.8 months, p < .001) and progression-free survival (PFS) (6.4 vs 3.3 months, p < .001) were noted for FOLFIRINOX over GEM3. The MPACT phase III trial randomized 861 treatment-naïve mPDA patients with Karnofsky score ≥70 (i.e. ECOG 0-2) to receive either 125 mg/m2 of NAB-P plus 1,000 mg/m2 of GEM Q4W or 1,000 mg/m2 of GEM Q1W for 7 weeks and then Q4W. Significant improvements in median OS (8.5 vs 6.7 months, p < .001) and PFS (5.5 vs 3.7 months, p < .001) were observed for NAB-P + GEM over GEM aloneCitation4. Pooled grade 3/4 adverse events (AE) for NAB-P + GEM, FOLFIRINOX, and GEM from both studies indicate lower AE rates for GEM and AE rates for NAB-P + GEM and FOLFIRINOX varying by AE type ()Citation3,Citation4. No randomized trials have evaluated these three regimens directly.
While the incremental survival benefit of these two treatments remains modest, both represent significant advances in treating mPDACitation5. In this independent economic analysis, we estimated the cost-effectiveness and cost-utility of NAB-P + GEM vs FOLFIRINOX vs GEM in the treatment of mPDA from the US payer perspective.
Methods
Model
The model utilized a cohort of patients characterized from the phase III clinical trialsCitation3,Citation4. In the absence of a single randomized trial directly comparing GEM vs NAB-P + GEM vs FOLFIRINOX, comparative efficacy and safety were estimated using the Bucher et al.Citation6 method of indirect comparison, a recognized pharmacoeconomic methodologyCitation7 that assumes a valid proportional hazard assumption between treatments. “Pairs” of trials (NAB-P + GEM vs GEM and FOLFIRINOX vs GEM) were compared indirectly by meta-regression using GEM as a common comparator to derive an indirect comparison estimate of NAB-P + GEM vs FOLFIRINOXCitation8. AE probabilities were calculated using odds ratios against NAB-P + GEM.
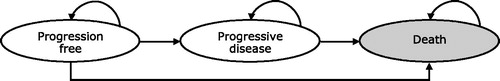
We developed a state-transition model with three disease states reflecting treatment pathway and survival (): PFS, survival with disease progression, and death. Patients start at the PFS state with three probabilities: staying in the same health state until the next cycle, progressing to the next disease stage, or death. Patients with disease progression have two probabilities: staying in the disease progression state or death. A full life-time horizon was implemented until 99% of the enrolled patients died. The model did not impose any age ceiling. The primary sources of evidence dictating transitions were the PRODIGE4/ACCORD11Citation3 and MPACTCitation4 trials; parametric modeling of survival analysis data; and the indirect comparison of NAB-P + GEM vs FOLFIRINOX. Health outcomes were expressed as life years (LY) and quality-adjusted life years (QALY) gained. The incremental cost-effectiveness (ICER) and cost-utility (ICUR) ratios quantified, respectively, the incremental cost of achieving one extra LY and one extra QALY with a given treatment over another treatment. Consistent with recent economic evaluations in the oncology setting, our approach and assumptions allowed us to model PFS and OS in a manner that reflects the clinical trial dataCitation9,Citation10.
Figure 1. State-transition model.
Analyses were specifically for the US and from the payer’s perspective. A bespoke state-transition model was developed in MS Office Excel (Microsoft, Redmond, WA) with proprietary Visual Basic scriptsCitation11. As survival data for responders and non-responders were not available, we amended utility weights for PFS to reflect the distribution of both groups within this state. The impact of AEs was included within these states and not modeled separately. Limited follow-up and censoring was addressed through parametric Weibull modeling of PFS and OSCitation12. The model cycle duration was set to 7 days. We assumed that all drug would be used without wastage, as all regimens are admixtured. Costs and outcomes were discounted at the standard 3%/annum used in US pharmaco-economic evaluations.
Efficacy
OS and PFS transition probabilities for NAB-P + GEM were calculated from the Kaplan-Meier estimates of the phase III trialsCitation3,Citation4 using a digitizing program (TechDigs 2.2 IUCr, Chester, UK). To generalize the findings from the trials and extrapolate survival beyond the data horizon, Weibull parametric modeling techniques were applied to approximate PFS and OS for NAB-P + GEM for each cycle included within the model’s time horizon. The Weibull distribution was chosen over exponential distribution based on a previous publication because of the associated values of the R2 (0.9870 for OS and 0.9858 for PFS) and residual sum of squares statistics (0.312 for OS and 0.218 for PFS)Citation13 and validation by a clinical expert. The Weibull equation for estimating survival is
where S(t) is the estimate of the survivor function at time t, λ the scale parameter, and γ the shape parameterCitation12. λ equalled 0.600 and 0.009 and γ equalled 1.323 and 1.371 for the OS and PFS curves, respectively. OS and PFS for GEM and FOLFIRINOX were estimated by applying the relevant hazard ratio (HR) on the NAB-P + GEM Weibull function for OS and PFS.
Cost inputs
Costs were expressed in 2015 US dollars (USD; $) (). Costs not in 2015 USD were inflated using the consumer price indexCitation14. In the progression-free state, where patients received study or comparator drugs, costs for the following were included: pre-medication, chemotherapy, administration of pre-medication and chemotherapy, disease monitoring and AEs. Upon progression, the model assumed that the study drugs were no longer provided, and costs included were those for basic supportive care (BSC).
Table 2. Costs and utility input estimates.
Drug costs were obtained from Red Book 2015Citation15. The cost of pre-medications was calculated according to the University of Arizona Cancer Center protocol. The cost of chemotherapy was determined assuming a mean body surface area (BSA) of 1.83 m2 and included dose adjustments that occurred during the reference studies using the relative dose intensity reported (85% for GEM, 81% for NAB-P, 75% for GEM in the NAB-P + GEM arm, 82% for fluorouracil, 81% for irinotecan, and 78% for oxaliplatin). In the base-case analysis, chemotherapy cost was calculated per milligram of chemotherapy. The median numbers of chemotherapy cycles for NAB-P + GEM and FOLFIRINOX were assumed to be four and 10, respectively, as reported in the clinical trials. The cost of drug administration and outpatient physician visit fees were per the 2015 Medicare Physician Fee Schedule using Current Procedural Terminology codesCitation16. As the protocols of the phase III clinical trials were unlikely to reflect current clinical practice, resource estimates for disease monitoring were adapted per expert opinion. We included only the cost of managing grade 3/4 AEs; grade 1/2 events were considered manageable within standard patient monitoring. AE costs were obtained from retrospective claims and published literature, including systematic reviews ()Citation17–21. Sensory neuropathy and fatigue were assumed to be managed by dose reduction only. Granulocyte colony-stimulating factor cost was assumed to be included in the cost of neutropenia and febrile neutropenia management reported in the published trials.
Health-related quality-of-life (HRQoL) utilities
HRQoL estimates based on the EuroQol (EQ-5D) and utility decrements due to adverse events were obtained from published literatureCitation22 (). The impact utility was assumed to last for 4 days. We chose the EQ-5D because of the availability of validated utilities for the US.
Sensitivity analyses
Probabilistic (PSA) and one-way sensitivity analyses (OWSA) were conducted to assess the robustness of the deterministic base-case analysis results. PSA was used to evaluate the simultaneous effect of uncertainty relating to all model parameter values and to create the cost-effectiveness acceptability curve (CEAC). This was achieved through repeated sampling of mean parameter values from a series of assigned distribution types, based on the point estimates and the standard error statistics for each average parameter value. Each set of samples from all the parameters generated a single estimate of expected costs, effects and net benefits generated by the model. The analyses were run over 2000 iterations, at which point we evaluated the impact of further simulations on the mean PSA results. The results were used to create the cost-effectiveness acceptability curve (CEAC).
Gamma distributions are constrained on an interval from zero to positive infinity and, therefore, recommended to address uncertainty in costsCitation23. Uncertainty in chemotherapy drug costs was addressed by taking into account the vial cost of all generic and branded drugs, applying a gamma distribution to the average cost per milligram, and multiplying these distributions by the BSA estimate. We also applied gamma distributions to the cost of IV administration of chemotherapy agents and to the majority of unit costs used in the estimation of the cost of managing AEs (where base-case was a non-zero cost), patient assessment and support, and BSC.
Beta distributions are indicated for presenting uncertainty in probability parameters constrained between 0–1. We applied beta distributions to the proportions of patients responding to treatment with NAB-P + GEM. Given that confidence limits for RR are calculated on a log scale, we applied log-normal distributions to the RRs of response. Beta distributions were also applied to manage uncertainty about the probability of AEs for those patients treated with NAB-P + GEM, and log-normal distributions to the ORs to derive the probability of AEs in patients treated with GEM and FOLFIRINOX.
In order to address the underlying uncertainty in the probability of a given AE, ORs were applied, where indicated, to the sampled AE relative to NAB-P + GEM. Beta distributions were applied to the HRQoL utility weights and to the disutilities for the toxicities that affect HRQoL.
Assuming that parameters are statistically independent, PSAs sample each parameter independently. However, distributions of PFS and OS times in treatments and comparators are correlated. To account for this, we included covariance matrices that allowed joint distributions to be generated for PFS and OS and used these joint distributions for the coefficients in the parametric models describing OS and PFS.
For both PFS and OS we used Weibull 2-parameter distributions that fitted well to the Kaplan-Meier empirical curves. Data regarding uncertainty in the GEM and FOLFIRINOX HRs applied to the parametric survival models were taken from the trial reports and indirect comparisons, respectively.
OWSAs were conducted on the OS and PFS HRs, NAB-P vial cost, progression-free and progressive disease utility, adverse event management costs, and oxaliplatin vial cost using the upper and the lower 95% CI values. These parameters were chosen on the basis of clinical expert recommendations.
Secondary analyses
Alternate utility values for each health state have been reported in the literatureCitation24,Citation25. We performed secondary analyses using these utilities ().
Table 3. Utility estimates used in the secondary analysis
Results
Per trial evidence, FOLFIRINOX had superior OS (HR = 0.57, 95% CI = 0.45–0.73) and PFS (HR = 0.47, 95% CI = 0.37–0.59) efficacy over GEMCitation3; and NAB-P-GEM had superior OS (HR = 0.72, 95% CI = 0.62–0.83) and PFS (HR = 0.69, 95% CI = 0.58–0.82) efficacy over GEMCitation4. Per the indirect comparison calculations, NAB-P + GEM and FOLFIRINOX had similar OS efficacy (HR = 0.79, 95% CI = 0.59–1.05), but FOLFIRINOX had superior PFS efficacy (HR = 0.68, 95% CI = 0.51–0.91).
In the base-case analysis, total cost of treatment with NAB-P + GEM was $25,965 higher and with FOLFIRINOX was $93,045 higher compared to treatment with GEM (). NAB-P + GEM was associated with an additional 0.180 LYs and 0.127 QALYs gained, and FOLFIRINOX with an additional 0.368 LYs and 0.249 QALYs gained relative to GEM. Compared to GEM, the ICER for NAB-P + GEM was $144,096, and the ICER for FOLFIRINOX was $253,162 per LY gained. The ICUR for NAB-P + GEM was $204,369 and the ICUR for FOLFIRINOX was $372,813 per QALY gained. Compared to NAB-P + GEM, FOLFIRINOX had an ICER of $358,067 per LY and an ICUR of $547,480 per QALY gained.
Table 4. Base-case and probabilistic sensitivity analysis results.
As summarized in , the PSA results confirmed base-case results. NAB-P + GEM and FOLFIRINOX were more expensive but also more effective compared to GEM alone. The ICER for NAB-P + GEM was $136,202 and the ICER for FOLFIRINOX was $252,474 per LY gained. The ICUR for NAB-P + GEM was $190,349, and the ICUR for FOLFIRINOX was $365,530 per QALY gained. Compared to NAB-P + GEM, FOLFIRINOX had an ICER of $363,470 per LY and an ICUR of $544,803 per QALY gained.
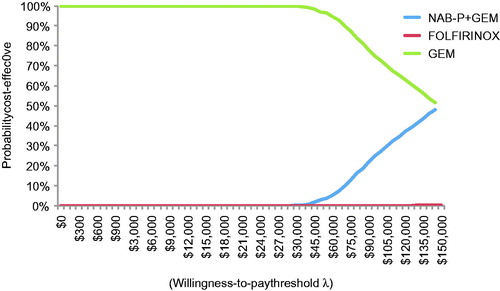
All 2000 simulation points for NAB-P + GEM vs GEM were in the upper right quadrant of the cost-effectiveness plane, but FOLFIRINOX had four points in the upper left quadrant (). Per the CEAC (), NAB-P + GEM has a probability of ∼0.25 of being cost-effective at a threshold value of $100,000/QALY. FOLFIRINOX has zero such probability at any threshold value.
Figure 2. Scatter plot of the cost-effectiveness plane generated by the probabilistic sensitivity analyses for NAB-P + GEM and FOLFIRINOX relative to GEM, and NAB-P + GEM and FOLFIRINIX relative to each other.
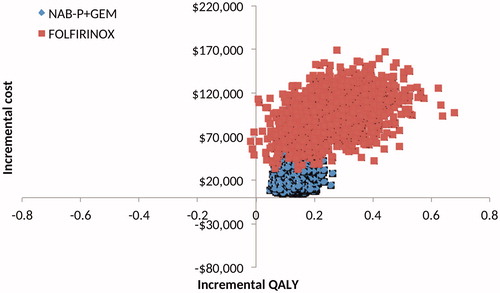
Figure 3. Cost-effectiveness acceptability curves for GEM, NAB-B + GEM and FOLFIRINOX.
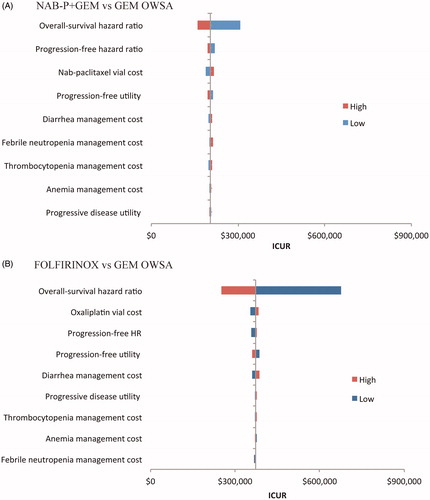
OWSA indicated that, relative to GEM and based on variation in the OS HR, the NAB-P + GEM ICUR varied between $158,812 and $307,552 () and the FOLFIRINOX ICUR between $252,410 to $676,894 per QALY gained (). The remaining eight parameters had minimal impact.
Figure 4. Tornado diagrams for the one-way sensitivity analyses for NAB-P + GEM (A) and FOLFIRINOX (B).
Secondary analyses
NAB-P + GEM and FOLFIRINOX were associated with an additional 0.15 and 0.27 QALYs gained, respectively, over GEM. The corresponding ICURs were $171,985 per QALY gained for NAB-P + GEM and $349,079 per QALY gained for FOLFIRINOX over GEM. Compared to NAB-P + GEM, treatment with FOLFIRINOX yielded an ICUR of $580,425 per QALY gained.
Probabilistic sensitivity analyses of these base-case secondary analysis results revealed that, relative to GEM therapy, NAB-P + GEM and FOLFIRINOX treatments were associated with an additional 0.15 and 0.28 additional QALYs, respectively. The corresponding ICURs were $167,112 for NAB-P + GEM and $338,476 for FOLFIRINOX per QALY gained.
Discussion
mPDA remains one of the major cancers with high cancer-related mortality rates. Even though their survival benefits remain modest, NAB-P + GEM and FOLFIRINOX represent significant advances in treatmentCitation5. Our independent economic evaluation used the method of indirect comparison to estimate treatment effects and evaluate the economic implications of GEM, FOLFIRINOX, and NAB-P + GEM. FOLFIRINOX and NAB-P + GEM were found to have a statistically similar OS benefit, with FOLFIRINOX showing a slightly better PFS benefit. Treatment with either regimen was more expensive than with GEM, yet the incremental cost of FOLFIRINOX was 3.6-times higher than that of NAB-P + GEM. With the OS benefit being statistically similar, savings of $67,080 could be achieved by treatment with NAB-P + GEM instead of FOLFIRINOX. These savings were validated by the difference in the ICERs and ICURs for FOLFIRINOX and NAB-P + GEM, which were $159,041 per LY and $188,169 per QALY gained, respectively, in favor of NAB-P + GEM. Even if FOLFIRINOX had a statistically significant better OS benefit over NAB-P + GEM, the ICER of $507,864/LY and the ICUR of $532,560/QALY gained make the incremental gains in survival unjustifiably expensive. Thus, the greater economic benefit in terms of cost-savings and incremental cost-effectiveness and cost-utility favor NAB-P + GEM therapy. Note that this analysis is for the US and should not generalized to other countries, other healthcare systems, or other healthcare financing systemsCitation10.
Three dynamics account for the economic results reported here. First, the higher febrile neutropenia rates associated with FOLFIRINOX impacted this regimen’s overall cost and the associated ICER. Likewise, the higher fatigue rates associated with FOLFIRINOX impacted utilities, therefore QALYs, and hence the observed ICURs. Second, the state-transition model underlying our economic analysis recognized the superior PFS efficacy of FOLFIRINOX over NAB-P + GEM. While, per our indirect comparison calculations, the progression-free state may have been maintained longer by FOLFIRINOX-treated than NAB-P + GEM-treated patients, this did not translate into a longer OS benefit and, thus, PFS did not materially impact the economic results. Third, the inclusion criteria for the FOLFIRINOX trialCitation3 specified an ECOG score of 0 or 1, whereas the NAB-P + GEM trialCitation4 included patients with a Karnofsky score ≥70. A Karnofsky score of 70 corresponds to an ECOG score of 2, hence there was an (albeit slight) imbalance in performance status between both studies that may have influenced efficacy and safety results.
In our recent economic evaluation for the UK of NAB-P + GEM over GEMCitation10, we did not apply thresholds to infer the economic benefit of treatments—whether the historical $50,000 or subsequent upward adjustments. Such thresholds have not been established or validated empiricallyCitation26. Neither have they been adjusted for inflation since the initial valuation of a life year at $50,000 in 1972 as part of the Medicare end-stage-renal-disease legislation or the first use of this estimate in pharmacoeconomic evaluations ∼20 years laterCitation27,Citation28. In our view, pharmacoeconomic analysis intends to inform policy and clinical practice—not set policy or guide clinical practice.
We recognize the accelerating rise in the cost of cancer treatmentsCitation29,Citation30. Although the cost of cancer care is only ∼5–6% of healthcare expendituresCitation31, it is increasing faster than any other field in medicineCitation32. The ASCO Value in Cancer Care Task Force has proposed a framework to assess the value of new cancer drugs vs current standard of care treatmentsCitation33. This framework integrates nominal and incremental clinical benefit with toxicity to determine the net health benefit, which then is juxtaposed against the cost of treatment. However, the framework emphasizes the evaluation of one novel treatment against the standard of care and will need to be adapted to accommodate situations, like the one in our analysis, where two alternate treatments have been proposed but not evaluated directly in a head-to-head trial.
The indirect comparative estimate of the survival benefits of NAB-P + GEM, FOLFIRINOX, and GEM is a secondary benefit of our study. Commenting on the Goldstein et al.Citation34 report on long-term survival in NAB-P + GEM-treated patients, Bekaii-Saab and GoldbergCitation35 suggested that “historical cross-comparisons seem to give FOLFIRINOX an edge”. Our indirect OS estimates for NAB-P + GEM and FOLFIRINOX were not statistically different, indicating relative equivalence of both regimens. Adding the lower probability of AEs, and (febrile) neutropenia in particular, NAB-P + GEM therapy yields more favorable toxicity and economic profiles while assuring similar OS outcomes. We could not use the long-term survival benefits reported by Goldstein et al.Citation28 because no parallel data were available for FOLFIRINOX.
Our analysis has limitations. The NAB-P + GEM trial did not collect HRQoL data, whereas the FOLFIRINOX study didCitation3,Citation36. Although standard pharmacoeconomic practice, we had to impute external utilities and conduct secondary analyses using different published utility estimates to complement the base case analysis. Not uncommon to this method, the Bucher indirect comparison yielded rather wide Confidence intervals (CIs)Citation37.
Conclusion
In this independent analysis for the US, the economic benefit in terms of cost-savings and incremental cost-effectiveness and cost-utility favor NAB-P + GEM over FOLFIRINOX therapy in mPDA.
Transparency
Declaration of funding
This analysis received no funding.
Declaration of financial/other relationships
The authors report no conflicts of interest. JME peer reviewers on this manuscript have no relevant financial or other relationships to disclose.
Previous presentations
The analysis was presented as a poster entitled “Optimized economic evaluation for the United States (US) of nab-paclitaxel plus gemcitabine (NAB-P + GEM), FOLFIRINOX (FFX), and gemcitabine (GEM) as first-line treatment for metastatic pancreatic cancer (mPDA)” at the American Society of Clinical Oncology Annual Meeting, Chicago, Illinois, June 3–7, 2016.
References
- American Cancer Society. Cancer Facts and Figures 2015. http://www.cancer.org/acs/groups/content/@editorial/documents/document/acspc-044552.pdf. Accessed January 2016
- Burris HA III, Moore MJ, Andersen J, et al. Improvements in survival and clinical benefit with gemcitabine as first-line therapy for patients with advanced pancreas cancer: a randomized trial. J Clin Oncol 1997;15:2403-13
- Conroy T, Desseigne F, Ychou M, et al. FOLFIRINOX versus gemcitabine for metastatic pancreatic cancer. N Engl J Med 2011;364:1817-25
- Von Hoff DD, Ervin T, Arena FP, et al. Increased survival in pancreatic cancer with nab-paclitaxel plus gemcitabine. N Engl J Med 2013;369:1691-703
- Ko AH. Progress in the treatment of metastatic pancreatic cancer and the search for next opportunities. J Clin Oncol 2015;33:1779-86
- Bucher HC, Guyatt GH, Griffith LE, et al. The results of direct and indirect treatment comparisons in meta-analysis of randomized controlled trials. J Clin Epidemiol 1997;50:683-91
- Sutton A, Ades AE, Cooper N, et al. Use of indirect and mixed treatment comparisons for technology assessment. Pharmacoeconomics 2008;26:753-67
- Glenny AM, Altman DG, Song F, et al. Indirect comparisons of competing interventions. Health Technol Assess 2005;9:1-134
- Goldstein DA, Chen Q, Ayer T, et al. First- and second-line bevacizumab in addition to chemotherapy for metastatic colorectal cancer: a United States-based cost-effectiveness analysis. J Clin Oncol 2015;33:1112-18
- Gharaibeh M, Bootman JL, McBride A, Martin J, Abraham I. Economic evaluations of first-line chemotherapy regimens for pancreatic cancer: a critical review. Pharmacoeconomics 2016; [Epub ahead of print: DOI: 10.1007/s40273-016-0452-6] Review
- Gharaibeh M, McBride A, Bootman JL, et al. Economic evaluation for the UK of nab-paclitaxel plus gemcitabine in the treatment of metastatic pancreas cancer. Br J Cancer 2015;112:1301-5
- Gray A, Clarke P, Wolstenholme J, et al. Applied methods of cost-effectiveness analysis in health care. Oxford, UK: Oxford University Press; 2011. p 61-82
- Gharaibeh M, Patel H, McBride A, et al. Weibull and exponential proportional hazard modelling for optimizing economic evaluations of cancer treatments: FOLFIRINOX (FFX) vs gemcitabine (GEM) in metastatic pancreas cancer (mPC). J Clin Oncol 2016:34(suppl; abstr e15704)
- US Department of Labor. Bureau of Labor Statistics Consumer Price Index: All urban consumers–US medical care services. http://www.bls.gov/cpi/. Accessed January 2016
- Red Book Online [subscription database online]. Greenwood Village, CO: Truven Health Analytics, Inc. Updated periodically.
- Centers for Disease Control and Prevention. 2015 Medicare physician fee schedule. http://www.cms.gov/Medicare/Medicare-Fee-for-Service-Payment/Physician FeeSched/index.html?redirect_/physicianfeesched. Accessed January 2016
- Dranitsaris G, Maroun J, Shah A. Estimating the cost of illness in colorectal cancer patients who were hospitalized for severe chemotherapy-induced diarrhea. Can J Gastroenterol 2005;19:83-7
- Liou SY, Stephens JM, Carpiuc KT, et al. Economic burden of haematological adverse effects in cancer patients: a systematic review. Clin Drug Investig 2007;27:381-96
- Cantor SB, Hudson DV Jr, Lichtiger B, et al. Costs of blood transfusion: a process-flow analysis. J Clin Oncol 1998;16:2364-70
- Schilling MB, Parks C, Deeter RG. Costs and outcomes associated with hospitalized cancer patients with neutropenic complications: A retrospective study. Exp Ther Med 2011;2:859-66
- Wang SJ, Fuller CD, Choi M, et al. A cost-effectiveness analysis of adjuvant chemoradiotherapy for resected gastric cancer. Gastrointest Cancer Res 2008;2:57-63
- Tam VC, Ko YJ, Mittmann N, et al. Cost-effectiveness of systemic therapies for metastatic pancreatic cancer. Curr Oncol 2013;20:e90-e106
- Briggs A, Claxton K, Sculpher M. Decision modelling for health economic evaluation. New York, NY: Oxford University Press; 2011. p 77-120
- Romanus D, Kindler HL, Archer L, et al. Does health-related quality of life improve for advanced pancreatic cancer patients who respond to gemcitabine? Analysis of a randomized phase III trial of the cancer and leukemia group B (CALGB 80303). J Pain Symptom Manage 2012;43:205-17
- Cooper NJ, Abrams KR, Sutton AJ, et al. A Bayesian approach to Markov modelling in cost-effectiveness analyses: application to taxane use in advanced breast cancer. J Roy Statist Soc A 2003;166:389-405
- Abraham I, Harrington AR, Bootman JL. The QALY controversy in the United States. Invited presentation at the EU Special Conference ??Health Outcomes in Europe: the QALY controversy. New European Guidelines in Cost-Effectiveness Assessment??. Brussels, Belgium 2013. Available at: http://www.echoutcome.eu/images/stories/Abraham_QALY_Controversy_in_US.pdf. Accessed: 25 January 2016.
- Holtgrave DR, Qualls NL. Threshold analysis and programs for prevention of HIV infection. Med Decis Making 1995;15:311-17
- Schulman KA, Lynn LA, Glick HA, et al. Cost effectiveness of low-dose zidovudine therapy for asymptomatic patients with human immunodeficiency virus (HIV) infection. Ann Intern Med 1991;114:798-802
- Mariotto AB, Yabroff KR, Shao Y, et al. Projections of the cost of cancer care in the United States: 2010–2020. J Natl Cancer Inst 2011;103:117-28
- Abraham I, McBride A, MacDonald K. Arguing (about) the value of cancer care. J Natl Compr Canc Netw 2016;14:1487-9
- Tangka FK, Trogdon JG, Richardson LC, et al. Cancer treatment cost in the United States: has the burden shifted over time? Cancer 2010;116:3477-84
- National Cancer Institute. Cancer Trends Progress Report–2011/2012 Update. Available at: http://progressreport.cancer.gov. Accessed: January 2016.
- Schnipper LE, Davidson NE, Wollins DS, et al. American Society of Clinical Oncology statement: a conceptual framework to assess the value of cancer treatment options. J Clin Oncol 2015;33:2563-77
- Goldstein D, El-Maraghi RH, Hammel P, et al. nab-Paclitaxel plus gemcitabine for metastatic pancreatic cancer: long-term survival from a phase III trial. J Natl Cancer Inst 2015;107;pii:dju413
- Bekaii-Saab T, Goldberg R. Therapeutic advances in pancreatic cancer: miles to go before we sleep. J Natl Cancer Inst 2015;107;pii:dju439
- Gourgou-Bourgade S, Bascoul-Mollevi C, Desseigne F, et al. Impact of FOLFIRINOX compared with gemcitabine on quality of life in patients with metastatic pancreatic cancer: results from the PRODIGE 4/ACCORD 11 randomized trial. J Clin Oncol 2013;31:23-9
- Mills EJ, Ghement I, O’Regan C, et al. Estimating the power of indirect comparisons: a simulation study. PLoS One 2011;6:e16237