
Abstract
Background: Advanced neuroendocrine tumors (NETs) are a rare malignancy with considerable need for effective therapies. Everolimus is a mammalian target of rapamycin (mTOR) inhibitor approved by the US Food and Drug Administration (FDA) and European Medicines Agency (EMA) in 2016 for treatment of adults with progressive, well-differentiated, non-functional NETs of gastrointestinal (GI) or lung origin that are unresectable, locally advanced, or metastatic.
Objective: To assess the 3-year budget impact for a typical US health plan following availability of everolimus for treatment of GI and lung NETs.
Methods An economic model was developed that considered two perspectives: an entire health plan and a pharmacy budget. The total budget impact included costs of drug therapies, administration, hospitalizations, physician visits, monitoring, and adverse events (AEs). The pharmacy model only considered drug costs.
Results: In a US health plan with 1 million members, the model estimated 66 patients with well-differentiated, non-functional, and advanced or metastatic GI NETs and 20 with lung NETs undergoing treatment each year. Total budget impact in the first through third year after FDA approval ranged from $0.0568–$0.1443 per member per month (PMPM) for GI NETs and from $0.0181–$0.0355 PMPM for lung NETs. The total budget impact was lower than the pharmacy budget impact because it included cost offsets from administration and AE management for everolimus compared with alternative therapies (e.g. chemotherapies).
Limitations: Because GI and lung NETs are rare diseases with limited published data, several assumptions were made that may influence interpretation of results.
Conclusions: The budget impact for everolimus was minimal in this rare disease area with a high unmet need, largely due to low disease prevalence. These results should be considered in the context of significant clinical benefits potentially provided by everolimus, including significantly longer progression-free survival (PFS) for advanced GI and lung NET patients.
Introduction
Advanced NETs are a rare malignancy, with an estimated prevalence for GI and lung NETs of 35.29 and 9.69 per 100,000, accounting for 73.5% and 20.2% of all NETs, respectively, based on a recent analysis of Surveillance, Epidemiology, and End Results (SEER) dataCitation1. Many NETs are not diagnosed until late stages of the disease when mass effects, distant metastases, or both become apparentCitation2. In general, NETs are diagnosed when they are functionally active and secrete hormones that lead to clinical symptoms, which can vary depending on the origin of the NETCitation3. Some functional NETs can lead to diarrhea, flushing, hypotension, bronchoconstriction, and cardiac disease; a collection of symptoms commonly referred to as carcinoid syndromeCitation3. Non-functioning tumors tend to be more aggressive than functioning tumors and are not associated with detectable symptoms caused by hormones (although undetectable hormones may be secreted)Citation3. They are often diagnosed in the late stages of the diseaseCitation3 when they produce local symptoms as they grow, such as obstruction of the bile duct or bowel, perforation, or bleeding in the GI tract, or when they have metastasizedCitation4.
Advanced NETs are also associated with substantial resource utilization. In a survey of US physicians who treated patients with GI/lung NETs (n = 70), resource utilization was found to be higher for patients with advanced NET with progressive disease compared with those without progressionCitation5. In particular, the proportion of patient hospitalizations increased from 33.8% for patients with advanced NETs without progression to 39.6% for those with progressionCitation5. A separate analysis of a US administrative claims database that assessed long-term resource utilization and healthcare cost of NETs found that the costs of total healthcare, inpatient stays, outpatient care, and pharmacy claims increased after patients were diagnosed with NETsCitation6. The analysis examined patients on medical therapy (n = 625) and showed that the total monthly healthcare costs increased from $5,630 in the pre-diagnosis period to $9,093 during the 1-year period after NET diagnosisCitation6. As observed in these studies, resource utilization increases with a NET diagnosis and further increases upon NET disease progression.
Currently, treatment options are limited for patients with NETs of GI or lung origin. There are very few FDA-approved agents in this disease area—everolimus is the only FDA-approved agent in lung NETs, and everolimus and lanreotide are the only FDA-approved agents in GI NETsCitation7,Citation8. Furthermore, the National Comprehensive Cancer Network (NCCN) Clinical Practice Guidelines in Oncology (NCCN Guidelines) for Neuroendocrine Tumors (v.2.2016) recommend octreotide or lanreotide, everolimus, cytoreductive surgery, or cytotoxic chemotherapy as treatment options for patients who experience clinically significant disease progression with locoregional unresectable disease and/or distant metastases of NETs of the GI tract, lung, or thymusCitation9. Additionally, NCCN Guidelines for Small Cell Lung Cancer (v.1.2016) recommend sunitinib as a treatment option for low- or intermediate-grade lung NETsCitation10.
Everolimus is an mTOR inhibitor approved by both the FDA and the EMA in 2016 for the treatment of adults with progressive, well-differentiated, non-functional NETs of GI or lung origin that are unresectable, locally advanced, or metastaticCitation7. Everolimus received regulatory approval based on the results of a pivotal Phase III, multi-center, double-blind, placebo-controlled study (RADIANT-4), in which patients with advanced low- or intermediate-grade, non-functional NETs of GI or lung origin were randomized to receive everolimus 10 mg/day orally plus best supportive care (BSC; n = 205) or placebo plus BSC (n = 97). Patients who received everolimus experienced extended PFS per central radiological review compared with those who received placebo (11.0 months vs 3.9 months). Treatment with everolimus was also associated with a 52% reduction in the risk of disease progression or death (hazard ratio =0.48, p < .000,01). The most common drug-related grade 3/4 AEs in the everolimus group were stomatitis, diarrhea, and infectionsCitation7.
The objective of the present study was to assess the 3-year budget impact of everolimus on a US managed care health plan following everolimus availability for treatment of GI and lung NETs.
Methods
Model design
This study assessed the budget impact of everolimus availability from two perspectives. The first perspective evaluated the total budget impact on a US managed care health plan, including the costs of drug therapies and other costs for treatment, administration, hospitalizations, physician visits, monitoring, and management of AEs. The second perspective, that of the pharmacy budget, included only drug therapy costs. The budget impact of everolimus was calculated as the incremental budget impact of adding everolimus to the existing treatment options for GI or lung NET patients. Model outcomes included estimates of annual total treatment costs for each of the first 3 years of everolimus availability for GI or lung NETs, as well as the total annual cost over the entire 3-year period. All costs were inflated to US dollars as of February 2016 using the monthly Consumer Price IndexCitation11. Due to the short time horizon, post-2016 inflation was not included. There was no discounting in the model per recommendations from the ISPOR 2012 Budget Impact Analysis Good Practice II Task ForceCitation12. The model was built in Excel 2010 (Microsoft Redmond, WA).
Patient population
The model calculates the economic impact of everolimus availability on a health plan with 1 million covered lives. An estimate of the prevalence of GI and lung NETs was used to determine the size of the expected patient population for each disease. The target population considered in the model is patients with advanced/metastatic, well-differentiated, non-functional NETs of GI or lung origin who are eligible for drug treatment. The total number of plan members with GI or lung NETs is based on recent estimates of the prevalence of the diseases from the SEER databaseCitation1. The prevalence of GI NETs is calculated as the sum of the estimated prevalence rates for stomach, small intestine, cecum, appendix, colon, rectum, liver, and other/unknown NETs, and is estimated to be 35.29 per 100,000. The prevalence of lung NETs is estimated to be 9.69 per 100,000. It is assumed that all NET patients in the population have been diagnosed. Prevalence estimates are based on the primary site of tumor origin, so no overlap between GI and lung NET patients is assumed.
Precise estimates of the overall proportion of GI or lung NET patients with progressive tumors are not available in published literature, so the model conservatively assumes that all advanced/metastatic patients have progressive disease. If only a portion of all advanced/metastatic patients have progressive disease, then fewer patients would ultimately be eligible for treatment with everolimus and the incremental budget impact of everolimus would be lower. The sensitivity analysis conducted for this model varies the number of patients eligible for treatment by ±10%.
Estimates of GI or lung NET patients with unresectable or locally advanced disease are also not available. Of all GI NET patients, 43.2% are expected to have advanced disease, based on the proportion of GI NET patients presenting with advanced/metastatic disease at diagnosisCitation13. Available literature estimating the proportion of lung NET patients presenting with advanced/metastatic disease is very limited, and it was conservatively assumed that the proportion of lung NET patients is the same as for GI NETs. One retrospective review of 300 lung NET patients from three centers (1990–2012) reported that 29 patients (9.7%) presented with metastatic diseaseCitation14.
Based on a published study reporting the proportion of carcinoid NET patients with carcinoid syndrome, 72% of GI and lung NET patients are expected to have non-functional diseaseCitation15. Earlier studies estimated that 10–15% of diagnosed GI NET casesCitation4 and less than 5% of bronchopulmonary NETs exhibit hormonally-related symptoms such as carcinoid syndrome, which are typically associated with functional diseaseCitation16.
The proportion of patients with well-differentiated GI NETs is estimated at 66.8% based on the proportion of midgut NET patients with Grade 1 or Grade 2 tumors in a single-center retrospective studyCitation17. Midgut NETs were selected as representative of GI NETs as a whole because they were the most common anatomical tumor site (45%). Other GI NET types reported in this study included appendiceal (7%; Grade 1: 87.9% and Grade 2: 2%), gastric (6.9%; grade not reported), and hindgut (5.4%; grade not reported). The proportion of patients with well-differentiated lung NETs is estimated at 73.5% based on the proportion of bronchial NET patients with Grade 1 or Grade 2 tumors reported in the same study.
Conservatively, 90% of GI and lung NET patients are assumed to be eligible for drug treatment, based on factors including performance status and co-morbid disease. A patient flow chart illustrates the selection of patients included in the analysis (). Default inputs and assumptions are presented in . The size of the covered population and other model inputs may be modified by the user based on varying plan population or other assumptions.
Figure 1. Patient flow for GI and lung NET treatment. Patient counts are based on a hypothetical health plan with 1 million members.
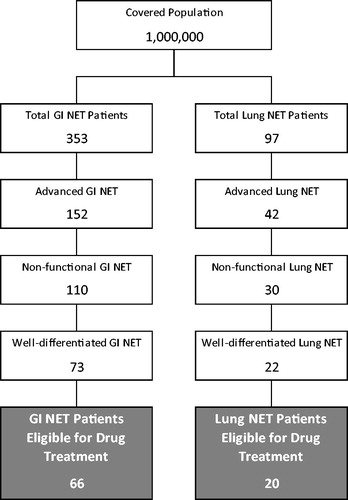
Table 1. Treatment-eligible patient population estimates.
Market shares
Market shares provide a distribution of treatment options in a market with and without everolimus availability for treatment of GI and lung NETs applied to the eligible patient population. In the scenario without everolimus entry, shares are static across the 3-year horizon. In the scenario with everolimus entry, market share changes reflect the uptake of everolimus with peak share in the third year after commercial availability. Specific estimates of market shares for currently available GI and lung NET therapies are not available. Market shares for agents recommended by NCCN Guidelines are derived from recently reported treatment utilization ratesCitation5,Citation9,Citation10. Although interferon (IFN)-α-2b is recommended by NCCN Guidelines, resource utilization data for IFN-α-2b is not available, so it is not included in the model. In real-world clinical practice, other agents may also be used at low utilization rates, but these are not included in the model. Market shares are available only by drug class, and are assumed to be evenly split among agents within each class. Combination use of 5-fluorouracil and streptozocinCitation18, as well as capecitabine and oxaliplatinCitation19, is based on published clinical trials cited in NCCN GuidelinesCitation9. Market shares add up to more than 100% due to expected combination use of somatostatin analogs (SSAs) with other agents, but a specific breakdown of combination use is not reported.
Everolimus market share is based on NET forecast assumptions for 2016Citation20, and is assumed to grow by 10% each year. Everolimus is not expected to take any share from SSAs, and is expected to take shares from all chemotherapy agents in equal proportion, except for sunitinib in lung NETs in 2016, when everolimus is assumed to take half of sunitinib’s share. Estimated market shares for each treatment option for GI and lung NETs, in the scenario with everolimus entry, for each of the 3 years included in the model are presented in Supplementary Tables A1 and A2, respectively.
Treatment costs
Drug cost is calculated as the product of the total expected amount of drug consumed each year based on prescribing information recommendations or the dosing used in clinical trials and the cost per unit. Patients are assumed to receive Sandostatin LAR Depot for the entire duration of treatment, and induction with octreotide acetate is not included. For oral (everolimus, sunitinib, capecitabine, and temozolomide) and injected (octreotide LAR and lanreotide) therapies, the wholesale acquisition cost (WAC)Citation21 with the most recent effective date as of April 19, 2016 is used for the dosage strength that most closely matches, but does not exceed, the dose listed in the prescribing information or clinical trial publication. For intravenous therapies (5-fluorouracil, streptozocin, oxaliplatin, dacarbazine, cisplatin, and etoposide), the WACCitation21 with the most recent effective date as of April 19, 2016 is used, regardless of vial size, assuming an average body surface area of 1.7 m2 Citation22. The WACCitation21 with the most recent effective date as of April 19, 2016 for the oral formulation of temozolomide 100 mg strength is for the branded version of the drug, and a generic form of this drug may be also available at a lower WAC. Patients are assumed to begin treatment at the beginning of the year and to remain on treatment for 40 weeks, which was the median duration of exposure in the everolimus arm of the RADIANT-4 trialCitation7. Patients are assumed to be 100% compliant to drug regimens. More detail regarding the calculation of the total drug cost for each treatment option in the model for GI and lung NETs is presented in Supplementary Tables A3 and A4, respectively.
Everolimus, sunitinib, capecitabine, and temozolomide are assumed to be administered orally and do not incur administration costs. Injected and infused therapies are assumed to be administered by a healthcare professional. Cisplatin and etoposide are assumed to be administered in the same infusionCitation23. The inputs for calculating administration costs for subcutaneous or intramuscular and infused therapies are presented in Supplementary Tables A5 and A6, respectively.
Adverse event management costs
The model accounted for only the key treatment-emergent grade 3 or 4 AEs that are most common (> 5% of patients). The AE rates were derived from prescribing information if available, or clinical trial publications. Grade 3/4 treatment-related AEs reported in the prescribing information for everolimus with incidence >5% include diarrhea, infections, and stomatitisCitation7. The prescribing information for sunitinib reports grade 3/4 AEs occurring in >5% of sunitinib-treated patients with pancreatic NETs and occurring more commonly than in placebo-treated patients, which include hand-foot syndrome, hypertension, and stomatitisCitation24. The only severe adverse reaction occurring in >5% of lanreotide-treated patients and occurring more commonly than in placebo-treated patients reported in the prescribing information for lanreotide is abdominal painCitation8. For octreotide LAR, no grade 3 or higher AEs are reported in the prescribing information based on a trial in patients with carcinoid tumors, consistent with other studies of octreotide in patients with NETsCitation25–27. The most common grade 3 or 4 AEs reported in clinical trial publications for cytotoxic chemotherapy regimens include hematologic AEs, vomiting, and fatigue/asthenia. Estimated AE rates for everolimus and comparator therapies are presented in Supplementary Table A7.
Grade 3 AE management costs are derived from averaging inpatient and outpatient costs reported in published literatureCitation28–35. Grade 4 AE management costs consist solely of inpatient costs. If only aggregated grade 3 and grade 4 incidence rates are reported, it is assumed that 95% of the reported AEs are grade 3 events (e.g. for a combined rate of 20%, grade 3 incidence will be assumed to be 19% and grade 4 incidence will be assumed to be 1%). Bundled costs associated with grade 3/4 asthenia, abdominal pain, diarrhea, and fatigueCitation28 are allocated among inpatient and outpatient costs based on the average proportion for other AEs considered in the model. The assumptions underlying the calculation of AE management costs for treatment options included in the model are presented in Supplementary Table A7.
Resource utilization and costs
Data on healthcare resource utilization rates, including hospitalizations, imaging, and monitoring, is derived from published literatureCitation5 as the proportion of GI or lung NET patients utilizing a resource at least once at any stage of their disease. For patients who utilize a specific resource at least once during the course of their treatment, the precise frequency of utilization is not available, so each resource is assumed to be utilized once during treatment. This approach is used due to the lack of available data on resource use frequency in published literature, but the frequency of utilization for each resource can be modified by the user in the Excel model. Only a fraction of the reported rates for hospitalizations and physician visits are included to avoid double-counting resource use associated with AE management and chemotherapy administration, which are estimated separately. In the base case scenario, the attributable proportions of hospitalizations and physician visits are assumed to be 50% each, but these inputs can also be modified by the user in the Excel model. Unit costs are derived from averaging the costs associated with relevant codes for each resource use category, including International Classification of Diseases, Ninth Revision (ICD-9) diagnosis codes for hospitalizationsCitation35 and Current Procedural Terminology (CPT) codes for other proceduresCitation9,Citation32,Citation36. Costs associated with healthcare resource utilization are assumed to be the same, regardless of therapy, and are not expected to be affected by the availability of everolimus for treatment of GI or lung NETs. Supporting calculations of resource utilization costs for treatment options included in the model for GI and lung NETs are presented in Supplementary Tables A8 and A9, respectively.
Results
Total cost of treatment
The total costs for each treatment option comprise costs related to treating GI or lung NETs and are presented in . Additional details regarding the calculation of these costs are presented in Supplementary Tables A3–A9. As an orally-administered therapy, everolimus does not incur any administration cost, which is non-zero for injected and infused therapies. Additionally, the expected annual AE management costs associated with everolimus treatment ($1,138) are lower than those for some cytotoxic chemotherapies. For example, the annual costs associated with AEs for other treatment options range from $0 (octreotide LAR) to $3,326 (5-fluorouracil plus streptozocin for GI NETs) and $19,982 (cisplatin plus etoposide for lung NETs).
Table 2. GI and lung NET budget impact model: total costs.
Total budget impact
The budget impact associated with the introduction of everolimus for the treatment of GI or lung NETs is calculated as the difference between the total cost to the health plan of treating GI or lung NETs with and without everolimus included in the health plan formulary. With an anticipated increase in drug costs and reductions in costs of drug administration and AE management, the overall health plan budget is expected to increase following the introduction of everolimus (see , and ).
Figure 2. GI NET budget impact model: budget impact with and without the introduction of everolimus.
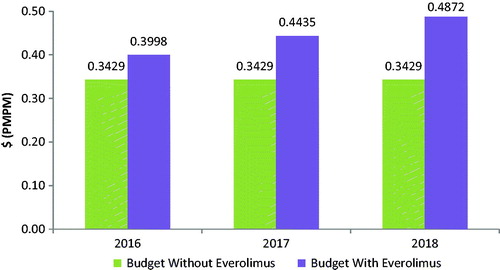
Figure 3. Lung NET budget impact model: budget impact with and without the introduction of everolimus.
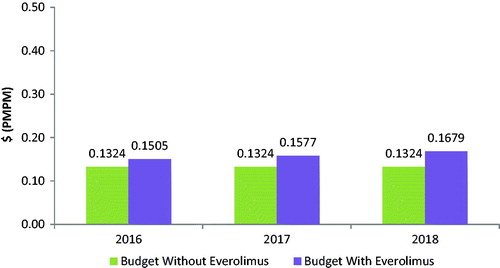
Table 3. GI and lung NET budget impact model: summary of results.
Based on a covered population of 1 million members, the expected total difference in the budget for GI NETs for the entire US managed care health plan is $681,962 in the first year, $1,206,549 in the second year, and $1,731,135 in the third year. On a PMPM basis, the estimated budget impact for GI NETs on a health plan with 1 million covered lives is 5.68 cents ($0.0568) in the first year, increasing to 10.05 cents ($0.1005) in the second year, and 14.43 cents ($0.1443) in the third year. The expected total difference in the budget for lung NETs for the entire US managed care health plan is $216,880 in the first year, $303,296 in the second year, and $425,995 in the third year. On a PMPM basis, the estimated budget impact for lung NETs on a health plan with 1 million covered lives is 1.81 cents ($0.0181) in the first year, increasing to 2.53 cents ($0.0253) in the second year, and 3.55 cents ($0.0355) in the third year.
Pharmacy budget impact
The estimated pharmacy budget impact of everolimus in GI NETs is 6.06 cents ($0.0606) in the first year, 10.72 cents ($0.1072) in the second year, and 15.38 cents ($0.1538) in the third year after launch on a PMPM basis (see and ). The estimated pharmacy budget impact of everolimus in lung NETs is 2.04 cents ($0.0204) in the first year, 2.85 cents ($0.0285) in the second year, and 3.96 cents ($0.0396) in the third year after launch on a PMPM basis (see and ).
Figure 4. GI NET pharmacy model: budget impact with and without the introduction of everolimus.
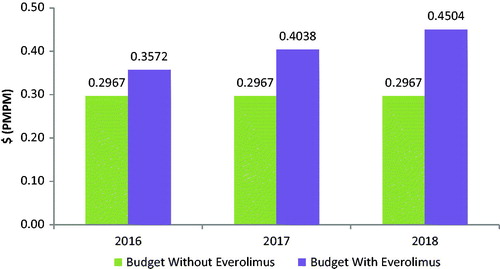
Figure 5. Lung NET pharmacy model: budget impact with and without the introduction of everolimus.
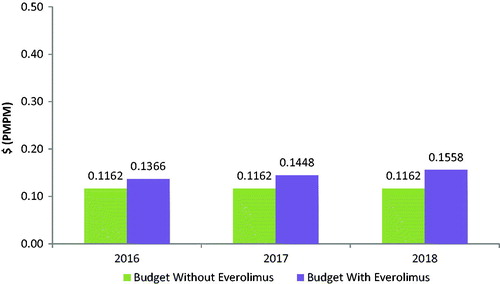
Table 4. GI and lung NET pharmacy model: results.
Sensitivity analysis
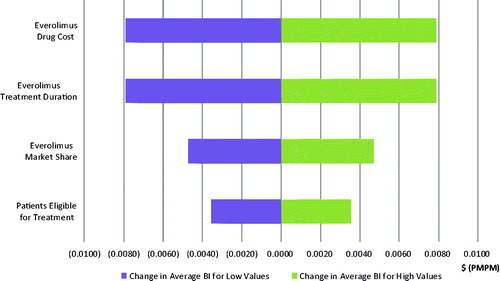
Four model parameters are closely examined in a one-way sensitivity analysis: (1) everolimus annual drug cost, (2) everolimus treatment duration, (3) patients eligible for treatment, and (4) everolimus market share. By varying parameters by ±10%, the most significant impact is caused by everolimus’ drug price and treatment duration, which are expected to alter the budget impact by a magnitude of 2.04 cents PMPM and 0.79 cents PMPM in the third year after launch for GI and lung NET, respectively. The results of the sensitivity analysis of the budget impact in the third year are presented in tornado diagrams in and for GI and lung NET, respectively.
Figure 6. GI NET budget impact model: sensitivity analysis.
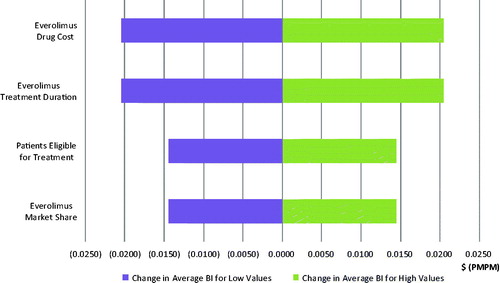
Figure 7. Lung NET budget impact model: sensitivity analysis.
Discussion
This study estimated the 3-year budget impact of everolimus on a US managed care health plan following everolimus availability for treatment of GI and lung NETs, from the perspective of both the entire health plan and also only the pharmacy budget. Despite substantial uncertainty surrounding some of the inputs for these rare malignancies, the main finding of a minimal budget impact associated with the introduction of everolimus is consistent with the small patient population for GI and lung NETs.
As can be expected when studying a rare disease, this analysis was limited by the scarcity of published evidence that is specific to patients with GI or lung NETs; however, a systematic literature review was not conducted to support this study. The area most impacted by this lack of evidence was the estimation of the eligible patient population. The prevalence of GI and lung NET has steadily grown over the past two decades, increasing 8-fold between 1993–2012Citation1. This trend may be partially attributed to improved survival for NETs, especially for metastatic GI NETs, reflecting the availability of more efficacious treatment options for these patientsCitation37. Using previously published lower estimates of GI and lung NET prevalenceCitation13,Citation38,Citation39 would reduce the PMPM budget impact estimates to 3.53 cents, 6.25 cents, and 8.96 cents in the first, second, and third year, respectively, for GI NETs, and to 1.72 cents, 2.40 cents, and 3.37 cents in the first, second, and third year, respectively, for lung NETs.
Although the model uses the most recently available SEER data that report the prevalence of GI and lung NETsCitation1, these prevalence estimates do not accurately capture the specific patient population eligible for treatment with everolimus, which is limited to adults with progressive, well-differentiated, non-functional NETs of GI or lung origin that are unresectable, locally advanced, or metastatic. Estimates of GI or lung NET patients with progressive tumors are not available in published literature, and the model assumes that all advanced/metastatic patients have progressive disease. Estimates of GI or lung NET patients with unresectable or locally advanced disease are also not available. Therefore, the model target population includes patients with advanced/metastatic, non-functional, well-differentiated NETs of GI or lung origin. Specific estimates of the proportion of lung NET patients with advanced disease are not available, and it was assumed to be the same as for GI NET patients. Finally, a more conservative assumption would be that 100% of patients are treatable rather than 90%, which was assumed based on the expectation that not all patients will have sufficient performance status or otherwise be expected to benefit from treatment. In this manner, the model would be over-estimating the number of patients eligible for drug treatment and estimating the maximum budget impact, which would be similar to the high end of the sensitivity analysis results for the parameter of GI and lung NET patients eligible for treatment presented in and , respectively.
Another area substantially impacted by a lack of evidence is the estimation of treatment market shares and treatment duration. Specific estimates of market shares for currently available GI and lung NET therapies are not available, and market shares for agents recommended by NCCN Guidelines are derived from recently reported treatment utilization ratesCitation5,Citation9,Citation10, which may under- or over-estimate the actual utilization. Although IFN-α-2b is recommended by NCCN Guidelines, resource utilization data for IFN-α-2b is not available, so it is not included in the model. In real-world clinical practice, other agents may also be used at low utilization rates, but these are not included in the model. Additionally, market shares are available only by drug class, and are assumed to be evenly split among agents within each class. The duration of treatment in GI and lung NETs for each therapy is also not available and is assumed to be 40 weeks for all therapies, which was the median duration of exposure in the everolimus arm of the RADIANT-4 trialCitation7. Treatments that are more tolerable and efficacious, such as everolimus, would be expected to have a longer duration of treatment compared to cytotoxic chemotherapies, which would imply that the model could under-estimate the budget impact of everolimus under current assumptions.
Additional research is also needed to establish better estimates of healthcare resource utilization by GI and lung NET patients. Specific estimates of healthcare resource utilization associated with each therapy were not available, and model assumptions may under- or over-estimate the actual utilization. The frequency of healthcare resource utilization for each type of resource is not available in published literature, so the model assumed that for the patients who utilize a specific resource at least once during the course of their treatment, each resource is utilized only once per individual, although it may be possible for patients to utilize a healthcare resource multiple times. Additionally, the sources used for AE rates for various treatments often included patients with carcinoid syndrome in the patient population, which is inconsistent with the target population for this model. Finally, these results are relevant for US managed care health plans and not necessarily generalizable to other countries or health systems.
Conclusion
Based on the most recent SEER registry data, among the 66 GI NET patients in a 1 million member health plan, the total budget impact of adding everolimus to the formulary on a PMPM basis is 5.68 cents, 10.05 cents, and 14.43 cents in the first, second, and third year, respectively. The estimated pharmacy budget impact of everolimus in GI NET is 6.06 cents PMPM, 10.72 cents, and 15.38 cents in the first, second, and third year, respectively. Among the 20 lung NET patients in a 1 million member health plan, the total budget impact of adding everolimus to formulary on a PMPM basis is 1.81 cents, 2.53 cents, and 3.55 cents in the first, second, and third year, respectively. The estimated pharmacy budget impact of everolimus in lung NET is 2.04 cents PMPM, 2.85 cents, and 3.96 cents in the first, second, and third year, respectively.
The budget impact associated with the introduction of everolimus was shown to be minimal. The total budget impact is expected to be lower than the pharmacy budget impact because it includes cost offsets from administration and AE management for everolimus compared with alternative therapies (e.g. chemotherapies, etc.). According to the most recent SEER data, the number of patients with GI and lung NETs increased 8-fold in the past two decades. The increased size of this population deserves greater attention from health plans to appropriately manage these patients by increasing the access to clinically proven treatments for patients. Further investigation should also be considered in the context of significant clinical benefits that may be provided by everolimus, including significantly longer PFS for advanced GI and lung NET patients. This benefit is particularly meaningful for lung NET patients, who do not have other available treatment options.
Transparency
Declaration of funding
This research was sponsored by Novartis Pharmaceuticals Corporation.
Declaration of financial/other interests
DBR and DN are employees of Analysis Group and have disclosed receiving consulting fees from Novartis Pharmaceuticals Corporation. MPN and BC have disclosed that they are employees of Novartis Pharmaceuticals Corporation. JME peer reviewers on this manuscript have no relevant financial or other relationships to disclose.
Previous presentations
A portion of this research was previously presented as a poster at the Academy of Managed Care Pharmacy (AMCP) Nexus conference, October 2016, National Harbor, MD.
Supplementary_Material.docx
Download MS Word (50 KB)Acknowledgments
The authors wish to thank Melissa Tanios, Kris Grzegorzewski, Jocelyn Lau, Connor Scherer, and Christina Wang for their assistance with this research and with the development of this manuscript.
Related Research Data
References
- Shen C. Incidence and prevalence of neuroendocrine tumors in the United States 1973-2012. Poster session presented at: North American Neuroendocrine Tumor Society (NANETS) Annual Symposium; 2016 Sep 30; Jackson Hole, WY
- Modlin IM, Oberg K, Chung DC, et al. Gastroenteropancreatic neuroendocrine tumours. Lancet Oncol 2008;9:61-72
- Barakat M, Meeran K, Bloom S. Neuroendocrine tumours. Endocr Relat Cancer 2004;11:1-18
- Modlin IM, Moss SF, Oberg K, et al. Gastrointestinal neuroendocrine (carcinoid) tumours: current diagnosis and management. Med J Aust 2010;193:46-52
- Strosberg J, Casciano R, Stern L, et al. United States-based practice patterns and resource utilization in advanced neuroendocrine tumor treatment. World J Gastroenterol 2013;19:2348
- Chuang C-C, Bhurke S, Chen S-Y, et al. Clinical characteristics, treatment patterns, and economic burden in patients treated for neuroendocrine tumors in the United States: a retrospective cohort study. J Med Econ 2015;18:126-36
- Afinitor (everolimus) tablets for oral administration [prescribing information]. East Hanover, NJ: Novartis Pharmaceuticals Corp, 2016
- Somatuline Depot (lanreotide) injection [prescribing information]. Basking Ridge, NJ: Ipsen Biopharmaceuticals, Inc., 2014
- Referenced with permission from the NCCN Clinical Practice Guidelines in Oncology (NCCN Guidelines®) for Neuroendocrine Tumors V.2.2016. National Comprehensive Cancer Network, Inc., 2016. All rights reserved. Accessed May 27, 2016. To view the most recent and complete version of the guideline, go to NCCN.org. NATIONAL COMPREHENSIVE CANCER NETWORK®, NCCN®, NCCN GUIDELINES®, and all other NCCN Content are trademarks owned by the National Comprehensive Cancer Network, Inc. 2016
- Referenced with permission from the NCCN Clinical Practice Guidelines in Oncology (NCCN Guidelines®) for Small Cell Lung Cancer V.1.2016. National Comprehensive Cancer Network, Inc., 2016. All rights reserved. Accessed June 30, 2016. To view the most recent and complete version of the guideline, go to NCCN.org. NATIONAL COMPREHENSIVE CANCER NETWORK®, NCCN®, NCCN GUIDELINES®, and all other NCCN Content are trademarks owned by the National Comprehensive Cancer Network, Inc. 2016
- Bureau of Labor Statistics. Washington, DC: US Department of Labor. Consumer Price Index (CPI), 2016. http://www.bls.gov/cpi/. Accessed March 24, 2016
- Sullivan SD, Mauskopf JA, Augustovski F, et al. Budget impact analysis—principles of good practice: report of the ISPOR 2012 Budget Impact Analysis Good Practice II Task Force. Value Health 2014;17:5-14
- Mocellin S, Nitti D. Gastrointestinal carcinoid: epidemiological and survival evidence from a large population-based study (n = 25,531). Ann Oncol 2013;24:3040-4
- Chong C, Wirth L, Nishino M, et al. Chemotherapy for locally advanced and metastatic pulmonary carcinoid tumors. Lung Cancer 2014;86:241-6
- Choti MA, Bobiak S, Strosberg JR, et al. Prevalence of functional tumors in neuroendocrine carcinoma: an analysis from the NCCN NET database. J Clin Oncol 2012;30:(Suppl; abstr 4126)
- Gustafsson B, Kidd M, Chan A, et al. Bronchopulmonary neuroendocrine tumors. Cancer 2008;113:5-21
- Yalchin M, Garcia-Hernandez J, Mullan M, et al. Epidemiological characteristics from a single centre database cohort of 1301 neuroendocrine tumour patients: is there an association between age and grade of NET? Gasteroentrology 2015;148:S-936
- Sun W, Lipsitz S, Catalano P, et al. Phase II/III study of doxorubicin with fluorouracil compared with streptozocin with fluorouracil or dacarbazine in the treatment of advanced carcinoid tumors: Eastern Cooperative Oncology Group Study E1281. J Clin Oncol 2005;23:4897-904
- Bajetta E, Catena L, Procopio G, et al. Are capecitabine and oxaliplatin (XELOX) suitable treatments for progressing low-grade and high-grade neuroendocrine tumours? Cancer Chemother Pharmacol 2007;59:637-42
- Afinitor (everolimus) NET forecast. East Hanover, NJ: Novartis Pharmaceuticals Corp (data on file). 2016
- RedBook ReadyPrice Online®. Ann Arbor, MI: Truven Health Analytics Inc., 2016. http://www.micromedexsolutions.com/micromedex2/librarian/. Accessed April 19, 2016
- Ramsey S, Shankaran V. Managing the financial impact of cancer treatment: the role of clinical practice guidelines. J Natl Compr Canc Netw 2012;10:1037-42
- Moertel CG, Kvols LK, O’Connell MJ, et al. Treatment of neuroendocrine carcinomas with combined etoposide and cisplatin. Cancer 1991;68:227-32
- Sutent (sunitinib malate) capsules, oral [prescribing information]. New York, NY: Pfizer, Inc., 2015
- Sandostatin LAR Depot (octreotide) injection [prescribing information]. East Hanover, NJ: Novartis Pharmaceuticals Corp, 2014
- Pavel ME, Hainsworth JD, Baudin E, et al. Everolimus plus octreotide long-acting repeatable for the treatment of advanced neuroendocrine tumours associated with carcinoid syndrome (RADIANT-2): a randomised, placebo-controlled, phase 3 study. Lancet 2011;378:2005-12
- PROMID Clinical Study Report. East Hanover, NJ: Novartis Pharmaceuticals Corp (data on file). 2009
- Hagiwara M, Hackshaw MD, Oster G. Economic burden of selected adverse events in patients aged ≥65 years with metastatic renal cell carcinoma. J Med Econ 2013;16:1300-6
- Burudpakdee C, Zhao Z, Munakata J, et al. Economic burden of toxicities associated with metastatic colorectal cancer treatment regimens containing monoclonal antibodies. J Med Econ 2012;15:371-7
- Elting LS, Lu C, Escalante CP, et al. Outcomes and cost of outpatient or inpatient management of 712 patients with febrile neutropenia. J Clin Oncol 2008;26:606-11
- Weycker D, Edelsberg J, Kartashov A, et al. Risk and healthcare costs of chemotherapy-induced neutropenic complications in women with metastatic breast cancer. Chemotherapy 2012;58:8-18
- National Physician Fee Schedule. Baltimore, MD: Center for Medicare and Medicaid Services (CMS), 2015. https://www.cms.gov/apps/physician-fee-schedule/search/search-criteria.aspx. Accessed April 19, 2016
- Burke TA, Wisniewski T, Ernst FR. Resource utilization and costs associated with chemotherapy-induced nausea and vomiting (CINV) following highly or moderately emetogenic chemotherapy administered in the US outpatient hospital setting. Supportive Care Cancer 2011;19:131-40
- Pike CT, Birnbaum HG, Muehlenbein CE, et al. Healthcare costs and workloss burden of patients with chemotherapy-associated peripheral neuropathy in breast, ovarian, head and neck, and nonsmall cell lung cancer. Chemother Res Pract 2012:1-10
- Healthcare Cost and Utilization Project (HCUP). Rockville, MD: Agency for Healthcare Research and Quality, 2012. http://hcupnet.ahrq.gov/. Accessed April 19, 2016
- MAG Mutual Healthcare Solutions. Physicians Fee & Coding Guide. Atlanta, GA: MAG Mutual Healthcare Solutions, Inc.; 2012
- Dasari A. Changing trends in the epidemiology and survival of neuroendocrine tumors in the United States: a SEER population-based study of 64,971 cases. Poster session presented at: North American Neuroendocrine Tumor Society (NANETS) Annual Symposium; 2016 Sep 30; Jackson Hole, WY
- Yao JC, Hassan M, Phan A, et al. One hundred years after “carcinoid”: epidemiology of and prognostic factors for neuroendocrine tumors in 35,825 cases in the United States. J Clin Oncol 2008;26:3063-72
- Wolin EM. Challenges in the diagnosis and management of well-differentiated neuroendocrine tumors of the lung (typical and atypical carcinoid): current status and future considerations. Oncologist 2015;20:1123-31
- Ekeblad S, Sundin A, Janson ET, et al. Temozolomide as monotherapy is effective in treatment of advanced malignant neuroendocrine tumors. Clin Cancer Res 2007;13:2986-91
- Fine RL, Gulati AP, Krantz BA, et al. Capecitabine and temozolomide (CAPTEM) for metastatic, well-differentiated neuroendocrine cancers: the Pancreas Center at Columbia University experience. Cancer Chemother Pharmacol 2013;71:663-70