
Abstract
Objective: To estimate real-world healthcare utilization and expenditures across the spectrum of chronic kidney disease (CKD), as determined by estimated glomerular filtration rate (eGFR) categories in patients with diabetes.
Methods: This study employed a retrospective cohort study design using the Truven Healthcare and Claims Dataset from 2009–2012. Index date was defined as the first eGFR value during a continuous enrollment period of 24 months. Cohorts of patients were stratified by Kidney Disease: Improving Global Outcomes CKD stage based on eGFR (stages 1: ≥90 mL/min/1.73 m2; 2: 60–89; 3A: 45–59; 3B: 30–44; 4: 15–29; 5: <15). Healthcare expenditures (total patient and payer paid claims) and utilization (number of claims or visits) were estimated 12-months post-index date using generalized linear modeling and negative binomial modeling, respectively, after adjusting for baseline characteristics.
Results: Of 130,098 patients with an index eGFR value and 24-months continuous enrolment, 64,521 (49.59%) were in stage 1 CKD, 47,816 (36.75%) were in stage 2, 13,377 (10.28%) were in stage 3A, 3,217 (2.47%) were in stage 3B, 898 (0.69%) were in stage 4, and 269 (0.21%) were in stage 5. Patients in stages 3A, 3B, and 4 CKD had 1.32 (95% CI = 1.22–1.43), 1.59 (95% CI = 1.41–1.80), and 2.65 (95% CI = 2.23–3.14) times higher rates of diabetes-associated inpatient visits, respectively, compared with stage 1 CKD patients. Patients in stages 3A, 3B, and 4 CKD had increased incremental total annual healthcare expenditures of $1,732 (95% CI = $1,109–$2,356), $2,632 (95% CI = $1,647–$3,619), and $6,949 (95% CI = $5,466–$8,432), respectively, compared with stage 1 CKD patients.
Limitations: The claims data were generated for billing and reimbursement, not for research purposes.
Conclusions: These real-world data suggest an incremental and significant increase in economic burden in diabetes as kidney function declines, starting with moderate (stage 3A) CKD.
Introduction
Diabetes mellitus is the leading cause of chronic kidney disease (CKD) in the USCitation1. Hyperglycemia and increased glomerular pressure are both present in patients with diabetes mellitus. These two influences have a negative effect of the kidney that can result in glomerular mesangium expansion secondary to increased mesangial stretch, and promulgate the development of CKD. Approximately 7 million patients in the US suffer from both type 2 diabetes and CKD. Moreover, the prevalence of CKD in patients with diabetes has steadily increased from 1988–2008, based on National Health and Nutrition Examination Survey (NHANES) estimatesCitation1. Considering the steady increase in prevalence of diabetes, these trends should persist.
The economic burden of CKD is a significant contributor to overall healthcare spending in the USCitation2,Citation3. The 2015 United States Renal Data System (USRDS) report estimated that Medicare spending for patients with CKD over 65 years of age exceeded $50 billion in 2014, which represents 20% of all Medicare spending for that age groupCitation3. Furthermore, over 70% of the $50 billion spent on CKD was incurred by patients with comorbid diabetes, heart failure, or both. The USRDS report also found per-patient spending was double the amount in 2013 for patients with comorbid diabetes, heart failure, and CKD, as compared with patients with CKD alone.
Although studies have estimated the economic burden of late-stage CKD in diabetesCitation4 or CKD, irrespective of stageCitation5,Citation6, the impact of moderate (stages 2–4) CKD in diabetes (stages 2–4) is less widely described. Studies that have estimated the economic impact of moderate CKD in patients with diabetes have been from select health maintenance organization (HMO) populations based in the NorthwestCitation7,Citation8. It is important to characterize and summarize the clinical and economic impact of mild-to-moderate CKD in commercially insured and Medicare-covered diabetes patients across the US. Our objective was to estimate and quantify healthcare resource utilization and expenditures across the spectrum of CKD stages among commercially insured and Medicare-covered patients with diabetes.
Methodology
Data source
We used the Truven Health MarketScan® Commercial Claims and Encounters and Medicare Supplemental and Coordination of Benefits databases from 2009–2012 to create a retrospective cohort of commercially insured and Medicare patients stratified by CKD stage, as determined by estimated glomerular filtration rate (eGFR). The data include medical claims identified using Current Procedural Terminology, Version 4 (CPT-4) procedure codes, Healthcare Common Procedure Coding System (HCPCS) procedure codes, and International Classification of Diseases, Ninth Revision (ICD-9) procedure codes. Drug claims were identified using National Drug Codes (NDC) and HCPCS codes. The data also included demographic characteristics such as age, sex, region of the US, and insurance plan type (e.g. HMO, preferred provider organization [PPO]). In addition to claims and demographics, laboratory data such as serum creatinine, glycated hemoglobin (A1c), and albuminuria were available. This study was deemed exempt by the Colorado Multiple Institutional Review Board (COMIRB).
Study population
We identified adult (aged 18–89 years) patients with diabetes using ICD-9 code 250.xx as the primary or secondary diagnosis code (see Supplementary material) and formed two cohorts of patients with and without an estimated glomerular filtration rate (eGFR) laboratory measurement during the study period January 1, 2009 to December 31, 2013. Our original aim was to identify type 2 diabetes patients only; however, given a lack of laboratory data, we included all diabetes patients. The index date was defined as the first eGFR value between January 1, 2010 and December 31, 2012 to ensure each continuously enrolled patient had a 12-month baseline and 12-month follow-up period. We excluded patients with disease causes of renal impairment other than diabetes and hypertension (e.g. heart failure) and patients with a history of solid organ transplant (see Supplementary material for inclusion/exclusion codes). We further stratified the cohort by Kidney Disease Improving Global Outcomes (KDIGO)-defined CKD stage categoriesCitation9.
Measures
Recommendations for assessing kidney function and staging CKD have been outlined by the KDIGO 2012 Clinical Practice Guideline for the Evaluation and Management of CKDCitation9. This CKD classification is based eGFR category, and albuminuria category. The specific CKD categories (stage 1, stage 2, stage 3A, stage 3B, stage 4, and stage 5) are assigned based on eGFR.
The key explanatory variable, eGFR, was calculated using the Chronic Kidney Disease Epidemiology Collaboration (CKD-EPI) formula, which is a function of serum creatinine, age, sex, and raceCitation10. KDIGO 2012 Clinical Practice Guideline for the Evaluation and Management of CKD recommends that clinical laboratories report eGFR using the 2009 CKD-EPI formulaCitation9. Furthermore, the 2009 CKD-EPI formula has greater accuracy and precision than other formulae, such as the Modification of Diet in Renal Disease (MDRD) formulaCitation9,Citation10. We stratified our cohort by KDIGO defined CKD stage categories using index date eGFR values: stage 1: ≥90 mL/min/1.73 m2; stage 2: 60–89 mL/min/1.73 m2; stage 3A: 45–59 mL/min/1.73 m2; stage 3B: 30–44 mL/min/1.73 m2; stage 4: 15–29 mL/min/1.73 m2; stage 5: <15 mL/min/1.73 m2. Outcomes were compared between the referent stage 1 CKD and stages 2–5 during a 12-month follow-up period post-index date.
Other explanatory variables included age, sex, region of the US, insurance type, plan type, and comorbid conditions. Comorbid conditions were consolidated into the Charlson Comorbidity Index (CCI) adapted for claims analysesCitation11.
Outcomes
The outcome measures were all-cause and diabetes-specific (i.e. diabetes ICD-9 diagnosis code associated with claim) healthcare utilization and total expenditures. Total expenditures related to medication and healthcare utilization (all-cause and diabetes-related) were assessed using the actual paid claims amount. Expenditures were inflated to 2015 US dollars using the medical care component of Consumer Price Index. Medical claims included inpatient, outpatient, and emergency room visits, and were identified using CPT-4 procedure codes, HCPCS procedure codes, and ICD-9 procedure codes. Paid drug claims were identified using National Drug Codes (NDC) and HCPCS codes from our inclusion cohort. We identified anti-diabetic medications (metformin, sulfonylureas, dipeptidyl peptidase-4 [DPP-4] inhibitors, glucagon-like peptide-1 [GLP-1] analogs, thiazolidinediones, sodium-glucose cotransporter 2 [SGLT2] inhibitors, insulins) and angiotensin-converting enzyme (ACE) inhibitors/angiotensin receptor blockers (ARBs) and created count variables for unique and refill drug claims. All other NDC’s were combined to create count variables for other unique and refill drug claims.
Statistical analysis
Frequency tables (n, %) and Chi-squared tests were used to assess differences between categorical variables across CKD stages. Means and independent sample t-tests were used to assess differences between continuous variables across CKD stage. For pharmacy utilization, in order to estimate differences in unique prescription utilization and overall utilization, the analysis was split by the exclusion and inclusion of refills. For all other utilization and total expenditure estimates, the analysis reported all-cause and diabetes-associated adjusted estimates. Regression models adjusted for baseline CCI, insurance type (commercial, Medicare), region, age, plan type (PPO, HMO, etc.), and prescribed medications at baseline including anti-diabetic and ACE/ARB medications. Negative binomial models were used for the adjusted health care utilization analysis, reporting incidence rate ratios (IRR) and 95% confidence intervals (CIs) for stages 2–5 CKD as compared to patients in stage 1 CKD. Generalized linear modeling (GLM) with Poisson family and log link (as tested using the modified Park testCitation12) were used for the adjusted healthcare expenditure analysis reporting marginal effects (dy/dx) and 95% CIs as compared with patients in stage 1 CKD. Additionally, we estimated adjusted expenditures for all CKD stages stratified by pharmacy and medical expenditures using GLM models.
Sensitivity analyses
As a sensitivity analysis, we separated the expenditure analysis into patients with and without any dialysis codes during the follow-up period to identify if dialysis procedures were a major driver of expenditures in stages 2–4 CKD.
Results
Of 130,098 patients with an index eGFR value and a 24-month continuous enrollment, 64,521 (49.59%) were in stage 1 CKD, 47,816 (36.75%) were in stage 2, 13,377 (10.28%) were in stage 3A, 3,217 (2.47%) were in stage 3B, 898 (0.69%) were in stage 4, and 269 (0.21%) were in stage 5 (). Significant differences between CKD stage were observed for all variable categories. A large percentage of patients resided in the South region of the US (55.9%), were commercially insured (88.8%) and enrolled in a PPO plan (61.9%). Patients in stages 4 (14.4%) and 5 (70.3%) had baseline dialysis procedure claims. CCI increased incrementally across CKD stages, indicating worsening health with CKD progression.
Table 1. Baseline demographic characteristics by chronic kidney disease stage.
Significant increases in healthcare utilization outcomes were observed between stages 2–5 CKD compared with stage 1 CKD (). For example, patients in stages 3A, 3B, and 4 CKD had 1.32 (95% CI = 1.22–1.43), 1.59 (95% CI = 1.41–1.80), and 2.65 (95% CI = 2.23–3.14) times higher expected rates of diabetes-associated inpatient visits, respectively, compared with stage 1 CKD patients. Among all diabetes-specific outpatient, emergency department, and inpatient visits, significant increases in IRR’s compared to stage 1 were observed for all but two estimates in stages 2 and 3A CKD. Among all-cause outpatient, emergency department, and inpatient visits, significant increases in IRR’s compared to stage 1 were observed for all but four estimates in stages 2 and 3B CKD. The only IRR estimates from stages 3B, 4, and 5 CKD that were not significant compared to stage 1 include diabetes-related medications, including refills.
Table 2. Adjusted annual utilization estimates by chronic kidney disease stage.
Significant increases in all cause and diabetes-related total healthcare expenditures were observed between stages 2–5 CKD compared with stage 1 CKD (). Patients in stages 3A, 3B, and 4 CKD had increased incremental total healthcare expenditures of $1,732 (95% CI = $1,109–$2,356), $2,632 (95% CI = $1,647–$3,619), and $6,949 (95% CI = $5,466–$8,432), respectively, compared with CKD stage 1 patients. Patients in stages 3A, 3B, and 4 CKD had increased incremental diabetes-related healthcare expenditures of $741 (95% CI = $453–$1,029), $1,314 (95% CI = $854–$1,774), and $3,217 (95% CI = $2,535–$3,899), respectively, compared with CKD stage 1 patients. Expenditure differences between stage 2 and stage 1 CKD were not significantly different from zero.
Table 3. Adjusted annual expenditure estimates by chronic kidney disease stage.
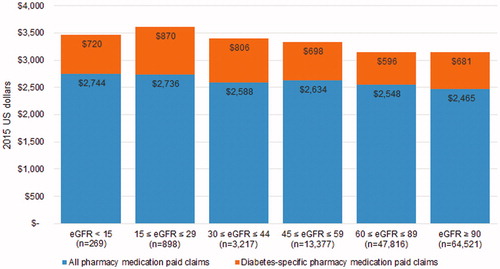
Medical-related expenditures were associated with the largest differences in total expenditures between CKD stages ( and ) as compared with pharmacy-related expenditures. For example, displays the increase in both all-cause and diabetes-related medical expenditures beginning at stage 3A, with a significant rise in expenditures at stage 5. However, displays a relatively even distribution in pharmacy expenditures across CKD stages. Utilization estimates from suggest the main drivers behind significant medical expenditure increases at later stages of CKD in are inpatient and emergency department visits.
Figure 1. Adjusted 12-month follow-up all-cause and diabetes-specific medical expenditures by CKD stage.
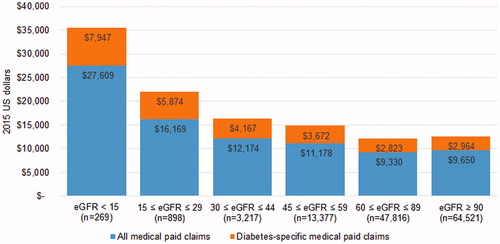
Figure 2. Adjusted 12-month follow-up all-cause and diabetes-specific pharmacy expenditures by CKD stage.
The sensitivity analysis results splitting out patients with and without follow-up dialysis codes revealed similar expenditure differences consistent with the main analysis. Specifically, excluding patients with any dialysis codes at follow-up resulted in expected lower expenditures at stage 5, and very similar expenditure levels across stages 2, 3A, 3B, and 4 (i.e. expenditures were not driven by dialysis in stages 2–4).
Discussion
We performed this retrospective cohort study to estimate the economic burden of CKD in patients with diabetes across a spectrum of CKD stages. We observed significant increases in healthcare utilization and expenditures, beginning as early as stage 3A. Our findings were consistent for utilization and expenditure outcomes across CKD stages, with high rates of emergency department and inpatient visits for stages 3A through stage 5 CKD as compared to stage 1 CKD. We also found that the increasing incremental expenditures by CKD stage were largely driven by medical expenditures, not pharmacy expenditures.
Our results are consistent with previous research on the economic burden of CKD in diabetes. Laliberte et al.Citation5 performed a retrospective cohort study to assess the burden of CKD (defined as a group of stages 3–5 eGFR <60 mL/min/1.73 m2) among patients with diabetes only, hypertension only, and comorbid diabetes and hypertension. They analyzed pre- and post-CKD expenditures in a cohort of patients who developed CKD during the study period. Annual mean all cause healthcare expenditures were significantly higher for patients who developed CKD relative to their pre-CKD period for patients with diabetes only (mean [SD] = $8,829 [$4,899]), hypertension only (mean [SD] = $4175 [$2,741]), and comorbid diabetes and hypertension (mean [SD] = $9,397 [$7,240]). The authors also found the largest driver of all-cause expenditures was hospitalization cost. Ozieh et al.Citation6 conducted a cross-sectional analysis using the 2011 Medical Expenditure Panel Survey (MEPS) analyzing total direct medical expenditures between self-reported comorbid diabetes and CKD patients and patients with self-reported diabetes only. Adjusted mean expenditures were $8,473 (95% CI = $4,957–$11,989) higher for patients with diabetes and CKD as compared with patients with diabetes only. Our analysis differs from those of Laliberte et al.Citation5 and Ozieh et al.Citation6 because in our analysis we separated all-cause and diabetes-related expenditures in a cohort of patients with diabetes only, across the entire spectrum of CKD.
Vupputuri et al.Citation8 estimated costs by CKD progression in type 2 diabetes and found increases in economic burden beginning at early stages. Using data from Kaiser Permanente Northwest (KPNW), the authors stratified diabetes patients by baseline CKD stage 0–2 (60–90 mL/min/1.73 m2), stage 3 (30–59 mL/min/1.73 m2), and stage 4 (15–29 mL/min/1.73 m2), and estimated the inpatient, outpatient, and pharmacy costs associated with CKD progression over varying follow-up periods. Follow-up adjusted costs were higher for patients who progressed from baseline stages 0–2 ($4,569), stage 3 ($12,617), and stage 4 ($33,162), compared with patients who did not progress. The authors found that patients who progressed to higher CKD stages from baseline had 2–4-times higher costs compared with those who did not progress. While not directly comparable to our study, the authors found significant costs for treating CKD begin as early as stage 3, with costs driven in large part by inpatient visits. Findings from our study in and suggest these costs in later stages of CKD were driven by inpatient and emergency department visits.
A large portion of patients with diabetes have comorbid CKD in the USCitation1,Citation13. This is a major contributor to morbidity and potentially mortality in this population. Therefore, early identification and clinical intervention for CKD in patients with diabetes are important as a strategy to mitigate progression of CKD. Optimizing glycemic control and lowering blood pressure with appropriate use of pharmacotherapy can reduce the risk of new or worsening nephropathyCitation14. Our findings that demonstrate an increased economic burden as kidney function declines further support early intervention with strategies that deter disease progression in patients with diabetes, at least starting in stage 3A CKD, if not earlier. Furthermore, glycemic control itself, regardless of CKD, is a driver of short-term healthcare costsCitation15, and adverse effects such as hypoglycemia may be avoided with optimal management strategies.
The progression of CKD in diabetes can also complicate use of diabetes pharmacotherapy. The National Kidney Foundation in the 2012 update of the Kidney Disease Outcomes Quality Initiative (KDOQI) Clinical Practice Guideline for Diabetes and CKD outlines dose adjustment, or in some cases avoidance, for insulin and oral medicines for diabetes in patients with stage 3, 4, and 5 CKDCitation9. Recently, the recommended use of metformin has been updated to include a new restriction for use based on progression of CKD using eGFRCitation16. The need for dose adjustments or restrictions based on progression of CKD is primarily to ensure safe use of drug therapy. However, clinicians do not always identify when CKD progresses to the point that medications require dose reduction or restriction, and this can potentially lead to increased harm.
There are important limitations to consider in this study. While the evidence is strongly suggestive of economic burden beginning at moderate CKD stages for patients with diabetes, because of the observational study design we cannot determine this association to be causal. This is one of the first studies among commercially insured populations with enough laboratory data to stratify patients in all CKD stages based on eGFR. Moreover, studies that estimated the cost of CKD progression during follow-up periods found similar results, namely economic burden begins with early stages of renal impairmentCitation7,Citation8. Given the availability of longer-term data with eGFR values that track patients over 5–10 years, this limitation could be minimized further.
We did not have direct access to the medical records of each patient, therefore misclassification bias may also be a factor in this analysis. First, we included all patients with diabetes to avoid any possible recording bias (e.g. patients with type 2 diabetes coded as type 1). Without enough laboratory information to exclude patients with type 1 diabetes (e.g. presence of islet antibodies, low C-peptide)Citation17,Citation18, we made the decision to include all diabetes patients. Second, when using eGFR to stratify patients into CKD stages we cannot confirm their specific CKD stage. For example, if certain patients had stage 5 CKD during our analysis, but were misclassified as stage 3B CKD, costs in this case may be over-estimated for the moderate CKD stages. In an attempt to address this limitation, we did a sensitivity analysis on patients without any dialysis codes in the follow-up period in CKD stages 2–4. The results were consistent with our main findings that incremental increases in medical expenditures were still present, even in patients with no follow-up dialysis codes.
The data did not have information on important variables such as additional confounders or indirect measures of economic burden. For example, possible confounders such as diet and exercise would be ideal as adjustment variables in multivariable regression models. Additionally, indirect costs associated with lost productivity were not available in the data. Indirect cost estimates to patients, caregivers, and employers have been previously identified as a gap in the literature for the economic burden of CKDCitation19.
Conclusions
We found an incremental and significant increase in economic burden in patients with diabetes as kidney function declines. This increase in burden started with moderate (stage 3A) CKD. Increased awareness of CKD progression in diabetes is warranted from both an economic and medical perspective. Chronic disease management interventions are needed to mitigate progression of CKD beginning with early stages of CKD.
Transparency
Declaration of funding
The study was funded by AstraZeneca.
Declaration of financial/other interests
RBM, KVN, and JJS were supported on an unrestricted grant from AstraZeneca to complete this work. SF and KB were employees of AstraZeneca at the time of this work. JME peer reviewers on this manuscript have no relevant financial or other relationships to disclose.
Previous presentations
Findings were previously presented in poster format at the 2016 Annual Society for Pharmacoeconomics and Outcomes Research International Meeting in Washington, DC.
Supplementary_material.docx
Download MS Word (22 KB)Acknowledgments
We would like to thank AstraZeneca employee reviewers for their suggested edits to the manuscript.
Related Research Data
References
- de Boer IH, Rue TC, Hall YN, et al. Temporal trends in the prevalence of diabetic kidney disease in the United States. JAMA 2011;305:2532-9
- Honeycutt AA, Segel JE, Zhuo X, et al. Medical costs of CKD in the Medicare population. J Am Soc Nephrol JASN 2013;24:1478-83
- United States Renal Data System. Medicare expenditures for persons with CKD 2016 annual data report. Bethesda, MD: National Institute of Diabetes and Digestive and Kidney Diseases, National Institutes of Health, 2016 https://www.usrds.org/2016/view/v1_06.aspx. Accessed August 2016
- Slabaugh SL, Curtis BH, Clore G, et al. Factors associated with increased healthcare costs in Medicare Advantage patients with type 2 diabetes enrolled in a large representative health insurance plan in the US. J Med Econ 2015;18:106-12
- Laliberte F, Bookhart BK, Vekeman F, et al. Direct all-cause health care costs associated with chronic kidney disease in patients with diabetes and hypertension: a managed care perspective. J Manage Care Pharm JMCP 2009;15:312-22
- Ozieh MN, Dismuke CE, Lynch CP, et al. Medical care expenditures associated with chronic kidney disease in adults with diabetes: United States 2011. Diabetes Res Clin Prac 2015;109:185-90
- Nichols GA, Vupputuri S, Lau H. Medical care costs associated with progression of diabetic nephropathy. Diabetes Care 2011;34:2374-8
- Vupputuri S, Kimes TM, Calloway MO, et al. The economic burden of progressive chronic kidney disease among patients with type 2 diabetes. J Diabetes Complic 2014;28:10-16
- KDIGO National Guideline. Kidney Disease: Improving Global Outcomes (KDIGO) CKD Work Group. KDIGO 2012 Clinical Practice Guideline for the Evaluation and Management of Chronic Kidney Disease. Kidney inter., Suppl. 2013;3:1-150
- Levey AS, Stevens LA, Schmid CH, et al. A new equation to estimate glomerular filtration rate. Ann Intern Med 2009;150:604-12
- Charlson ME, Pompei P, Ales KL, et al. A new method of classifying prognostic comorbidity in longitudinal studies: development and validation. J Chronic Dis 1987;40:373-83
- Manning WG, Mullahy J. Estimating log models: to transform or not to transform? J Health Econ 2001;20:461-94
- Iglay K, Hannachi H, Joseph Howie P, et al. Prevalence and co-prevalence of comorbidities among patients with type 2 diabetes mellitus. Curr Med Res Opin 2016;32:1243-52
- Zoungas S, de Galan BE, Ninomiya T, et al. Combined effects of routine blood pressure lowering and intensive glucose control on macrovascular and microvascular outcomes in patients with type 2 diabetes: New results from the ADVANCE trial. Diabetes Care 2009;32:2068-74
- Aagren M, Luo W. Association between glycemic control and short-term healthcare costs among commercially insured diabetes patients in the United States. J Med Econ 2011;14:108-14
- Food and Drug Administration. FDA revises warnings regarding use of the diabetes medicine metformin in certain patients with reduced kidney function. Washington, D.C, USA: U.S. Food and Drug Administration, 2016. http://www.fda.gov/Drugs/DrugSafety/ucm493244.htm. Accessed August 2016
- Klompas M, Eggleston E, McVetta J, et al. Automated detection and classification of type 1 versus type 2 diabetes using electronic health record data. Diabetes Care 2013;36:914-21
- Zgibor JC, Orchard TJ, Saul M, et al. Developing and validating a diabetes database in a large health system. Diabetes Res Clin Prac 2007;75:313-9
- Wang V, Vilme H, Maciejewski ML, et al. The economic burden of chronic kidney disease and end-stage renal disease. Semin Nephrol 2016;36:319-30