
Abstract
Background: A phase III trial evaluated the efficacy and safety of Daklinza (daclatasvir or DCV) in combination with sofosbuvir (SOF) for treatment of genotype (GT) 3 hepatitis C virus (HCV) patients.
Aim: This study evaluated the cost-effectiveness of DCV + SOF vs SOF in combination with ribavirin (RBV) over a 20-year time horizon from the perspective of a United States (US) payer.
Methods: A published Markov model was adapted to reflect US demographic characteristics, treatment patterns, costs of drug acquisition, monitoring, disease and adverse event management, and mortality risks. Clinical inputs came from the ALLY-3 and VALENCE trials. The primary outcome was the incremental cost-utility ratio. Life-years, incidence of complications, number of patients achieving sustained virological response (SVR), and the total cost per SVR were secondary outcomes. Costs (2014 USD) and quality-adjusted life years (QALYs) were discounted at 3% per year. Deterministic, probabilistic, and scenario sensitivity analyses were conducted.
Results: DCV + SOF was associated with lower costs and better effectiveness than SOF + RBV in the base case and in almost all scenarios (i.e. treatment-experienced, non-cirrhotic, time horizons of 5, 10, and 80 years). DCV + SOF was less costly, but also slightly less effective than SOF + RBV in the cirrhotic and treatment-naïve population scenarios. Results were sensitive to variations in the probability of achieving SVR for both treatment arms. DCV + SOF costs less than $50,000 per QALY gained in 79% of all probabilistic iterations compared with SOF + RBV.
Conclusion: DCV + SOF is a dominant option compared with SOF + RBV in the US for the overall GT 3 HCV patient population.
Introduction
The hepatitis C virus (HCV) represents a major global public health burden. Between 130–210 million people are chronically infected with the disease worldwideCitation1,Citation2. HCV affects ∼2.7 million people in the United States (US)Citation3, and was responsible for ∼19,368 deaths in the US in 2013Citation4. HCV is predominantly transmitted via infected blood, either from intravenous drug use, high-risk sexual activity, or blood transfusion prior to screeningCitation5. The aim of treatment is the eradication of HCV infection, defined as the absence of HCV ribonucleic acid (RNA) at the end of treatment, and at 12 weeks post-treatment; this is termed “sustained virological response” (SVR). The HCV genotype (GT) and stage of liver fibrosis are the strongest predictors of SVRCitation6.
Daklinza (daclatasvir or DCV), a pangenotypic non-structural polymerase 5A (NS5A) protein inhibitor, plays an important role in viral RNA replication and assembly/secretion of infectious particles from hepatic cellsCitation7. DCV, taken once a day at a recommended dosage of 60 mg, gained its first approval in July 2015 in the US; it was initially approved for treatment of chronic HCV in GT 3 infections in adult patients, based on the ALLY-3 trial. In this study, DCV has been investigated in combination with sofosbuvir (SOF) in patients with GT 3 HCV, a patient population with a unique genotype with a higher risk of fibrosis progression compared with other HCV genotypes. During this trial, the DCV + SOF regimen was administered to treatment-naïve and treatment-experienced patients for 12 weeks. Overall, patients were 59% male, with a median age of 55 years, 78% of them had a fibrosis stage of F0–F3, and 21% had cirrhosisCitation8.
The emergence of novel therapeutic approaches capable of achieving SVR probabilities approaching 100%, even in the most difficult-to-treat patients such as those with GT 3 HCV, means that altering the future transmission dynamics of the disease is feasible. However, the cost-effectiveness of these approaches is yet to be ascertained. We describe in this paper a US adaptation of a cohort Markov framework (MONARCH model) and the use of this adaptation to investigate the cost-utility of a 12-week regimen of DCV + SOF compared with a 24-week regimen of SOF in combination with ribavirin (RBV) in patients with GT 3 HCV, the only other approved regimen indicated in the US for treating this population at the time the analyses were conducted.
Materials and methods
Model overview
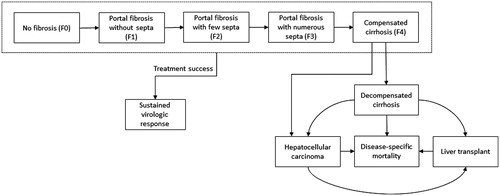
We adapted an existing cohort Markov framework that was designed to simulate the natural history of HCV, including its complications, and to track the clinical and economic outcomes of a hypothetical cohort of patients with GT 3 HCV being treated with one of two treatment options from a US payer perspectiveCitation9–12. The model was implemented in Microsoft Excel using Visual Basic for Applications. Patients were treated with either DCV + SOF for 12 weeks or SOF + RBV for 24 weeks during the first year of the simulation. In the base case, the model tracks patients for 20 years, during which time they initiate treatment and achieve SVR, progress to more severe disease stages, experience complications, or die. Patients start in one of five Metavir chronic hepatitis C (CHC) fibrosis stages (F0 = no fibrosis, F1 = portal fibrosis with no septa, F2 = portal fibrosis with few septa, F3 = portal fibrosis with numerous septa, and F4 = compensated cirrhosis [CC]); a cohort of patients distributed across the fibrosis stages is defined at the beginning of the simulation. Patients who achieve SVR remain in that state until the end of the model time horizon or death.
Achievement of SVR is considered tantamount to a cure; it is assumed that, once SVR has been achieved, patients no longer progress to a more advanced health state. Patients who do not achieve SVR remain at risk of: (1) progressing from their initial fibrosis stage to more severe disease stages; (2) complications such as CC, decompensated cirrhosis (DC), hepatocellular carcinoma (HCC), or liver transplant (LTx); or (3) all-cause mortality or liver-related death (). The model combines information on therapy effectiveness, adverse events (AEs), therapy cessations, health state utilities, treatment disutilities, mortality risks, and costs to estimate complications, quality-adjusted life years (QALYs), and total costs.
Figure 1. Flow diagram of the MONARCH model.
The underlying MONARCH model framework has previously been validated against a UK-specific cost-effectiveness modelCitation13. The model framework has also been validated against other HCV cost-effectiveness models set in Belgium, Japan, Spain, the UK, and the USCitation14–19.
Patient population
Baseline characteristics for the hypothetical cohort of patients infected with HCV GT 3 used in the base-case analysis are shown in . These population characteristics were based on data from the US Centers for Disease Control and Prevention (CDC) and on a recent model of a US birth cohort screening program for HCVCitation20,Citation21.
Table 1. Model inputs.
Transition probabilities
Probabilities of progressing to subsequent fibrosis stages or experiencing a complication were obtained from the literature ()Citation22,Citation23. All transition probabilities are conditional on surviving (i.e. all-cause mortality is determined at the beginning of each annual cycle, and the transition probabilities are applied to the living patients only). Patients who do not achieve SVR and do not die can remain in the same health state or progress to a more severe state. As shown in , patients in fibrosis stages F0–F3 can transition to the subsequent fibrosis stage (i.e. F1–CC), and those at fibrosis stage CC can transition to DC or HCC. Patients with DC can remain in that state or transition to HCC, receive a LTx, or die from liver-related causes. Patients with HCC can receive an LTx or die from liver-related causes, and those who have received an LTx can die from liver-related causes. Patients who achieve SVR have no increased risk for experiencing complications such as DC and HCC (i.e. transitions from CC to DC or HCC in patients that have achieved SVR are also assumed to be zero)Citation24. Transition probabilities across F0–CC are based on a meta-regression published by Thein et al.Citation23, and the transition probabilities to end-stage liver disease stages and HCV complications come from a previously published cost-effectiveness analysis of antiviral treatments for HCV by Martin et al.Citation22. The probabilities at which patients progress through fibrosis stages are independent of patient age, presence of comorbid conditions or coinfections, and baseline disease severity. The use of such transition probabilities is a common feature of economic models in HCVCitation24; several recent modelsCitation25–27 used the above-mentioned disease progression probabilities published by Thein et al.Citation23.
Survival
The model incorporated all-cause and liver-related mortality risks. Annual age- and sex-specific mortality risks came from life tables for the US general populationCitation28. In addition to the risk of all-cause mortality, patients who experienced DC, HCC, and LTx also incurred a state-specific risk of liver-related death; the probabilities of liver-related death were obtained from the literature for each of these complications ()Citation22. Patients who achieved SVR and those who did not achieve SVR but had not yet progressed to DC, HCC, and LTx were not at increased risk of liver-related death and had an all-cause mortality risk equivalent to that of the general population in the US. Patient survival is not directly influenced by treatment.
Treatment effects, AEs, and treatment discontinuations
Clinical inputs for treatment efficacy (i.e. probability of achieving SVR), AEs, and treatment discontinuations were obtained from the ALLY-3 trial, the VALENCE trial, and a published matching-adjusted indirect comparison comparing the efficacy and tolerability of DCV + SOF versus SOF + R in patients infected with GT 3 HCV ()Citation8,Citation29,Citation30. ALLY-3 was a phase 3, open-label, two-cohort [treatment-naïve (n = 101) and treatment-experienced (n = 51)] trial evaluating a 12-week regimen of once-daily oral DCV (60 mg) plus SOF (400 mg) in patients with GT 3 HCV. The primary end-point was the proportion of patients achieving SVR12, as evidenced by an undetectable HCV viral load 12 weeks after completion of treatment. VALENCE was a phase 3, multi-center, placebo-controlled randomized controlled trial in which patients with GT 2 (n = 91) or GT 3 (n = 328) HCV were randomized 4:1 to receive once-daily SOF (400 mg) and twice-daily oral RBV (1,000 mg or 1,200 mg daily, depending on body weight) for 24 weeks or placebo. The primary end-point in the VALENCE trial was also SVR12.
Treatments evaluated in this economic evaluation have favorable safety profiles. AEs were mild, did not have any impact on quality-of-life, and were not affected by treatment response and/or discontinuation, but were associated with a one-time management cost. Anemia, the most prevalent AE associated with these two treatments, was the only AE incorporated into the analyses. We did not include other AEs because they are infrequent and associated with minimal management costs. The proportion of patients who experienced anemia in the ALLY-3 and VALENCE trials is reported in .
In the simulation, patients may have discontinued treatment for various reasons, including due to AEs. Patients who discontinue treatment in the model no longer incur therapy-related costs and disutility. Discontinuation probabilities observed in the ALLY-3 and VALENCE trials are detailed in .
Costs
Cost inputs include those that are related to the therapies and the health states (). Therapy-related costs include the costs of the actual antiviral regimens, on-treatment- and post-treatment-related monitoring, and AE management. Antiviral regimen- and monitoring-related costs only apply during those weeks when patients received treatment. SOF costs of $7,000 per week and DCV costs of $5,250 per week are used in the analysesCitation31.
The total cost of managing an anemia event, obtained from a recent retrospective database analysis in the US, is estimated at $1,271.21 (standard error [SE]: $254.24)Citation32.
Treatment-related and post-treatment monitoring costs are based on the 2014 recommendations published by the American Association for the Study of Liver Disease (AASLD) and account for general practitioner visit time, HCV-specific tests, general medical work-up, and therapy-specific testingCitation33. The cost of post-treatment monitoring is independent of the treatment received, but does depend on achieving SVR. Monitoring costs are dependent upon therapy duration, and are no longer accrued once patients discontinue treatment. The 4-week monitoring costs incurred while on treatment, and the annual post-treatment monitoring costs are summarized in . Annual costs associated with each fibrosis stage, SVR, and each complication were obtained from Davis et al.Citation34, McAdam-Marx et al.Citation35, and the 2014 AASLD recommendationsCitation33 (). Annual SVR costs depend on the severity of the HCV state from which patients achieved SVR and whether the patient has been in that state for 1 year or more. All costs were converted to and reported in 2014 US dollarsCitation36.
Health-state utilities
The model incorporates health-related quality-of-life for all health states via utility values that are used to compute QALYs. Utilities for health states were obtained from Martin et al.Citation22. The utilities for patients achieving SVR depended on the fibrosis stage from which SVR was achieved. The health utility values are shown in .
As AEs were assumed to be usually mild, the impact of treatment-related AEs on quality-of-life was incorporated into a treatment-related disutility adjustment, rather than via an AE disutility. The treatment-related disutility was not incurred following therapy discontinuation. The disutilities for DCV + SOF and SOF + RBV, both of which are peginterferon alfa-free regimens, were estimated to be 0.070 (SE = 0.014) per Younossi et al.Citation37.
Model outcomes
The primary outcomes of the model were QALYs, direct costs, and the incremental cost-utility ratio (ICUR). The ICUR is defined as the ratio of incremental total direct costs incurred to incremental QALYs gained associated with DCV + SOF compared with SOF + RBV. Secondary outcomes include life years (LYs) gained; the incremental cost-effectiveness ratio (ICER; defined as the ratio of incremental total direct costs incurred to incremental LYs gained); and event counts for CC, DC, HCC, LTx, and liver-related deaths. Additional outcomes include direct costs and therapy-related costs (including costs related to drug acquisition, monitoring, and AE management) per SVR.
Analyses
The base-case analysis evaluated a hypothetical cohort of 1,000 patients over a 20-year time horizon from a US payer perspective. Costs and health benefits were both discounted at 3.0% annuallyCitation38. A range of additional analyses were conducted to evaluate the robustness of the results and identify the model parameters which, when varied, exhibited the greatest effect on model results. These analyses included deterministic sensitivity analyses (DSA), probabilistic sensitivity analyses (PSA), and scenario analyses.
One-way DSA were conducted to evaluate how the model outcomes changed as selected model parameters were varied. These analyses were conducted by individually varying the SVR probabilities (by ± 10%), health state costs (by ± 20%), DCV weekly therapy cost (by ± 20%), and SOF weekly therapy cost (by ± 20%) while holding all others constant. Results reported from the DSA are the differences in costs, QALYs, as well as the ICUR between the two treatment arms calculated with all parameters set to their minimum or maximum values.
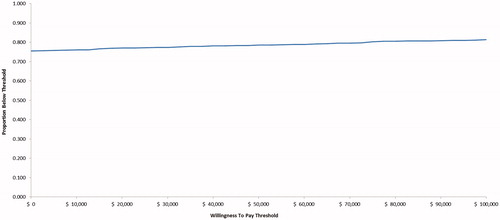
PSA were conducted to account for joint parameter uncertainty by simultaneously varying age, sex, initial fibrosis stage distribution, efficacy, costs, treatment discontinuation probabilities, disutilities, transition probabilities, costs and utilities for all health states, AE incidence, and AE cost. Transition probabilities and health utilities were sampled from a beta distribution, and costs were sampled from a gamma distribution. One thousand bootstrap replications with a cohort size of 1,000 patients were used in the PSA. Results of the PSA are displayed in a scatterplot and a cost-effectiveness acceptability curve (CEAC), with willingness-to-pay (WTP) ranging from $0–$100,000 per additional QALY.
Eight alternate scenarios evaluated the sensitivity of the results to differences in population (treatment-naïve, treatment-experienced, non-cirrhotic, cirrhotic), comparators (no treatment as control arm), and time horizon (5, 10, and 80 years).
Results
Base-case analysis
Treatment with DCV + SOF resulted in lower costs, from a payer’s perspective ($161,504 vs $190,146), and more QALYs gained (10.54 vs 10.44) over 20 years than SOF + RBV (i.e. DCV + SOF dominated SOF + RBV) in the overall GT 3 HCV patient population in the US (). Patients treated with DCV + SOF gained 0.03 more LYs than patients treated with SOF + RBV (13.95 vs 13.92, respectively) and they also experienced 14 fewer cases of CC, seven fewer cases of DC, three fewer cases of HCC, one fewer LTx, and seven fewer liver-related deaths (per 1,000 patients) than patients treated with SOF + RBV.
Table 2. Base-case discounted results.
Compared with patients receiving SOF + RBV, patients receiving DCV + SOF incurred lower costs for anti-viral therapy ($146,677 vs $169,451), management of AEs ($42 vs $76), monitoring ($441 vs $603), and disease management ($14,344 vs $20,015). Treatment with DCV + SOF was, therefore, associated with lower total direct and therapy-related costs per SVR ($180,250 vs $223,176).
Deterministic sensitivity analyses
DSA results showed that DCV + SOF dominated SOF + RBV in the majority of the analyses (). The incremental cost of DCV + SOF vs SOF + RBV was most sensitive to variations in both DCV + SOF and SOF + RBV weekly therapy costs. Variations in SVR probabilities in the two arms had substantial effects on incremental QALYs and ICURs. While DCV + SOF dominated SOF + RBV in most analyses, it no longer dominated if the SVR for DCV + SOF were decreased by 10%, if SVR for SOF + RBV were increased by 10%, if DCV + SOF treatment costs increased by 20%, or if SOF + RBV treatment costs decreased by 20%.
Table 3. DSA discounted results.
Probabilistic sensitivity analyses
In most of the PSA iterations, DCV + SOF provided better health outcomes (i.e. more QALYs) at lower costs than SOF + RBV, and DCV + SOF dominated SOF + RBV in ∼75% of the simulations (). DCV + SOF was cost-effective compared with SOF + RBV in 79% of the PSA iterations at a WTP threshold of $50,000 per QALY ().
Figure 2. PSA scatterplot results—discounted costs vs QALYs.PSA: probabilistic sensitivity analysis; QALY: quality-adjusted life years.Note: Costs and QALYs have been discounted using a 3% annual rate.
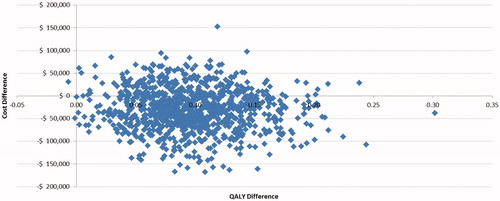
Figure 3. Cost-effectiveness acceptability curve.
Scenario analyses
The results of the scenario analysis are detailed in . DCV + SOF dominated SOF + RBV in every scenario tested except for treatment-naïve and cirrhotic patients, for which DCV + SOF was less costly but also slightly less effective, and in the scenario where DCV + SOF is compared with no treatment, for which DCV + SOF has an ICUR of $18,371 per QALY.
Table 4. Scenario analysis discounted results.
Discussion
The ICUR representing the comparison of DCV + SOF with SOF + RBV for the treatment GT 3 HCV was estimated using a validated cohort-based Markov model designed to simulate the natural history of HCV from chronic infection to end-stage liver disease and mortalityCitation9–11,Citation13,Citation39. The new oral therapy, DCV, which lacks an interferon component, is associated with a shorter treatment duration than the standard of care in the US (i.e. SOF + RBV) and constitutes the only regimen available without RBV for the majority of patients with GT 3 HCV at the time these analyses were conductedCitation8. As part of its clinical development, DCV has been studied in the ALLY-3 trial, a phase 3 evaluation of DCV + SOF in treatment-naive and treatment-experienced subjects with GT 3 HCV. Data from ALLY-3 on treatment effects, discontinuations, and AEs associated with DCV + SOF were used in the modelCitation8. Data for SOF + RBV came from the phase-3 VALENCE trialCitation29.
The model analyses indicated that DCV + SOF was clearly a cost-effective treatment option compared with SOF + RBV for treatment of GT 3 HCV. Results also showed that the DCV + SOF regimen was associated with lower HCV-related morbidity and mortality. The primary drivers of cost-savings associated with the DCV + SOF regimen were the shorter treatment duration, which led to lower costs for antiviral therapy, and the reduced incidence of HCV-related complications, which led to lower disease management costs. The reduced number of HCV-related complications (CC, DC, HCC, LTx, and liver-related deaths) associated with the DCV-based regimen led to medical care cost savings and gains in LYs and QALYs. The DCV + SOF regimen was also associated with fewer AEs than the therapeutic strategy available at the time these analyses were conducted.
Comprehensive sensitivity analyses were performed to better characterize the robustness of the base-case estimates in response to uncertainty in various model inputs. Several deterministic and probabilistic analyses were conducted, and a number of alternate scenarios were evaluated. DCV + SOF dominated SOF + RBV in almost all sensitivity analyses, indicating that the findings were robust to individual and joint changes in a range of key parameters. The DSA indicated that incremental costs and QALYs generated by the model were most sensitive to assumptions concerning weekly therapy costs and SVR probabilities in both treatment arms. In the PSA, DCV + SOF was cost-effective relative to SOF + RBV at a WTP threshold of $50,000 per QALY in almost 79% of the replications. DCV + SOF dominated SOF + RBV in five of the eight scenarios evaluated. However, in the cirrhotic and treatment-naïve population scenarios, DCV + SOF was less costly, but also slightly less effective than SOF + RBV. DCV + SOF was associated with an ICUR of $18,371 per QALY compared with no treatment.
Findings of other economic models evaluating the DCV + SOF regimen for treatment of GT 3 HCV depend on the data sources used and the other therapies evaluated, as well as the patient population studied. Overall, published results of economic analyses in other countries were aligned with our findings, particularly when SOF + RBV was used as the comparator and when efficacy data from the ALLY-3 trial were used, as shown in Citation40–43.
Table 5. Summary of published economic studies in GT 3 HCV.
At the time we conducted these analyses, daily SOF in combination with RBV for 24 weeks was the recommended regimen for patients with HCV genotype 3 infection according to 2014 AASLD guidelinesCitation33. Furthermore, the results from the ASTRAL-3 phase III trialCitation44 evaluating velpatasvir (VEL) in combination with SOF in this population of patients were not yet available. For these reasons, SOF + RBV was chosen as the comparator to DCV + SOF in this study. Our results confirm the 2016 AASLD guidelinesCitation45, in the sense that SOF + RBV should not be used as a treatment option for patients with HCV GT 3 infection.
Limitations
One of the strengths of our analyses was the consideration of the complexity of the HCV disease and the fact that analyses were performed for various sub-groups of patients. However, the results of our analyses are limited by the lack of head-to-head comparisons for many drugs, which might compromise the conclusions of this cost-effectiveness study. No mixed-treatment comparisons evaluating the efficacy and safety of various HCV treatment options for patients with GT 3 HCV were available at the time of these analyses. However, the various clinical trials considered in our analyses were conducted over the same period of time, so it can reasonably be assumed that the patients enrolled in the various clinical trials had similar baseline characteristics and are, therefore, likely to be comparable.
Our analyses relied on a number of simplifying assumptions. First, patients achieving SVR from chronic HCV remained in a state of SVR; following attainment of SVR, patients were assumed to not progress to end-stage liver disease complications such as DC or HCC. Second, as AEs were typically mild, the impact of treatment-related AEs on quality-of-life was incorporated via the application of a treatment-specific disutility adjustment. Therefore, no AE-specific disutilities were applied. Third, AE risks were assumed to be independent of patient age or initial disease severity. Finally, we considered only one AE, namely anemia, in the analyses and ignored others. Including other AEs, which occur infrequently and are inexpensive to manage, would not likely impact the cost-effectiveness results in any significant way.
Conclusion
Conditional on the assumptions applied, results from this economic model provide strong evidence that DCV in combination with SOF is a dominant strategy over SOF + RBV for treatment of GT 3 HCV in the US, as it is a less expensive and more effective regimen. The provision of an interferon-free treatment alternative such as DCV + SOF could offer valuable benefit in reducing the rate of life-threatening liver complications and increasing patients’ quality-of-life.
Transparency
Declaration of funding
Funding for this study was provided by Bristol-Myers Squibb. The funder provided support in the form of consulting fees for some authors [CST, DM, and MLG] and salaries for other authors [BS, SH, YY, and BG].
Declaration of financial/other interests
CST and MLG are employees of Evidera, Inc., an independent research organization that received consulting fees from Bristol-Myers Squibb for the development of this paper. BS, SH, and YY are employees of Bristol-Myers Squibb, the manufacturer of daclatasvir. At the time of this research project, DM and BG were employees of Evidera and Bristol-Myers Squibb, respectively, but are currently employed elsewhere. JME peer reviewers on this manuscript have no relevant financial or other relationships to disclose.
Previous presentation
Presented at the AASLD conference, San Francisco, CA, November 13–17, 2015.
Acknowledgments
The authors would like to acknowledge Michael Byrnes from Evidera for his help in writing this manuscript, as well as Lisa Rosenblatt from Bristol-Myers Squibb for her help in reviewing this paper.
References
- Lavanchy D. The global burden of hepatitis C. Liver Int 2009;29(Suppl1):74-81
- Shepard CW, Finelli L, Alter MJ. Global epidemiology of hepatitis C virus infection. Lancet Infect Dis 2005;5:558-67
- US Centers for Disease Control (CDC). Hepatitis C FAQs for health professionals, 2016. http://www.cdc.gov/hepatitis/hcv/hcvfaq.htm. Accessed January 10, 2016
- US Centers for Disease Control (CDC). Viral hepatitis surveillance, United States, 2013. http://www.cdc.gov/hepatitis/statistics/2013surveillance/pdfs/2013hepsurveillancerpt.pdf. Accessed January 19, 2016
- Williams IT, Bell BP, Kuhnert W, et al. Incidence and transmission patterns of acute hepatitis C in the United States, 1982–2006. Arch Intern Med 2011;171:242-8
- European Association of the Study of the Liver. 2011 European Association of the Study of the Liver hepatitis C virus clinical practice guidelines. Liver Int 2012;32(Suppl1):2-8
- Guedj J, Dahari H, Rong L, et al. Modeling shows that the NS5A inhibitor daclatasvir has two modes of action and yields a shorter estimate of the hepatitis C virus half-life. Proc Natl Acad Sci USA 2013;110:3991-6
- Nelson DR, Cooper JN, Lalezari JP, et al. All-oral 12-week treatment with daclatasvir plus sofosbuvir in patients with hepatitis C virus genotype 3 infection: ALLY-3 phase III study. Hepatology 2015;61:1127-35
- McEwan P, Kim R, Yuan Y. Assessing the cost utility of response-guided therapy in patients with chronic hepatitis C genotype 1 in the UK using the MONARCH model. Appl Health Econ Health Policy 2013;11:53-63
- McEwan P, Ward T, Webster S, et al. Estimating the long-term clinical and economic outcomes of daclatasvir plus asunaprevir in difficult-to-treat Japanese patients chronically infected with hepatitis C genotype 1b. Value Health Region Iss 2014;3:136-45
- McEwan P, Ward T, Yuan Y, et al. The impact of timing and prioritization on the cost-effectiveness of birth cohort testing and treatment for hepatitis C virus in the United States. Hepatology 2013;58:54-64
- McEwan P, Ward T, Chen C-J, et al. Estimating the incidence and prevalence of chronic hepatitis C infection in Taiwan using back projection. Value Health Region Iss 2014;3:5-11
- McEwan P, Ward T, Bennett H, et al. Estimating the clinical and economic benefit associated with incremental improvements in sustained virologic response in chronic hepatitis C. PLoS One 2015 Jan 30;10:e0117334
- Annemans L, Warie H, Nechelput M, et al. A health economic model to assess the long term effects and cost-effectiveness of PEG IFN alpha-2a in hepatitis C virus infected patients. Acta Gastro-enterol Belg 2004;67:1-8
- Buti M, Casado MA, Fosbrook L, et al. Cost-effectiveness of combination therapy for naive patients with chronic hepatitis C. J Hepatol 2000;33:651-8
- Hornberger J, Farci P, Prati D, et al. The economics of treating chronic hepatitis C patients with peginterferon alpha-2a (40 kDa) plus ribavirin presenting with persistently normal aminotransferase. J Viral Hepat 2006;13:377-86
- Ishida H, Inoue Y, Wong JB, et al. Cost-effectiveness of ribavirin plus interferon alpha-2b for either interferon relapsers or non-responders in chronic hepatitis C: a Japanese trial. Hepatol Res 2004;28:125-36
- Siebert U, Sroczynski G, Rossol S, et al. Cost effectiveness of peginterferon alpha-2b plus ribavirin versus interferon alpha-2b plus ribavirin for initial treatment of chronic hepatitis C. Gut 2003;52:425-32
- National Institue for Health and Care Excellence. Technology appraisal TA252: Telaprevir for the treatment of genotype 1 chronic hepatitis C; 2012 [updated November 2013]. http://guidance.nice.org.uk/TA252. Accessed January 2014
- McGarry LJ, Pawar VS, Panchmatia HR, et al. Economic model of a birth cohort screening program for hepatitis C virus. Hepatology 2012;55:1344-55
- US Centers for Disease Control (CDC). Viral hepatitis statistics and surveillance: Table 4.4 reported cases of laboratory-confirmed, hepatitis C (past or present) infection, by sex, race/ethnicity, age group, and positive lab tests; 2011. http://www.cdc.gov/hepatitis/Statistics/2011Surveillance/Table4.4.htm. Accessed January 26, 2016
- Martin NK, Vickerman P, Miners A, et al. Cost‐effectiveness of hepatitis C virus antiviral treatment for injection drug user populations. Hepatology 2012;55:49-57
- Thein HH, Yi Q, Dore GJ, et al. Estimation of stage-specific fibrosis progression rates in chronic hepatitis C virus infection: a meta-analysis and meta-regression. Hepatology 2008;48:418-31
- Townsend R, McEwan P, Kim R, et al. Structural frameworks and key model parameters in cost-effectiveness analyses for current and future treatments of chronic hepatitis C. Value Health J Int Soc Pharmacoeconom Outcomes Res 2011;14:1068-77
- Coffin PO, Scott JD, Golden MR, et al. Cost-effectiveness and population outcomes of general population screening for hepatitis C. Clin Infect Dis Offic Publ Infect Dis Soc Am 2012;54:1259-71
- Ferrante SA, Chhatwal J, Brass CA, et al. Boceprevir for previously untreated patients with chronic hepatitis C Genotype 1 infection: a US-based cost-effectiveness modeling study. BMC Infect Dis 2013;13:190
- Javanbakht M, Mirahmadizadeh A, Mashayekhi A. The long-term effectiveness of methadone maintenance treatment in prevention of hepatitis C virus among illicit drug users: a modeling study. Iran Red Crescent Med J 2014;16:e13484
- The United States of America, Life tables (period 1x1), per gender [updated 16 Nov 2012]. http://www.mortality.org/hmd/USA/STATS/fltper_1x1.txt. Accessed August 2015
- Zeuzem S, Dusheiko GM, Salupere R, et al. Sofosbuvir and ribavirin in HCV genotypes 2 and 3. N Engl J Med 2014;370:1993-2001
- Swallow E, Song J, Yuan Y, et al. Daclatasvir + sofosbuvir versus standard of care for hepatitis C genotype 3: a matching-adjusted indirect comparison. J Comparative Effectiveness Res 2016;5:129-39
- Health Analytics database, Market shares utilization data for Copegus, Rebetol, RibaPak, Ribasphere and Ribavirin in the United States, 2014
- Buikema AR, Rosenblatt LC, Liu F, et al. Burden of side effects associated with treatment of hepatitis C. Poster # 964. American Association for the Study of Liver Diseases (AASLD), 65th Annual Meeting; November 7–11, 2014
- American Association for the Study of Liver Disease (AASLD). Recommendations for testing, managing, and treating hepatitis C; Revised date: August 11, 2014. http://www.hcvguidelines.org. Accessed October 2014
- Davis KL, Mitra D, Medjedovic J, et al. Direct economic burden of chronic hepatitis C virus in a United States managed care population. J Clin Gastroenterol 2011;45:e17-24
- McAdam-Marx C, McGarry LJ, Hane CA, et al. All-cause and incremental per patient per year cost associated with chronic hepatitis C virus and associated liver complications in the United States: a managed care perspective. J Manag Care Pharm 2011;17:531-46
- Bureau of Labor Statistics. All urban consumers (current series), Health CPI, Series ID: CUSR0000SAM, Area: U.S. city average, Item: Medical care; 2004–2014. Washington, DC: Bureau of Labor Statistics. http://stats.bls.gov/home.htm. Accessed October 2, 2014
- Younossi ZM, Stepanova M, Cure S, et al. Estimating health status using EQ-5D for CHRONIC HEPatitis C (CH-C) patients treated with sofosbuvir containing regimens. 49th Annual Meeting of the European Association for the Study of the Liver (EASL); April 9–13, 2014
- Time Preference. By Lipscomb J, Weinstein MC, Torrance GW. In Cost-effectiveness in Health and Medicine. By Gold MR, Siegel JE, Russell LB, Weinstein MC (eds). New York: Oxford University Press, 1996
- McEwan P, Ward T, Chen C-J, et al. Estimating the incidence and prevalence of chronic hepatitis C infection in Taiwan using back projection. Value Health Region 2014;3C:5-11
- Najafzadeh M, Andersson K, Shrank WH, et al. Cost-effectiveness of novel regimens for the treatment of hepatitis C virus. Ann Intern Med 2015;162:407-19
- McEwan P, Webster S, Ward T, et al. Estimating the cost-effectiveness of daclatasvir regimens for patients with advanced chronic hepatitis C in the UK. International Society for Pharmacoeconomics and Outcomes Research (ISPOR), 20th Annual Meeting; May 16–20, 2015
- McEwan P, Ward T, Webster S, et al. Estimating the cost-effectiveness of 12 weeks of daclatasvir + sofosbuvir in patients chronically infected with HCV genotype 3. International Society for Pharmacoeconomics and Outcomes Research (ISPOR), 20th Annual Meeting; May 16–20, 2015
- Moshyk A, Martel MJ, Tahami Monfared AA, et al. Cost-effectiveness of daclatasvir plus sofosbuvir-based regimen for treatment of hepatitis C virus genotype 3 infection in Canada. J Med Econ. 2016;19:181-92
- Foster GR, Afdhal N, Roberts SK, et al. Sofosbuvir and velpatasvir for HCV genotype 2 and 3 infection. N Engl J Med 2015;373:2608-17
- American Association for the Study of Liver Disease (AASLD). Recommendations for testing, managing, and treating hepatitis C; Updated July 6, 2016. www.hcvguidelines.org. Accessed March 2017
- Truven Health Analytics Inc. RED BOOK Online?, http://sites.truvenhealth.com/redbook/index.html. Accessed July 2014
- Centers for Medicare and Medicaid Services (CMS), Clinical Laboratory Fee Schedule, National Limit Payment. https://www.cms.gov/medicare/medicare-fee-for-service-payment/clinicallabfeesched/clinlab.html. Accessed January 2016
- Centers for Medicare and Medicaid Services (CMS), Physician Fee Schedule, National payment amount by CPT code. https://www.cms.gov/Medicare/Medicare-Fee-for-Service-Payment/PhysicianFeeSched/PFS-Federal-Regulation-Notices-Items/CMS-1600-FC.html. Accessed January 2016
- Centers for Medicare and Medicaid Services (CMS), Hospital Outpatient PPS File, Payment rate by HCPCS code, 2014