
Abstract
Aims: This study investigated the cost-effectiveness of buprenorphine maintenance treatment (BMT) and methadone maintenance treatment (MMT) vs no opioid substitution therapy (OST) for the treatment of opioid use disorder, from the UK National Health Service (NHS)/personal social services (PSS) and societal perspectives over 1 year.
Methods: Cost-effectiveness of OST vs no OST was evaluated by first replicating and then expanding an existing UK health technology assessment model. The expanded model included the impact of OST on infection rates of human immunodeficiency virus (HIV) and hepatitis C virus (HCV) infection.
Results: Versus no OST, incremental cost-effectiveness ratios (ICERs) for BMT and MMT were £13,923 and £14,206 per quality-adjusted life year (QALY), respectively, from a NHS/PSS perspective. When total costs (NHS/PSS and societal) are considered, there are substantial savings associated with adopting OST; these savings are in excess of £14,032 for BMT vs no OST and £17,174 for MMT vs no OST over 1 year. This is primarily driven by a reduction in victim costs. OST treatment also impacted other aspects of criminality and healthcare resource use.
Limitations: The model’s 1-year timeframe means long-term costs and benefits, and the influence of changes over time are not captured.
Conclusions: OST can be considered cost-effective vs no OST from the UK NHS/PSS perspective, with a cost per QALY well below the UK’s willingness-to-pay threshold. There were only small differences between BMT and MMT. The availability of two or more cost-effective options is beneficial to retaining patients in OST programs. From a societal perspective, OST is estimated to save over £14,032 and £17,174 per year for BMT and MMT vs no OST, respectively, due to savings in victim costs. Further work is required to fully quantify the clinical and health economic impacts of different OST formulations and their societal impact over the long-term.
Introduction
Addiction can have a significant impact in some communities. There are an estimated 122,894 injecting drugs users (95% CI = 117,370–131,869), or 3.0 per 1,000 inhabitants aged 15–64 (95% CI = 2.87–3.22) in the UKCitation1 and 1.3 million in EuropeCitation2. Effective treatment for opioid use disorder is likely to be long-term, and comprise psychological and behavioral assistance that can be supplemented with pharmacological interventions including opioid substitution therapy (OST) with methadone, buprenorphine (generic and Subutex), or buprenorphine/naloxone (Suboxone)Citation3,Citation4.
Intravenous illicit heroin use is associated with a risk of overdose and of transmission of infectious diseasesCitation4. Therefore, drug policies are often aimed at reducing the morbidity and mortality associated with problematic drug consumptionCitation4, and effective OST programs can lead to reduced rates of problem heroin useCitation5,Citation6. Additionally, there is compelling evidence that, among people infected with human immunodeficiency virus (HIV), OST can help recruitment onto, and adherence to, antiretroviral therapyCitation7.
When appraising new healthcare interventions, there is often a requirement for evidence of their cost effectiveness to inform the resource allocation decision-making processCitation8. This may require the development of health economic models. A recent systematic review of economic models that have been used in appraising OST revealed a limited number of models in the peer-reviewed literature, and no clear consensus to modeling approachesCitation9. To explore this area further, we replicated an existing health technology assessment (HTA) model developed by Connock et al.Citation10, and updated the model using 2016 costs. As studies have demonstrated that OST can reduce risk behaviors and HIV transmissionCitation4, we expanded the model to include the impact of HIV and/or hepatitis C virus (HCV) infection. Using the model, we investigated the cost-effectiveness of buprenorphine maintenance treatment (BMT) and methadone maintenance treatment (MMT) vs no OST, from UK National Health Service (NHS)/personal social services (PSS) and societal perspectives (the societal perspective included criminal justice costs as well as victim costs). Finally, we prepared an open source version of the model using R version 3.2.3, which is available to other investigators to review and further develop.
Methods
To study the cost-effectiveness of OST vs no OST, we began by replicating the cost-effectiveness model developed by Connock et al.Citation10. This model was chosen because it was originally developed to assess the cost-effectiveness of BMT compared to MMT, as part of a UK HTA. It was also sufficiently well documented in terms of structure and data sources to allow us to use that information to construct our own model.
Once replicated, we updated the model to include 2016 prices for each cost parameter and expanded it to include the impact of infection with HIV and/or HCV. We then used the model to evaluate the cost-effectiveness of BMT and MMT (generics) vs no OST from both NHS/PSS and societal perspectives.
Replicating the original model
We replicated the original decision tree model outlined in Connock et al.Citation10 (). The model follows patients for 1 year. The main parameter of interest is retention in treatment. At 2, 6, 13, 25, and 52 weeks, patients are either retained in treatment or they drop out. At each of these time-points a utility value and cost are applied. Retention in treatment was derived from generating a survival curve for BMT, based on a Cochrane systematic review of flexible dose regimens comparing BMT and MMT, then applying the hazard ratio for the difference in retention between BMT and MMT to derive the MMT survival curve. Additional input parameters for level and nature of drug misuse and utility values are outlined in . Both NHS/PSS and societal (criminal justice system and victims of crime) resource use and costs (2004) were included. The model used UK information, where available, otherwise data from England and Wales were used.
Figure 1. Decision tree model structure (adapted from Connock et al.Citation10).
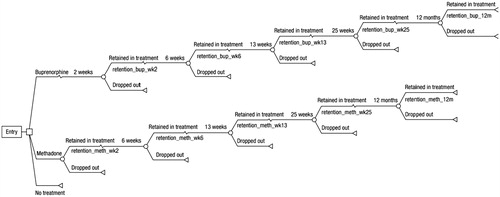
Table 1. Level and nature of drug misuse and utility values (derived from Connock et al.Citation10).
The model was replicated in Microsoft Excel, which was selected instead of the TreeAge software used in the original publication because it is more widely available and easier to validate. The National Institute for Health and Care Excellence (NICE) Decision Support Unit considers both packages to be suitableCitation11. The replicated model was then run using the same data inputs for resources and costs as published in the original reportCitation10. Where data inputs were not fully described in the original report, we tested a number of potential assumptions to identify the one that most closely replicated the outputs from the original model. The replicated model was run with the same 1-year time horizon as the original Connock et al.Citation10 model.
The comparison of results of our replicated model with the original Connock et al.Citation10 model is outlined in . There were a number of potential reasons for the small differences that are outlined in the discussion. However, we were confident that we had replicated the original model as closely as possible, with the difference in cost no more than £271 and in quality-adjusted life years (QALYs) of 0.0001.
Table 2. Comparison of Connock et al.Citation10 model, with the replicated model results (2004 costs).
Updating inputs
Cost parameters were updated to 2016, either by sourcing new data or uprating the original values using the relevant price index (). In terms of drug costs, the original Connock et al.Citation10 model included the price for branded buprenorphine; however, as generic buprenorphine is now available, we used the generic price as the base case value.
Table 3. Resource use (derived from the Connock et al.Citation10) and costs (2016 values).
Expanded model
In terms of inputs, the model was expanded to include HIV and/or HCV infection rates and associated costs and utilities, sourced from UK data, where available, otherwise data from England and Wales were used (). Patients enter the model with a prevalence of HIV and/or HCV. Once the patients enter the model, an incidence of HIV and/or HCV is applied to all patients without the disease based on drug misuse status and then added to the background prevalence. These figures are used to derive the proportion of patients with/without HIV and/or HCV in the OST and no OST arms. It is assumed that the prevalence/incidence rates of HIV among drug misusers who inject and drug misusers who don’t inject is the same based on several observational studies of drug misusers in treatment programsCitation12. Direct costs and utility decrements associated with the disease were applied ().
Table 4. Expanded model inputs.
In terms of outputs, the model included the impact of retention on a number of healthcare resources and non-clinical outcomes over a 1-year time horizon, which were drawn from the original work by Connock et al.Citation10 and the self-reported National Treatment Outcome Research Study (NTORS) studyCitation13–16. Outcomes reported included healthcare resource use (general practitioner [GP] visits, rates of accident and emergency [A&E] visits, inpatient hospital stays, out-patient mental health visits and inpatient mental health visits) and contacts with the criminal justice system (rates of drug arrests, acquisitive crime arrests, court appearances, and average time held in police custody (nights), and time spent in prison per year), as well as annual victim costs.
A model using R code was developed, and the outputs were validated against the Excel model to check for robustness. A publicly open source version of the model can be found in the supplementary files.
Sensitivity analyses
The deterministic sensitivity analysis tested the robustness of the model by varying certain parameters. We evaluated the impact of unit drug price on cost-effectiveness by determining the cost at which the incremental cost-effectiveness ratio (ICER) exceeded the threshold set by NICE (£30,000 per QALY). We also assessed the impact of branded buprenorphine (Subutex) and the branded combination of buprenorphine and naloxone (Suboxone) on the ICER. In the absence of long-term comparative clinical data demonstrating a difference between Subutex and Suboxone retention rates, we made the conservative assumption that they were the same, based on a short-term randomized controlled trialCitation17. Additionally, we investigated the impact of removing victim costs from the overall economic societal costs. Probabilistic sensitivity analysis were conducted for BMT and MMT vs no OST. The results are presented in the form of cost-effectiveness planes and cost-effectiveness acceptability curves (CEACs) of incremental costs and outcomes to evaluate the uncertainty in results due to statistical variability around the parameter estimates. The cost-effectiveness plane graphically illustrates the ICER of multiple probabilistic simulations of a strategy. The CEAC curves use probabilistic simulations to demonstrate the likelihood a strategy is cost-effective at different threshold values of willingness-to-pay for an additional QALY.
Results
Impact of treatment vs no OST
We applied the replicated and expanded cost-effectiveness model to the use of either BMT or MMT vs no OST in the management of opioid use disorder. From a NHS/PSS perspective, vs no OST, OST is cost-effective, with ICERs of £13,923/QALY for BMT and £14,206/QALY for MMT (), i.e. OST offers incremental health benefits (QALY increase) over no OST at a modest expenditure on drugs.
Table 5. Results of the cost-effectiveness analysis.
When total costs (NHS/PSS and societal) are considered, there are substantial savings associated with adopting OST, in excess of £14,032 for BMT vs no OST and £17,174 for MMT vs no OST (). For the two treatment arms, the total societal costs (which include criminal justice system and victim costs) are £55,243 and £52,100 for BMT and MMT, respectively, vs £69,274 for those not on treatment. Therefore, from a societal perspective, BMT and MMT offer both clinical improvement and substantial cost savings, i.e. they are dominant over the “no OST” scenario.
The results of our modeling exercise suggest that MMT may be associated with marginally better reductions in societal costs compared to BMT. This is based on minimal differences in the clinical efficacy in the input data used. A recent systematic review concluded that BMT and MMT may be equally effective from a clinical perspectiveCitation18. Nonetheless, from both NHS/PSS and societal perspectives, the differences in costs between BMT and MMT are small compared to those between OST and no OST.
Impact of intervention on healthcare resources
Over the cycle of the model, OST results in a modest increase in GP and A&E visits, as well as inpatient hospitalizations (). On the other hand, there is a substantial decrease in the use of in- and out-patient mental health resources. It should be noted that these data only applied to 1 year of OST, and the model was not extended to determine the long-term impact of OST on healthcare resource use.
Table 6. Impact of OST on healthcare resource and non-clinical outcomes.
Impact of intervention on non-clinical outcomes
The impact of OST on societal cost drivers is outlined in . The greatest impact of OST is on the reduction in victim costs. The annual victim costs for a patient not in treatment is £48,546, compared to £32,824 for BMT and £29,282 for MMT. Using self-reported data from the NTORSCitation10,Citation14, it appears that the rate of drug arrests and acquisitive crime arrests are higher during the first year of OST in individuals in OST programs, compared to rates for those not in treatment. Other aspects of involvement with the criminal justice system, including time in custody, court appearances, and time in prison, are slightly lower or unaffected by OST in the first 12 months of OST compared with no OST.
Sensitivity analysis
The deterministic sensitivity analysis evaluated the impact of unit drug price on cost effectiveness, as well as the impact of victim costs on overall economic societal burden.
Assuming a cost-effectiveness threshold of £30,000/QALY, we evaluated the cost point of OST at which it would no longer be considered cost-effective by NICE. With all other parameters unchanged, an ICER of £30,000/QALY would be associated with an increase of unit costs of 14-fold and 12-fold for BMT and MMT, respectively. Use of Subutex or Suboxone (price is the same), rather than generic buprenorphine, would increase the ICER to £20,963/QALY (NHS/PSS perspective).
Victim costs were by far the biggest driver of societal costs. When they are removed from the model, both BMT and MMT were no longer dominant over no OST, and had an ICER of £32,871 and £33,154 per QALY, respectively.
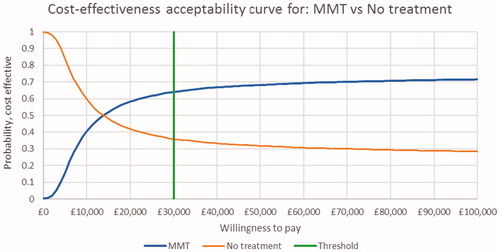
The probabilistic sensitivity analysis for BMT and MMT vs no OST are presented in the form of cost-effectiveness planes in and and CEACs in and . The cost-effectiveness plane for BMT and MMT indicate that nearly all simulations were costlier than no OST, with the majority having a positive impact on QALYs. These results were consistent with the result of the base case. The CEAC curves indicate that there is a 64% probability that both BMT and MMT are cost-effective at a threshold of £30,000/QALY.
Figure 2. Incremental cost-effectiveness plane for BMT vs No OST. BMT, buprenorphine maintenance treatment; OST: opioid substitution therapy.
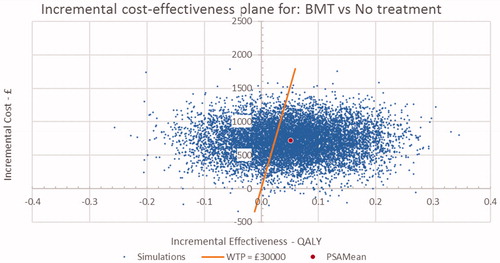
Figure 3. Incremental cost-effectiveness plane for MMT vs No OST. MMT, methadone maintenance treatment; OST: opioid substitution therapy.
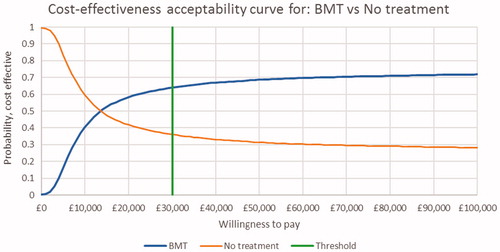
Figure 4. Cost-effectiveness acceptability curve for BMT vs No OST. BMT, buprenorphine maintenance treatment; OST: opioid substitution therapy.
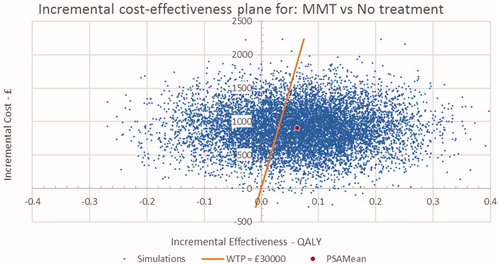
Figure 5. Cost-effectiveness acceptability curve for MMT vs No OST. MMT, methadone maintenance treatment; OST: opioid substitution therapy.
Discussion
We evaluated the cost-effectiveness of OST (MMT and BMT) vs no OST from both NHS/PSS and societal perspectives. From the NHS/PSS perspective, the ICERs for BMT (£13,923 per QALY vs no OST) and MMT (£14,206 per QALY vs no OST) were well below the UK NICE willingness-to-pay threshold (£30,000). From a non-NHS/PSS perspective, adoption of either form of OST would result in considerable savings due to a substantial reduction in victim-related costs (total cost savings of £14,032 and £17,174 per year for BMT and MMT vs no OST, respectively).
We were able to almost exactly replicate the Connock et al.Citation10 results in our model. There were some slight differences, with most of the variance being accounted for by rounding effects, differences between TreeAge and Excel, half-cycle corrections and dosing information, uncertainty regarding doses per day, resource use was presented in months but cycle times were in weeks, and possible double counting of unsupervised dispensing over the first 6 months in the original model.
Demonstrating the cost-effectiveness of OST interventions will be important to aid healthcare decision-making in some countries. Using the replicated and expanded model, we demonstrated from the NHS/PSS perspective that both MMT and BMT are cost-effective, compared with no OST, within the ICER limits set by NICE in the UKCitation19. The cost-effectiveness was similar for both forms of intervention, helping to support the observations elsewhere that availability of more than one intervention is important to help maximize retention in OSTCitation3,Citation18,Citation20,Citation21. Additionally, our evaluation of the role of unit drug cost on the ICER indicates that the cost/mg can increase by up to 14-times before OST is no longer cost-effective.
As observed by the World Health OrganizationCitation3, methadone is often favored over buprenorphine. However, there may be times when buprenorphine is preferred as first-line OST, for example as a result of contraindications to methadone or patient preference due to adverse eventsCitation3,Citation20,Citation21. The Australian government identifies the following as drivers of preference for buprenorphine over methadone: individual differences in pharmacokinetic and pharmacodynamics, side-effects (in particular the sedative effects of methadone), and treatment flexibility due to milder withdrawal symptoms compared with those for methadoneCitation21. Slow-release oral morphine is another option for intervention that appears to be at least as effective as methadone, with positive effects on heroin use, mental symptoms, and patient-reported outcomes including heroin craving and treatment satisfactionCitation22–25.
The impact of opioid use disorder extends beyond the healthcare systemCitation13,Citation15. In the original Connock et al.Citation10 model, victim-related costs were mainly drawn from the reported patterns of offences from the NTORSCitation14, combined with estimates of the costs of crime from published literature to arrive at an estimate for the annual victim costs for drug users in treatment and for drug users not in treatment. These consisted of both costs incurred in anticipation of crime, e.g. installation of burglar alarms, as well as direct costs such as material or physical damage or loss. We found that there is a substantial economic benefit from the societal perspective that is greater than the investment needed in OST with methadone or buprenorphine. Recreating the analysis by Connock et al.Citation10, omission of victim costs results in the loss of substantial cost savings to society, demonstrating that victim costs are the key driver of overall societal burden of heroin addiction. In this context, it is clear that a reduction in drug-related crime should be considered an important outcome of interventionsCitation13.
We also demonstrated an impact of OST on other non-clinical outcomes. In some cases there were reductions, whereas in others there was a small increase during the first year of OST, and there were some differences between MMT and BMT. Consequently, there is no clear interpretation of the impact of MMT and BMT on non-clinical outcomes. Given the scale of potential savings by adopting OST, there is a need to fully understand the societal impact of OST. This will likely require real-world evidence studies to inform future health economic models.
We consider the development of the model a step forward in providing researchers a methodology for testing the cost-effectiveness of OST formulations. However, further work is required to develop the model fully, principally due to the limited data in this areaCitation9. Additionally, future models should include a more comprehensive consideration of the economic and societal consequences (including victim costs) of heroin useCitation9.
This study has several limitations. First, our model is limited to a 1-year time horizon; therefore, the beneficial impact of OST on longer-term outcomes (e.g. mortality) have not been included, and those that have been included (e.g. HIV/HCV infection rates, healthcare, and criminal justice resource use) are likely to demonstrate greater impacts over a lifetime. This would lead to even lower ICERs compared to no OST. To fully capture all the costs and benefits associated with OST (e.g. impact on risk behaviors, HIV transmission, overdoses, and mortality) requires a lifetime horizon. A lifetime model would require data on longer-term retention rates that could be extrapolated with a high degree of confidence and a better understanding of re-admission to treatment post-dropping out. It would also require the use of a different model structure (e.g. Markov Model) that supports analyses over a lifetime.
Second, the impact of OST on income loss (as a result of premature death) or productivity losses (employment status, absenteeism, presenteeism) have not been included in the model and would be important to include in a longer-term model. Third, adverse events were not included. Fourth, as our model (as with any model) is a simplification of the real world we accept that there is likely to be a degree of regional variability around some of the estimates (for example frequency, type and cost of dispensing, and supervision). Such variability was assessed in the sensitivity analysis, and could be further explored in future regional level models.
Finally, there is a requirement to generate health-state-specific utility values for HIV and HCV. This could be achieved either as part of a clinical study or using a panel such as the one used for the utility values in the original modelCitation8,Citation10.
Conclusions
Using the cost-effectiveness model we replicated and expanded, we have demonstrated that OST is cost-effective vs no OST, and offers substantial societal benefits in terms of reduced victim costs. The availability of multiple, cost-effective treatment options is important to help meet requirements and preferences for patients when selecting an intervention for OST to improve outcomes in line with expert guidanceCitation3,Citation18,Citation21. Further work is required to understand the long-term cost-effectiveness of OST, including the generation of new data for resource use, criminality, and mortality. The availability of this model code in an open source format (R version 3.2.3) should make future collaborative research more straightforward, accurate, and comprehensive.
Transparency
Declaration of funding
Funding for this research was provided by Mundipharma International Limited, Cambridge, UK.
Declaration of financial/other interests
JK and WD are employees of Mundipharma International Limited, Cambridge, UK. AW, YY, JB, and AMM were employed by PHMR, which was contracted by Mundipharma International Limited to undertake this research. Peer reviewers on this manuscript have received an honorarium from JME for their review work, but have no other relevant financial relationships to disclose.
| Abbreviations | ||
| A&E | = | accident and emergency |
| BMT | = | buprenorphine maintenance treatment |
| BNF | = | British National Formulary |
| CEAC | = | cost-effectiveness acceptability curve |
| CPI | = | consumer price index |
| GP | = | general practitioner |
| HCHS | = | Hospital and Community Health Services |
| HCV | = | hepatitis C virus |
| HIV | = | human immunodeficiency virus |
| HTA | = | health technology assessment |
| ICER | = | incremental cost-effectiveness ratio |
| MMT | = | methadone maintenance treatment |
| NHS | = | National Health Service |
| NICE | = | National Institute for Health and Care Excellence |
| NTORS | = | National Treatment Outcome Research Study |
| ONS | = | Office for National Statistics |
| OST | = | opioid substitution therapy |
| PSNC | = | Pharmaceutical Services Negotiating Committee |
| PSS | = | personal social services |
| QALY | = | quality-adjusted life year |
| UK | = | United Kingdom |
Read_Me_decision_tree.txt
Download Text (3.1 KB)DecisionTree_2017March_v3_Rinput_Utilities.csv
Download Comma-Separated Values File (294 B)DecisionTree_2017March_v3_Rinput_maintDoses.csv
Download Comma-Separated Values File (300 B)DecisionTree_2017March_v3_Rinput_EffRetention.csv
Download Comma-Separated Values File (1.4 KB)DecisionTree_2017March_v3_Rinput_DataDictionary.csv
Download Comma-Separated Values File (6.2 KB)DecisionTree_2017March_v3.R
Download R Objects File (27.2 KB)20170310_ResultsTable_costsFor_2016_duration_1_Year_HIVHCV_Included_.csv
Download Comma-Separated Values File (2.1 KB)20170310_NoTreatment_DecisionTreeTable_2016_HIVHCV_Included_.csv
Download Comma-Separated Values File (1.2 KB)20170310_Methadone_DecisionTreeTable_2016_HIVHCV_Included_.csv
Download Comma-Separated Values File (5.1 KB)20170310_Buprenorphine_DecisionTreeTable_2016_HIVHCV_Included_.csv
Download Comma-Separated Values File (5.1 KB)Acknowledgments
The authors thank David Floyd and Ciara Wright for editorial assistance on behalf of PHMR Ltd. Preparation of the manuscript was funded by Mundipharma International Limited.
Related Research Data
References
- European Monitoring Centre for Drugs and Drug Addiction. United Kingdom country overview. 2016. http://www.emcdda.europa.eu/countries/united-kingdom#prevalence. Last accessed March 17, 2017
- European Monitoring Centre for Drugs and Drug Addiction. European drug report 2016: trends and developments. Luxembourg: European Monitoring Centre for Drugs and Drug Addiction; 2016
- World Health Organization. Guidelines for the psychosocially assisted pharmacological treatment of opioid dependence. Geneva: WHO; 2009
- European Monitoring Centre for Drugs and Drug Addiction. The state of the drugs problem in Europe. Annual report 2011. Luxembourg: European Monitoring Centre for Drugs and Drug Addiction; 2011
- Nielsen S, Larance B, Degenhardt L, et al. Opioid agonist treatment for pharmaceutical opioid dependent people. Cochrane Database Syst Rev 2016;CD011117
- Timko C, Schultz NR, Cucciare MA, et al. Retention in medication-assisted treatment for opiate dependence: A systematic review. J Addict Dis 2016;35:22-35
- Low AJ, Mburu G, Welton NJ, et al. Impact of opioid substitution therapy on antiretroviral therapy outcomes: a systematic review and meta-analysis. Clin Infect Dis 2016;63:1094-104
- Cooper N, Coyle D, Abrams K, et al. Use of evidence in decision models: an appraisal of health technology assessments in the UK since 1997. J Health Serv Res Policy 2005;10:245-50
- Chetty M, Kenworthy JJ, Langham S, et al. A systematic review of health economic models of opioid agonist therapies in maintenance treatment of non-prescription opioid dependence. Addict Sci Clin Pract 2017;12:6
- Connock M, Juarez-Garcia A, Jowett S, et al. Methadone and buprenorphine for the management of opioid dependence: a systematic review and economic evaluation. Health Technol Assess 2007;11:1-171, iii–iv
- Tosh J, Wailoo A. Review of software for decision modelling. 2008. http://www.nicedsu.org.uk/PDFs of reports/softwarereport-final.pdf. Accessed 3rd March 2017
- Strathdee SA, Stockman JK. Epidemiology of HIV among injecting and non-injecting drug users: current trends and implications for interventions. Curr HIV/AIDS Rep 2010;7:99-106
- Gossop M. The National Treatment Outcomes Research Study (NTORS) and its influence on addiction treatment policy in the United Kingdom. Addiction 2015;110:50-3
- Godfrey C, Eaton G, McDougall C, et al. Home Office Research Study 249: The economic and social costs of Class A drug use in England and Wales, 2000. London: Development and Statistics Directorate; 2002
- Gossop M, Marsden J, Stewart D, et al. The National Treatment Outcome Research Study (NTORS): 4–5 year follow-up results. Addiction 2003;98:291-303
- Gossop M, Marsden J, Stewart D, et al. Substance use, health and social problems of service users at 54 drug treatment agencies. Intake data from the National Treatment Outcome Research Study. Br J Psychiatry 1998;173:166-71
- Webster L, Hjelmström P, Sumner M, et al. Efficacy and safety of a sublingual buprenorphine/naloxone rapidly dissolving tablet for the treatment of adults with opioid dependence: A randomized trial. J Addict Dis 2016;35:325-38
- Nielsen S, Larance B, Degenhardt L, et al. Opioid agonist treatment for pharmaceutical opioid dependent people. Cochrane Database Syst Rev 2016;CD011117
- McCabe C, Claxton K, Culyer AJ. The NICE cost-effectiveness threshold: What it is and what that means. Pharmacoeconomics 2008;26:733-44
- Yarborough BJH, Stumbo SP, McCarty D, et al. Methadone, buprenorphine and preferences for opioid agonist treatment: A qualitative analysis. Drug Alcohol Depend 2016;160:112-18
- Gowing L, Ali R, Dunlop A, et al. National guidelines for medication-assisted treatment of opioid dependence. 2014. Commonwealth of Australia, Canberra
- Ferri M, Minozzi S, Bo A, et al. Slow-release oral morphine as maintenance therapy for opioid dependence. Cochrane Database Syst Rev 2013;CD009879
- Beck T, Haasen C, Verthein U, et al. Maintenance treatment for opioid dependence with slow-release oral morphine: A randomized cross-over, non-inferiority study versus methadone. Addiction 2014;109:617-26
- Falcato L, Beck T, Reimer J, et al. Self-reported cravings for heroin and cocaine during maintenance treatment with slow-release oral morphine compared with methadone. J Clin Psychopharmacol 2015;35:150-7
- Verthein U, Beck T, Haasen C, et al. Mental symptoms and drug use in maintenance treatment with slow-release oral morphine compared to methadone: results of a randomized crossover study. Eur Addict Res 2015;21:97-104
- National Health Service Business Services Authority. NHS Prescription Services. 2016. http://www.nhsbsa.nhs.uk/PrescriptionServices.aspx. Accessed 7th March 2017
- British Medical Association, Royal Pharmaceutical Society. British National Formulary (BNF) 67. June. London: BMJ Group and Pharmaceutical Press; 2016
- Pharmaceutical Services Negotiating Committee. Fees and allowances 2016. http://psnc.org.uk/dispensing-supply/endorsement/fees-allowances/. Accessed 16th March 2017
- Thurrock Council. Supervised Consumption Primary Care Contact. 2016; https://www.thurrock.gov.uk/information-for-gps-and-pharmacies/supervised-consumption-primary-care-contracts. Accessed 3rd March 2017
- Curtis L. Unit costs of health and social care 2016. Canterbury: Persional Social Services Research Unit; 2016
- Department of Health. National schedule of reference costs (2015–2016). https://www.gov.uk/government/publications/nhs-reference-costs-2015-to-2016. Accessed 7th March 2017
- Office for National Statistics. Consumer price inflation, September 2016. https://www.ons.gov.uk/economy/inflationandpriceindices/bulletins/consumerpriceinflation/sept2016. Accessed 7th March 2017
- Public Health England. Data tables of the unlinked anonymous monitoring survey of HIV and hepatitis in people who inject drugs. Surveillance update: July 2016. London: Public Health England; 2016
- Home Office. Drug misuse: findings from the 2015 to 2016 CSEW: data tables. 2016. https://www.gov.uk/government/statistics/drug-misuse-findings-from-the-2015-to-2016-csew. Accessed 3rd March 2017
- Office for National Statistics. Annual mid-year population estimates: mid 2015. Accessed 16th March 2017
- Public Health England. HIV diagnoses, late diagnoses and numbers accessing treatment and care: 2016 report. London: Public Health England; 2016
- Public Health England. Hepatitis C in the UK 2016 report. London: Public Health England; 2016
- Mandalia S, Mandalia R, Lo G, et al. Rising population cost for treating people living with HIV in the UK, 1997–2013. PLoS One 2010;5:e1577
- National Institute of Health and Care Excellence. Peginterferon alfa and ribavirin for chronic hepatitis C in patients eligible for shortened treatment, re-treatment or in HCV/HIV co-infection: a systematic review and economic evaluation. Southampton: NIHCE; 2009
- Messina JP, Humphreys I, Flaxman A, et al. Global distribution and prevalence of hepatitis C virus genotypes. Hepatology 2015;61:77-87
- Campos NG, Salomon JA, Servoss JC, et al. Cost-effectiveness of treatment for hepatitis C in an urban cohort co-infected with HIV. Am J Med 2007;120:272-9
- Barclay ST, Cooke GS, Holtham E, et al. A new paradigm evaluating cost per cure of HCV infection in the UK. Hepatol Med Policy 2016;1:2
- Zaric GS, Barnett PG, Brandeau ML. HIV transmission and the cost-effectiveness of methadone maintenance. Am J Public Health 2000;90:1100-11
- Ara R, Wailoo A. NICE DSU technical support document 12: the use of health state utility values in decision models. Sheffield; 2011. Decision Support Unit. School of Health and Related Research, University of Sheffield, UK
- Mrus JM, Sherman KE, Leonard AC, et al. Health values of patients coinfected with HIV/hepatitis C: are two viruses worse than one? Med Care 2006;44:158-66