
Cost-effectiveness (CE) models are being developed and employed with increasing frequency to help determine the relative value of healthcare treatments and services, and to inform efforts to improve care value. Often, different published models yield a wide range of CE estimates for the same technology or service. For example, six CE analyses of PCSK9 inhibitors published between November 2015 and January 2017Citation1–6, which included patients with varying risk profiles, have yielded widely varying estimates of the CE of PCSK9 inhibitors—ranging from $120,000–$350,000 per quality adjusted life year (QALY).
While CE models rarely yield identical results, guidelines for conducting CE analysesCitation7 suggest that the variation in CE of PCSK9 inhibitors is larger than it should be. In particular, CE studies of PCSK9 inhibitors share many methodologic similarities—for example, similar estimates of relative risk reduction due to PCSK9 inhibitors treatment. However, published CE estimates markedly differ. These findings prompt an important and obvious question: what is driving these differences?
The primary driver seems to be variation in assumptions about the risk of cardiovascular disease (CVD) events, although there was also some variation in other parameters, such as the cost of adverse cardiac events. There are three underlying sources of this variation in future CVD event risk: (1) whether the study relies on baseline CVD risk estimates from clinical trials or from real-world cohort studies (e.g. studies that include all events, rather than just first events like in clinical trials), (2) how the studies define CVD events (e.g. whether they include CVD events such as revascularization), and (3) variations in the risk profiles of the populations being studied in each CE analysis. We explore the differences across six key PCSK9 inhibitor CE studies and highlight how these three assumptions around CVD risk influence the outcomes of these different CE models.
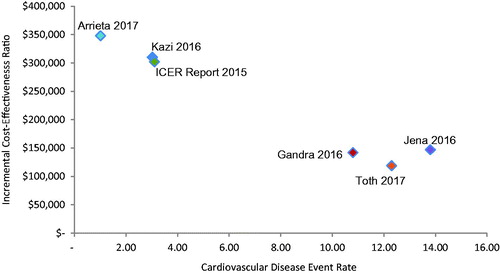
plots CE ratios from existing PCSK9 inhibitor CE studies against the baseline CVD event rate assumed in each study. The events included in the rates varied across studies, for example, with some electing to include unstable angina and revascularizationCitation2,Citation5. demonstrates a few things: first, CVD event rates are strongly and inversely correlated with the incremental cost-effectiveness ratio (ICER). Second, the definition of CVD event used impacts the calculation of the rate; i.e. studies that include revascularizations and unstable angina as cardiac events inevitably have higher MACE rates than those that do not. Third, there appears to be two groupings of studies. The first set bases MACE risk on RCTs and the Framingham risk modelCitation1,Citation4,Citation6. The second set of studies, funded by a PCSK9 inhibitor manufacturer, uses real world data (RWD) from longer-term observational studies and administrative datasetsCitation2,Citation3,Citation5. The selection of populations on which MACE risk is modeled appears to be the major driver of difference in CE estimates across these six CE studies.
Figure 1. Baseline MACE rate in ASCVD population plotted against incremental cost-effectiveness of PCSK9 inhibitor in treated but uncontrolled ASCVD patients. We have not changed any of the model inputs or their resulting ICERs except for the calculation of the ICER for Jena 2016, which was a value model not a cost-effectiveness model. The ratio of QALYs to life-years from Kazi 2016 was applied to the calculation of life-years from Jena 2016 to calculate an ICER by QALYs. MACE: major adverse cardiac events.
This observation raises the question: which sources of data are most appropriate for assessment of baseline MACE risk and are likely to yield the most accurate estimate of cost-effectiveness of PCSK9 inhibitors for real world patients?
The vast majority of CE models are built within a decision analytic framework. Such modeling allows for greater integration of different sources of data and the inclusion of real-world, pragmatic trial and observational study evidence where it is deemed necessaryCitation8,Citation9. There has been growing interest in using RWD for baseline risk or disease burden in CE modeling. In part, this interest reflects a greater acceptance that patients enrolled in RCTs differ from real-world populations in terms of baseline health risks, so outcomes as measured with RW effectiveness, e.g. absolute risk reduction, may differ from RCT efficacy. While the RCT is the gold standard for measuring efficacy of treatment, these studies frequently involve strict inclusion and exclusion criteria that exclude higher risk patients who will ultimately be eligible to receive treatment. In addition, disease monitoring and management styles in clinical practice often vary more widely than they do in an RCT. Several national and international clinical and research organizations, including the International Society for Pharmacoeconomics and Outcomes Research (ISPOR), the Royal Society of MedicineCitation8,Citation10, and, most recently, the Second Panel on Cost EffectivenessCitation7, have endorsed the use of RWD for baseline risk and derivation of RW effectiveness in the evaluation of new technologies.
In addition to the evidence reported above on PCSK9 inhibitors, other examples suggest that RCT-based and RWD-based CE analyses may yield different results. For example, a recent study, which compared two identical CE decision models, one of which used event rates from RCTs, and the other of which relied on observational studiesCitation11, found that the RWD-based CE model produced CE estimates that were 30% lower (e.g. better) than the RCT-based CE model. A review of 25 studies of asthma treatments, which compared CE models using RWD vs RCT data, found that studies which relied on RWD were twice as likely to conclude that a treatment was cost-effectiveCitation12. Additionally, the UK’s National Institute of Clinical Excellence Decision Support Unit recently published a report outlining the need to use RWD when estimating absolute treatment effectsCitation13.
Finally, future CVD events involve the risk profiles of populations included. CE analyses that rely on RCT data do not include substantial numbers of elderly patients, who are at higher risk of CVD events and still benefit significantly from aggressive secondary prevention. The American Heart Association has endorsed aggressive secondary prevention of CVD events in adults older than 75 years of age, recognizing that the risk of several forms of atherosclerotic CVD, including stroke and MI, rise significantly with ageCitation14. Perhaps most relevant to PCSK9 inhibitors are the clinical trials examining the efficacy of more intensive lipid-lowering regimens in older adults with chronic atherosclerotic CVD. For example, the Study Assessing Goals in the Elderly (SAGE) demonstrated a 67% relative risk reduction in all-cause mortality in 893 people aged 65–85 years old randomized to 80 mg atorvastatin compared with 40 mg pravastatinCitation15. CE models that rely on data from RCTs that lack large proportions of elderly patients may significantly under-estimate the CE of treatments. An RCT that does include upper age bands of elderly populations, such as FOURIER, a recently published PCSK9 inhibitor trial that included patients aged 40–85, does have event rates that are more similar to RWD studies. In FOURIER, patients on the control arm had an event rate of ∼5.2 per 100 patient years for their primary endpoint, a composite of cardiovascular death, MI, stroke, hospitalization for unstable angina, or coronary revascularization, and 9.8 per 100 patient years including recurrent events, which is similar to that seen in RWD studiesCitation16.
Ultimately, the question is not whether one set of PCSK9 inhibitor CE studies is right or wrong, but rather what population are we interested in? If prescribing new lipid lowering therapies should be limited solely to the sub-set of patients that are included in RCTs, then the first set of studies provide an accurate depiction of the value of PCSK9 inhibitors. However, if RCTs are the first step in assessing the potential clinical value of new therapies in a comprehensive population of people who could benefit from the intervention, then we should consider the possibility that the incorporation of RWD data on risk is as important as the RCT data used to estimate efficacy in performing accurate CE analyses.
With increasing attention on value and pricing of new medical therapies, a systematic approach to modeling cost-effectiveness is needed that weighs the benefits and costs of using RCT data and RWD in CE studies. In the case of PCSK9 inhibitors, this means considering whether RWD on CVD event rates should be used in CE models. As seen in , using RWD with patients who remain at higher risk despite the best standard of care will shift the cost-effectiveness ratio in favor of PCSK9 inhibitor use. Modeling the wrong population and calibrating event rates to RCTs that often focus on highly selected and monitored patients could under-represent the value of any new innovation, potentially negatively impacting resource and access decisions.
Transparency
Declaration of funding
Amgen provided financial support for this research to Precision Health Economics.
Declaration of financial/other interests
JWC and WS are employees of Precision Health Economics. PPT is a consultant and a member of the speakers bureau for Amgen. Peer reviewers on this manuscript have received an honorarium from JME for their review work, but have no other relevant financial relationships to disclose.
References
- Arrieta A, Page TF, Veledar E, et al. Economic evaluation of PCSK9 inhibitors in reducing cardiovascular risk from health system and private payer perspectives. PLoS One 2017;12:e0169761
- Jena AB, Blumenthal DM, Stevens W, et al. Value of improved lipid control in patients at high risk for adverse cardiac events. Am J Manag Care 2016;22:e199
- Gandra SR, Villa G, Fonarow GC, et al. Cost‐effectiveness of LDL‐C lowering with evolocumab in patients with high cardiovascular risk in the United States. Clin Cardiol 2016;39:313-20
- Kazi DS, Moran AE, Coxson PG, et al. Cost-effectiveness of PCSK9 inhibitor therapy in patients with heterozygous familial hypercholesterolemia or atherosclerotic cardiovascular disease. J Am Med Assoc 2016;316:743-53
- Toth PP, Danese M, Villa G, et al. Estimated burden of cardiovascular disease and value-based price range for evolocumab in a high-risk, secondary-prevention population in the US payer context. J Med Econ 2017:1-10
- Institute for Clinical and Economic Review. PCSK9 inhibitors for treatment of high cholesterol: effectiveness, value, and value-based price benchmarks. New England: Institute for Clinical and Economic Review; 2015
- Sanders GD, Neumann PJ, Basu A, et al. Recommendations for conduct, methodological practices, and reporting of cost-effectiveness analyses: second panel on cost-effectiveness in health and medicine. J Am Med Assoc 2016;316:1093-103
- Weinstein MC, O’Brien B, Hornberger J, et al. Principles of good practice for decision analytic modeling in health-care evaluation: report of the ISPOR Task Force on Good Research Practices–Modeling Studies. Value Health 2003;6:9-17
- Drummond MF, Sculpher MJ, Claxton K, et al. Methods for the economic evaluation of health care programmes. New England: Oxford University Press; 2015
- Rawlins M. De testimonio: on the evidence for decisions about the use of therapeutic interventions. Lancet 2008;372:2152-61
- Campbell JD, McQueen RB, Briggs A. The “e” in cost-effectiveness analyses. A case study of omalizumab efficacy and effectiveness for cost-effectiveness analysis evidence. Ann Am Thorac Soc 2014;11:S105-S111
- Dilokthornsakul P, Chaiyakunapruk N, Campbell JD. Does the use of efficacy or effectiveness evidence in cost-effectiveness analysis matter? J Asthma 2017;54:17-23
- Faria R, Hernandez Alava M, Manca A, et al. NICE DSU technical support document 17: the use of observational data to inform estimates of treatment effectiveness for technology appraisal: methods for comparative individual patient data. Sheffield: NICE Decision Support Unit; 2015
- Kozak LJ, DeFrances CJ, Hall MJ. National hospital discharge survey: 2004 annual summary with detailed diagnosis and procedure data. Vital and health statistics Series 13, Data from the National Health Survey. Atlanta, GA: National Center for Health Statistics; 2006:1-209
- Deedwania P, Stone PH, Merz CNB, et al. Effects of intensive versus moderate lipid-lowering therapy on myocardial ischemia in older patients with coronary heart disease. Circulation 2007;115:700-7
- Sabatine MS, Giugliano RP, Keech AC, et al. Evolocumab and clinical outcomes in patients with cardiovascular disease. N Engl J Med 2017;376:1713-1722