
Abstract
Aims: Sinusoidal obstruction syndrome (SOS) is a life-threatening complication of hematopoietic stem cell transplantation (HSCT) associated with significant morbidity and mortality. Healthcare utilization, costs, and mortality were assessed in HSCT patients diagnosed with SOS, with and without multi-organ dysfunction (MOD).
Materials and methods: This retrospective observational study identified real-world patients undergoing HSCT between January 1, 2009 and May 31, 2014 using the Premier Healthcare Database. In absence of a formal ICD-9-CM diagnostic code, SOS patients were identified using a pre-specified definition adapted from Baltimore and Seattle criteria and clinical practice. Severe SOS (SOS/MOD) and non-severe SOS (SOS/no-MOD) were classified according to clinical evidence for MOD in the database.
Results: Of the 5,418 patients with a discharge diagnosis of HSCT, 291 had SOS, with 134 categorized as SOS/MOD and 157 as SOS/no-MOD. The remaining 5,127 patients had HSCT without SOS. Overall SOS incidence was 5.4%, with 46% having evidence of MOD. Distribution of age, gender, and race were similar between the SOS cohorts and non-SOS patients. After controlling for hospital profile and admission characteristics, demographics, and clinical characteristics, the adjusted mean LOS was 31.0 days in SOS/MOD compared to 23.9 days in the non-SOS cohort (medians = 26.9 days vs 20.8 days, p < .001). The adjusted mean cost of SOS/MOD patients was $140,653, which was $41,702 higher than the non-SOS cohort (medians = $105,749 vs $74,395, p < .001). An almost 6-fold increased odds of inpatient mortality was associated with SOS/MOD compared to the non-SOS cohort (odds ratio = 5.88; 95% CI = 3.45–10.33).
Limitations: Limitations of retrospective observational studies apply, since the study was not randomized. Definition for SOS was based on ICD-9 diagnosis codes from a hospital administrative database and reliant on completeness and accuracy of coding.
Conclusions: Analysis of real-world data shows that SOS/MOD is associated with significant increases in healthcare utilization, costs, and inpatient mortality.
Introduction
Sinusoidal Obstruction Syndrome (SOS), also known as Hepatic Veno-occlusive Disease (VOD), is a life-threatening complication of hematopoietic stem cell transplantation (HSCT)Citation1–3. In the Western hemisphere, hematopoietic stem cell transplantation (HSCT) is the most common cause of SOSCitation1. It occurs in both adult and pediatric populations, equally affects males and females, and has no predilection for raceCitation4. While an overall incidence between 3–60% has been reported in the US and worldwide, data compiled from 135 studies from 1979–2007 indicate that 14% of patients undergoing HSCT will develop SOSCitation5. In a recent published study using observational data between 2008–2011 from the Center for International Blood and Marrow Transplant Research (CIBMTR), the reported incidence of SOS was 3.2%, and 1.2% met criteria for renal impairment requiring dialysis or any non-infectious pulmonary abnormality indicating severe SOS (SOS with MOD)Citation6. Pre-transplant conditioning regimen, type of HSCT, and underlying disease contribute to SOS development. These factors, as well as differing clinical diagnostic criteria (Seattle, Modified Seattle, and Baltimore), populations studied (pediatric vs adult), and time periods assessed likely account for the broad incidence rangeCitation1.
The pathophysiology of VOD has led to its renaming to SOSCitation4. Progressive occlusion of the sinusoids resulting in intra-hepatic post-sinusoidal portal hypertension accounts for the clinical symptoms. SOS is clinically characterized by rapid weight gain, ascites, painful hepatomegaly, and jaundice. SOS classically develops within 30 days of HSCTCitation7 and, for the pediatric population, within 20 days, with peak onset at 12 daysCitation8, although late-onset SOS beyond 20 days occursCitation9. SOS characterized by evidence of multi-organ dysfunction (MOD) is associated with poor prognosis, with mortality rates reported as over 80%Citation1,Citation10. Hepatic, renal, respiratory, and cardiac failure are common causes of death.
Post-transplantation complications of SOS, as well as infection, dialysis, and mechanical ventilation, have been reported to be major cost drivers of HSCTCitation11–15. However, there are limited formal studies using large databases specifically evaluating the burden of SOS and SOS severity on a heterogeneous population of HSCT patients. The present study examines incidence, hospital and patient characteristics, and healthcare utilization and outcomes in this setting. Healthcare utilization, costs, and outcomes included total hospital length of stay (LOS) and intensive care unit (ICU) days, total hospital costs and ICU costs, inpatient mortality, and 30-day all-cause readmissions. In addition, sub-group analysis assessing SOS incidence and associated LOS and costs was conducted for the pediatric and adult populations.
Methods
Study design
A retrospective observational database study was conducted using data from the Premier Healthcare Database (PHD), a large US hospital-based, service-level, all-payer database that contains information on more than six million annual hospital discharges, representing ∼20% of annual US inpatient discharges. Patients admitted to the hospital for HSCT and discharged between January 1, 2009 and May 31, 2014 were included in the study. When a patient had more than one qualifying discharge, only the initial discharge was included and defined as the index discharge. A clean period of 30 days without evidence of HSCT procedure was required prior to the index admission date, and a 30-day follow-up period was allowed to capture readmission. The HSCT patients were assessed for development of hepatic SOS, herein referred to as SOS.
Patient selection and classification of hepatic sinusoidal obstruction syndrome
Individuals undergoing allogeneic, autologous, or unspecified stem cell transplant were identified with discharge International Classification of Diseases, Ninth Revision (ICD-9) procedural codes 41.00–41.09 or Current Procedural Terminology (CPT) code 38241.
Currently, there are two definitions of SOS based on the Seattle criteriaCitation16 and the Baltimore criteriaCitation17. These criteria have been used in clinical studies in the past three decades with minor modification, and resulted in different incidence rates of SOSCitation18. In the absence of a formal ICD-9-Clinical Modification (CM) diagnosis code for SOS, a definition employing the existing diagnosis and procedure codes available in the administrative database, which were adapted from the Seattle and Baltimore criteria and revised on the basis of available ICD-9-CM codes and knowledge from clinical practice, was developed by the clinical investigators to identify SOS, SOS without MOD (SOS/no-MOD), and SOS with MOD (SOS/MOD).
summarizes the criteria applied within the PHD to identify all SOS, SOS/no-MOD, and SOS/MOD. The composite SOS population consisted of patients with at least one diagnosis code for hepatic injury or thromboembolic disease (Group B1) and at least two different codes reflecting the clinical criteria used to diagnose SOS (Group B2). The SOS/MOD cohort consisted of SOS patients who also had at least one diagnosis code indicating MOD or reflecting the criteria used to diagnose MOD (Group C). The non-SOS patients were those who had received HSCT but did not have any clinical evidence of SOS. Those without SOS served as the control population for comparative analyses.
Figure 1. Diagnostic definition used to identify all SOS, non-SOS, SOS/no-MOD (non-severe), and SOS/MOD (severe) in patients undergoing HSCT. HSCT, Hematopoietic stem cell transplantation; SOS, Sinusoidal obstruction syndrome; MOD, Multi-organ dysfunction.
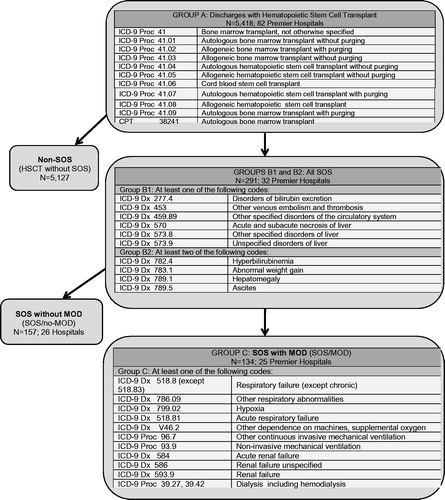
To more accurately identify SOS and exclude alternate etiologies of liver abnormalities, patients with graft-vs-host disease (GVHD, ICD-9 279.50) or total parenteral nutrition (TPN) cholestasis (ICD-9 576.2 and TPN identified in charge master) were excluded only from the SOS cohorts and not from the non-SOS cohort.
Study variables
The outcomes examined in this study included the LOS and costs for index hospitalization and intensive care unit (ICU), inpatient mortality, and 30-day all-cause readmissions with respective costs. The costs in the PHD were obtained from patients’ discharge files and billing records. The majority of the hospitals had a cost accounting system and assigned Relative Value Units (RVUs) to estimate cost. A small proportion of hospitals without a cost accounting system only reported charges, and the costs were estimated using departmental cost-to-charge ratios, which were derived from the Medicare Cost Report provided by each hospital.
Exposure variables of this study included indicators of presence of SOS/no-MOD and SOS/MOD. Other study variables, including hospital and patient characteristics, were examined to better understand the patient sample. Hospital bed size, population served (urbanicity), teaching status, and hospital region were identified from the database. Admission type, source, and discharge status/destination similarly were reported. Patient demographics included age, gender, race, and ethnicity. Healthcare coverage payer status was also captured. Only the most commonly occurring primary and secondary discharge diagnoses were captured for analysis based on ICD-9-CM codes, although other conditions such as neuroblastoma, hemophagocytic lymphohistiocytosis (HLH), and osteopetrosis were observed at low rates. Due to its high likelihood of occurrence during hospitalization for HSCT, the presence of sepsis/septic shock (ICD-9 038.xx, 995.91, 995.92, or 785.52) was recorded. Charlson-Deyo Comorbidity Index was developed using both admission and discharge diagnoses to identify chronic comorbidities and determine overall patient health status at the time of index hospital dischargeCitation19.
Statistical analyses
Descriptive statistics were performed on the non-SOS, SOS/no-MOD, and SOS/MOD groups. Continuous data were expressed as mean, standard deviation, median, and interquartile range (IQR). Bivariate analysis compared the SOS/no-MOD and SOS/MOD cohorts against the non-SOS control. Since LOS and cost data are not normally distributed, the Wilcoxon rank-sum test was used to compare the distribution of the LOS and cost outcomes. Costs were Winsorized using the 99th percentile in order to offset the bias caused by outliers likely to be a result of miscodingCitation20. The Winsorization method replaced any outliers above the 99th percentiles with the values of the 99th percentiles. A total of 10 patients with missing or zero cost data were excluded from the cost analysis, all of which were from the control cohort. There were no missing values in other outcomes. Categorical data were expressed as counts and percentages and compared using Chi-square test. An alpha <0.05 was considered statistically significant. Data analysis was implemented using SAS software version 9.4 (Copyright, SAS Institute Inc. Cary, NC, SAS).
Adjusted analysis was performed on outcomes of LOS, cost, inpatient mortality, and 30-day all-cause readmission. Multivariable regression was used to adjust for hospital characteristics (urbanicity, region, bed size, teaching status); patient demographics (age group, sex, race/ethnicity); health coverage primary payer; encounter characteristics (admission type, admission source, prior non-HSCT related admission), and comorbidities (Charlson-Deyo comorbidity index, sepsis/septic shock). Most common clinical conditions for HSCT (Hodgkin’s disease, multiple myeloma and immunoproliferative neoplasms, lymphoid leukemia, myeloid leukemia, neoplasm of uncertain behavior of other and unspecified sites and tissues) were included in the models to control for the illness severity of patients. In addition, as patients undergoing allogeneic and autologous transplant could differ significantly in the incidence of SOS and healthcare utilization, we also included the transplant type as one of the covariates in the regression models.
Generalized linear models (GLMs) with log link and Poisson distribution were used for LOS; GLMs with log link and gamma distribution were used to model cost; and logistic regression was used to examine the difference in inpatient mortality and 30-day all-cause readmission between the SOS/no-MOD and SOS/MOD cohorts vs the non-SOS controls. Recycled prediction was used to calculate the adjusted outcomes by SOS status. The recycled prediction method calculates the predicted outcomes based on regression estimates, and facilitates interpretation of regression resultsCitation21. First, all patients were assumed to have SOS/MOD, and the adjusted outcomes were predicted based on the regression coefficients, holding all covariates at their actual values. Second, predication was made assuming all patients were in the SOS/no-MOD cohort. Finally, adjusted outcomes were calculated assuming all patients were in the non-SOS cohort. The distribution for the predicted values for the three hypothetical groups (SOS/MOD, SOS/no-MOD, and non-SOS) was examined.
Results
Descriptive analysis
Study populations and hospital and hospitalization characteristics
HSCT discharge diagnosis was identified in 5,418 patients from 82 hospitals (). Incidence of SOS in the total population studied was 5.4%. Of these 291 patients diagnosed with SOS, 134 (46.0%) were categorized as SOS/MOD, and 157 (54.0%) as SOS/no-MOD. The remaining 5,127 (94.6%) patients were in the non-SOS group.
Hospital profiles associated with the hepatic SOS groups and their admission characteristics are summarized in . With the exception that SOS/no-MOD patients were more likely to be treated at teaching hospitals (p = .006), hospital characteristics of bed size, population served, and provider region were similar to the non-SOS group. Admission type and source were also similar between the groups. When compared to the non-SOS patients, discharge disposition was different for both SOS/MOD (p < .001) and SOS/no-MOD (p = .018) groups. More deaths occurred in the SOS/MOD group (39.6%) than the non-SOS (3.0%), and fewer home discharges were seen for patients with SOS/MOD (47.0%) compared to non-SOS (91.8%).
Table 1. Hospital and hospitalization characteristics by SOS status.
Patient demographics and clinical characteristics
Patient demographics and clinical characteristics are outlined in . Mean age ± standard deviation was 47.7 ± 21.4 for SOS/MOD, 53.1 ± 16.7 for SOS/no-MOD, and 50.6 ± 18.4 for non-SOS patients. In all three cohorts, more than half were males (59.0% SOS/MOD, 55.4% SOS/no-MOD, 57.6% non-SOS), and the majority were white (58.2% SOS/MOD, 58.0% SOS/no-MOD, 63.2% SOS). Distribution of age, gender, and race were not statistically different between the SOS and the non-SOS patients. Types of healthcare coverage were similar between the SOS and non-SOS populations.
Table 2. Patient demographcs and clinical characteristics by SOS status.
Compared with non-SOS patients, more allogeneic and fewer autologous HSCTs were performed in the SOS/MOD (p < .001) and SOS/no-MOD (p = .05) cohorts. The incidence rate of SOS/MOD was 3.6% in patients undergoing allogeneic transplant compared to 1.8% in those undergoing autologous transplant (p < .001). The incidence rate of SOS/no-MOD was 3.7% in the allogeneic and 2.7% in the autologous HSCT patients (p = .053). A significantly higher incidence of sepsis was observed only in the SOS/MOD group (56% vs 8.9% in the SOS/no-MOD and vs 8.8% in the non-SOS group; p < .001). Based on the distribution of the Charlson-Deyo Comorbidity Index in the patient populations, just over 52.0% of the SOS/MOD patients had an index of 4 or greater, indicating a sicker patient population compared to the 14.0% of non-SOS patients.
Unadjusted outcome variables
Unadjusted healthcare outcomes of the SOS/MOD, SOS/no-MOD, and non-SOS populations are listed in . further depicts the data distribution for total hospital and ICU stays and associated costs.
Figure 2. Unadjusted outcomes for total hospital length of stay and hospital costs (a) and ICU stay and ICU costs (b) for non-SOS, SOS/no-MOD (non-severe), and SOS/MOD (severe) populations. Box length represents the Interquartile range. The horizontal line of the box represents the median (50th quartile); lower border of the box represents the 25th quartile; and upper border of the box represents the 75th quartile. Mean is represented by v. Lower and upper ends of the whiskers signify the minimum and maximum values, respectively.
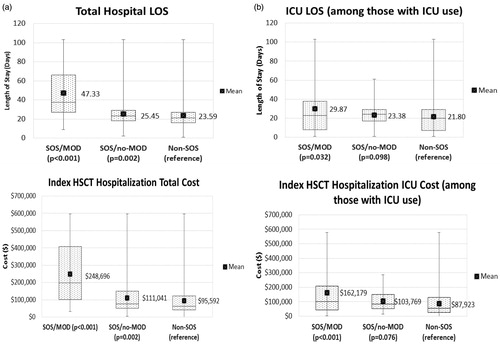
Table 3. Unadjusted healthcare outcomes by SOS status.
Hospital and ICU length of stay and costs: Compared to those without SOS, median LOS was significantly longer in the SOS/MOD (21 vs 38 days; p < .001) and SOS/no-MOD (21 vs 23 days; p = .002) groups. ICU stays were seen in 56.0% of patients with SOS/MOD, significantly higher than the 24.1% in patients without SOS (p < .001). Among those with an ICU stay, median ICU days were significantly longer in the SOS/MOD cohort compared to the non-SOS group (23 vs 20 days; p = .032).
The median costs for SOS/MOD were significantly higher than the non-SOS group ($198,436 vs $62,881; p < .001), as were median costs for the SOS/no-MOD group ($75,161 vs $62,881; p = .002). Among those with an ICU stay, median ICU costs were significantly higher in SOS/MOD compared to the non-SOS group ($101,510 vs $55,516; p < .001), but not when compared to the SOS/no-MOD group ($83,800 vs $55,516; p = .076).
Inpatient mortality: Mortality in the SOS/MOD cohort was significantly higher than that seen for the non-SOS patients (39.6% vs 3.0%; p < .001). Only one death was observed in the SOS/no-MOD group (0.6%).
30-Day all-cause readmission: For patients who survived to discharge, the rate of 30-day all-cause readmissions in the absence of SOS was 18.7%. Similar rates were observed in the SOS/MOD (19.8%) and SOS/no-MOD (20.4%) groups. When median costs of readmission were assessed, significant differences in cost were noted only between the SOS/MOD and non-SOS groups ($19,092 vs $10,589; Δ = $8,503; p = .043).
Unadjusted sub-group analyses
Pediatric vs adult population: depicts incidence of SOS for total, pediatric, and adult populations. In the pediatric population, overall incidence of SOS was 6.3% (30/471), SOS/MOD was 4.2% (20/471), and SOS/no-MOD was 2.1% (10/471). The incidence of SOS/MOD in the pediatric population was significantly higher than that for the adult population (4.2% vs 2.3%; p < .05). In both pediatric and adult populations, patients with SOS/MOD were found to have significantly longer LOS and higher costs (). Median pediatric LOS was 73 days for SOS/MOD, significantly longer than the non-SOS patients (34 days, p < .001). The median cost for pediatric patients with SOS/MOD was $374,656, compared to $148,414 for non-SOS patients (p < .001). Median adult LOS was 34 days for SOS/MOD, significantly longer than the non-SOS patients (20 days, p < .001). The median costs for adult patients with SOS/MOD were $173,308 compared to $59,353 for non-SOS patients (p < .001). The differences in LOS and costs between SOS/no-MOD and non-SOS cohorts were not statistically significant when patients were stratified into pediatric and adult groups.
Figure 3. Incidence of SOS for the total, pediatric, and adult populations. *Chi-square test. Non-SOS, without sinusoidal obstruction syndrome; SOS/no-MOD, sinusoidal obstruction syndrome without multi-organ dysfunction; SOS/MOD, sinusoidal obstruction syndrome with multi-organ dysfunction. Black bar, Total; white bar, Pediatric; grey bar, Adult
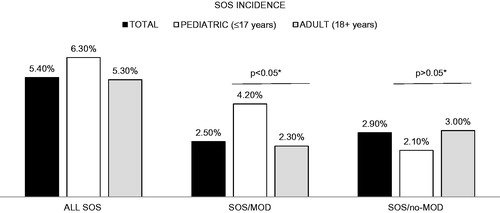
Table 4. Unadjusted healthcare outcomes of the pediatric and adult populations based on SOS status.
Allogeneic vs autologous transplant: A sub-group analysis was performed to examine LOS, cost, and mortality outcomes by transplant type, with half as many patients receiving an allogeneic (n = 1,804) vs autologous (n = 3,427) HSCT. In both sub-groups, patients with SOS/MOD were found to have significantly longer LOS, increased costs, and higher inpatient mortality (). Moreover, regardless of the SOS and MOD status, autologous patients were associated with lower LOS, cost, and mortality. Median allogeneic LOS was 53 days for SOS/MOD, significantly longer than for the non-SOS patients (26 days, p < .001). The median cost for allogeneic patients with SOS/MOD was $267,115, compared to $121,241 for non-SOS patients (p < .001). The inpatient mortality rate in SOS/MOD patients undergoing allogeneic transplant was 49.2%, and it was only 5.4% in those without SOS (p < .001). In autologous transplant patients, median LOS was 28 days for SOS/MOD, 10 days longer than the non-SOS patients (18 days, p < .001). The median costs for autologous patients with SOS/MOD were $100,484, compared to $48,690 for non-SOS patients (p < .001). Inpatient mortality rate for the SOS/MOD patients was 21.7% compared to 1.3% in non-SOS patients (p < .001). In both the autologous and allogeneic groups, significant differences between SOS/MOD and non-SOS were observed for all assessed outcomes.
Table 5. Unadjusted healthcare outcomes by transplant type based on SOS status.
Multivariable analysis
Multivariable analysis estimated the association of SOS/MOD and SOS/no-MOD status compared to non-SOS for study outcomes, as well as the effects of transplant type and presence of sepsis/septic shock. Estimated coefficients or odds ratios are presented in . Adjusted outcomes calculated by the recycled prediction method are reported in .
Table 6. Association of SOS status (with and without MOD) on hospital length of stay, hospital costs, 30-day all-cause readmission costs, inpatient mortality, and 30-day all-cause readmissions.
Table 7. Adjusted healthcare outcomes based on generalized linear models of regression.
Effect of SOS status
Hospital LOS and costs: The GLM regression results showed that SOS/MOD was associated with a prolonged LOS (coefficient = 0.26, p < .001). SOS/no-MOD was also associated with longer LOS, but the effect size was smaller (coefficient = 0.04, p = .023). The estimates were converted into number of days using the Recycled Prediction. Mean of adjusted LOS was 31.0 days for SOS/MOD (median of adjusted LOS = 26.9 days) and 24.8 days for SOS/no-MOD (median of the adjusted LOS = 21.6 days) cohorts compared to 23.9 days (median of adjusted LOS = 20.8 days) for non-SOS patients.
A similar pattern in effect size was noted for hospital costs. SOS/MOD and SOS/no-MOD were both associated with increased hospital costs (coefficient = 0.35, p < .001 for SOS/MOD and coefficient = 0.09, p = .037 for SOS/no-MOD). The mean of adjusted costs was $140,653 for the SOS/MOD cohort and $107,939 for the SOS/no-MOD cohort, which were $41,702 and $8,988 higher than the mean cost of $98,951 for the non-SOS cohort. The median adjusted hospital costs were $105,749 for SOS/MOD and $81,153 for SOS/no-MOD, compared to $74,395 for non-SOS patients.
Inpatient mortality: An almost 6-fold higher odds (odds ratio = 5.88; 95% CI = 3.45–10.33) of inpatient mortality was associated with SOS/MOD after adjustment for associated covariates.
30-Day all-cause readmission: No statistical associations were observed between SOS status and likelihood for 30-day all-cause readmissions or its associated costs.
Effect of transplant type and presence of sepsis
Multivariable analysis found that allogeneic transplant was associated with a 34.0% longer LOS (coefficient = 0.29, p < .001) compared to autologous transplant, holding all other covariates the same (not presented in multivariate tables). The hospital cost for allogeneic transplant was 69.7% higher (coefficient = 0.53, p < .001), holding all other covariates the same. In the regression of inpatient mortality, allogeneic transplant had an odds ratio of 6.19.
The coefficient for sepsis in the regression of LOS was 0.24 (p < .001), and patients with sepsis spent 27.1% more hospital days compared to those without sepsis (not presented in multivariate tables). Higher costs of 34.2% were seen in patients diagnosed with sepsis during the hospitalization (coefficient = 0.29, p < .001), holding all other covariates the same. Sepsis was also found to be associated with a dramatic increase in the risk of mortality (odds ratio = 26.1, p < .001).
Discussion
In this retrospective observational database study assessing SOS in the setting of HSCT, patients identified as having SOS/MOD utilized significantly more healthcare resources than those without SOS, as evidenced by prolonged hospitalization, a greater proportion of patients with any ICU days, longer ICU stays, and increased costs. Moreover, SOS status without or with MOD had a significant association with increased healthcare resource utilization for HSCT patients, and SOS/MOD was associated with 6-fold greater odds of inpatient mortality compared to the non-SOS group. Allogeneic transplants and development of sepsis further contributed to SOS burden of illness. In addition, the sub-group analysis confirmed that SOS/MOD patients experienced a significantly longer hospital stay and incurred higher costs in both pediatric and adult populations.
In this study, 5.4% of HSCT patients were identified as either SOS without MOD (2.9%) or SOS with MOD (2.5%). The observed low incidence compared to the wide range reported in the literature may reflect the stringent and focused criteria applied, in order to identify patients with a high certainty of SOS. The diagnosis for severe SOS was made only if clinical evidence for MOD was present. In addition to restrictive diagnostic methodology, the time period studied from 2009 to mid-2014 may reflect a lower incidence, due to improved and reduced intensity conditioning regimens compared to the years prior to 2009Citation1,Citation22,Citation23.
Other studies covering overlapping time periods to the present study showed similar pediatric and adult SOS incidence rates in line with those reported in this study (6.3% and 5.3%, respectively). In a 2016 study, Strouse et al.Citation6 reported that the incidence rate of SOS in a combined adult and pediatric cohort was 3.2% between 2008–2011, using observational data from the CIBMTR. CIBMTR data from 2008–2013 reported a 4.9% (637/13,097) combined incidence of SOS (personal communication with Wael Saber, MD, CIBMTR). In this later CIBMTR report, the pediatric SOS incidence rate was 10.1% (336/3,339, < 10–19 years of age), and the adult SOS incidence rate was 3.1% (301/9,758). Similarly, Strouse et al.Citation6 reported that 1.2% of patients met criteria for renal impairment requiring dialysis or any non-infectious pulmonary abnormality indicating severe SOS (SOS with MOD), comparable to our 2.5% incidence of SOS/MOD.
The rate of mortality observed in this study for SOS with MOD is far less than that reported in the HSCT SOS literature. This may reflect the smaller window of time in which mortality was identified (within the same hospitalization) rather than 100-day mortality, which is commonly reported in the transplant literature. The adjusted rate of mortality was even lower and may be explained, at least in part, by the concomitant occurrence of sepsis/septic shock observed in the SOS/MOD cohort. Sepsis in HSCT recipients differs from that observed in the general population, and is a dynamic process that can occur during pre-transplant myeloablation, post-transplant neutropenia and immune-suppression, and prolonged immunodeficiency that may occur in the post-engraftment periodCitation24,Citation25. As sepsis can occur throughout the transplant period, it may be difficult to ascertain etiology for multi-organ failure, and whether demise was a result of SOS/MOD, sepsis, or both in this administrative database study. Nonetheless, the presence of sepsis/septic shock, along with a greater number of Charlson-Deyo discharge comorbidities and more discharges to healthcare facilities, underscores the degree and burden of illness conveyed by HSCT and SOS/MOD.
Hospitalization and cost data specific to non-severe and severe SOS is limited, with many studies in the literature highlighting the wide range of complications in HSCT. A 2000 study by Lee et al.Citation12 of SCT costs between 1994–1997 from a single institution demonstrated 1997 cost-adjusted dollars of autologous transplantation ranging between $28,200–$148,200 (median = $55,500) and of allogeneic transplantation ranging between $32,500–$338,000 (median = $105,300). For autologous transplants, the major clinical cost drivers were infection and in-hospital death, adding $18,400 and $20,500; respectively. For allogeneic transplants, infection, SOS, acute GVHD, and death added from $15,300–$28,100 per clinical event. SOS complicated by MOD requires expensive supportive care with a high likelihood of deathCitation22. Events leading to in-hospital death can significantly add to the economic burden.
HSCT is itself a key driver in the costs to treat hematologic malignanciesCitation11, and total hospital days can be a proxy for total costsCitation26. The Agency for Health Care Research and QualityCitation27 reported that bone marrow transplant hospital stays generated the largest healthcare costs from 2004–2007, with a growth rate of 84.9%. This rate of growth was attributed to the increase in both mean cost of hospital stay (25.6%) and number of hospital days (59.3%). National costs of in-patient hospitalization rose during this period, from $694 million to $1.3 billion dollars.
This study included both pediatric and adult patients, with the pediatric population comprising just over 8% of the total HSCT population. SOS is an important complication for pediatric HSCT recipients, and a significantly greater incidence of SOS/MOD in pediatric patients was observed compared to that for the adult population, possibly due to a broader use of myeloablative conditioning in this population. It has also been reported that younger age of <6.7 years of age was a risk factor for SOS development, presumably due to narrow sinusoid lumens, leading to easy occlusionCitation28. In both pediatric and adult populations, the SOS/MOD patients were found to have longer LOS and higher costs. However, the healthcare costs and utilization associated with SOS/MOD seemed to be even higher in the pediatric population than among the adults, an important finding of this study.
Some limitations of this study accrue from the database definition of SOS, which could not be validated by clinical data from medical charts, as this would have required hospital IRB approvals, along with significant resource utilization and costs. The definition was based on the clinical experience and judgment of the study investigators and, due to the strict criteria employed, some patients may have been falsely included in the control population, which may have negatively biased our findings. Without a time stamp for the diagnosis codes, the definition of SOS in this study could not differentiate patients with late onset of SOS (>21 days after HSCT) from those with early onset, as defined in Seattle and Baltimore criteria. However, the updated definition for SOS by the European Society for Blood and Marrow TransplantationCitation29 and British Committee for Standards in Hematology/British Society for Blood and Marrow Transplantation guidelinesCitation30 includes late-onset as well as early onset. The lack of a time stamp for diagnosis codes also made it impossible to determine the timing of certain comorbid conditions such as sepsis; therefore, a conservative estimated effect of SOS/MOD was given by adjusting the sepsis effect in the multivariable regressions, regardless of whether sepsis occurred after the onset of SOS/MOD. Additionally, some potential confounders, such as the intensity of conditioning therapy, related vs unrelated transplant, transplant number, prophylactic measures, and Hematopoietic Cell Transplantation-Specific Comorbidity Index (HCT-CI) were not captured in a hospital administrative database, which could result in bias in the estimated effects.
Other limitations of this observational retrospective study include those inherent to use of any administrative database, such as reliance upon accurate and complete ICD-9-CM diagnosis, procedure coding, and similar cost accounting methods between hospitals. Access to mortality data from the database was limited to the index hospitalization period. Additionally, 30-day all-cause readmissions relied on patients returning to the same index hospital, and, consequently, reported readmission rates may be under-estimated. This study assessed initial HSCT hospitalizations, but the possibility of patients receiving prior HSCT in another non-Premier hospital cannot be ruled out. Finally, the results of this study describe associations and not causality.
Despite these limitations, use of the PHD afforded many advantages. Strengths of this study include findings that are generalizable to the US population and based upon data describing real-world practice. It permitted assessing current data from more than 600 diverse hospitals and identifying more than 5,200 patients (from 82 hospitals) who underwent HSCT. Moreover, it appears that use of a large hospital database to identify the economic consequences associated with SOS is limited in the literature, and most studies report single institutional experiencesCitation31. Additionally, the pre-specified definition permitted identification of multi-organ failure, a key and costly component of severe SOS, through related ICD diagnosis and procedure codes. This study was able to focus on current incidence, healthcare utilization, and costs associated with only SOS as a complication of HSCT, in the absence and presence of MOD. Finally, a number of sensitivity analyses were conducted to validate the patient selection criteria: (1) restricting the control cohort to patients treated in hospitals that performed HSCT and had at least one case of SOS; (2) including SOS patients with acute GVHD or TPN-associated cholestasis; (3) comparing SOS/MOD patients with those in non-SOS cohort who had MOD; (4) excluding HSCT patients transferred to another facility; (5) excluding hospitals that placed HSCT patients in the ICU for the entire hospitalization period; and (6) stratifying patients with in-hospital mortality. Findings from the sensitivity analyses were all consistent with that found in the main analysis.
Conclusions
In summary, SOS, especially with multi-organ dysfunction, is associated with a significant burden of illness during the initial inpatient HSCT period compared to patients without SOS. This study highlighted that hepatic SOS with MOD post-HSCT is associated with a significant increase of hospital days, total hospital costs, and SOS risk of inpatient mortality. Moreover, use of a large national hospital database during the period assessed permitted multi-center analysis of the current incidence, healthcare utilization, mortality, and costs associated with no MOD and MOD-related SOS as a complication of HSCT. Importantly, this study may represent the first publication to concomitantly address all these economic issues and further understanding of the economic implications of severe SOS in the inpatient hospital setting of HSCT. In an era of cost containment and federal mandate to reduce 30-day readmissions, these findings highlight the need to explore prophylactic strategies and pre-emptive treatments in order to mitigate SOS.
Transparency
Declaration of funding
This study was sponsored and funded by Jazz Pharmaceuticals.
Declaration of financial/other interests
ZC, CL, and SB are employees of Premier Research Services, which received funding from Jazz Pharmaceuticals, the manufacturer of defibrotide, for conducting this study. KV is an employee of Jazz Pharmaceuticals and is also a shareholder. BN was an employee of Jazz Pharmaceuticals at the time of the study and, in the course of his employment, received stock options exercisable for, and other stock awards of, ordinary shares of Jazz Pharmaceuticals. CD received a consulting fee from Jazz Pharmaceuticals for study design and data interpretation. Peer reviewers on this manuscript have received an honorarium from JME for their review work, but have no other relevant financial relationships to disclose.
Previous presentations
This work was presented in part at the American Society of Hematology, 57th Annual Meeting, Orlando, Florida, December 5–8, 2015 and 2016 Bone Marrow Transplant Meetings, Honolulu, Hawaii, February 18–22, 2016.
Acknowledgments
The authors thank Wael Saber, MD, for providing data from the Center for International Blood and Marrow Transplant Research (CIBMTR). Carol A. Cohen, BA, employed by Premier as senior medical writer, provided writing and editorial assistance.
References
- Kumar S, DeLeve LD, Kamath PS, et al. Hepatic veno-occlusive disease (sinusoidal obstruction syndrome) after hematopoietic stem cell transplantation. Mayo Clin Proc 2003;78:589-98
- Berk PD, Popper H, Krueger GR, et al. Veno-occlusive disease of the liver after allogeneic bone marrow transplantation: possible association with graft-versus-host disease. Ann Intern Med 1979;90:158-64
- Jacobs P, Miller JL, Uys CJ, et al. Fatal veno-occlusive disease of the liver after chemotherapy, whole-body irradiation and bone marrow transplantation for refractory acute leukaemia. S Afr Med J 1979;55:5-10
- Harper JL. Veno-occlusive hepatic disease. 2016. http://emedicine.medscape.com/article/989167-overview. [Last accessed 7 November 2016]
- Coppell JA, Richardson PG, Soiffer R, et al. Hepatic veno-occlusive disease following stem cell transplantation: incidence, clinical course, and outcome. Biol Blood Marrow Transplant 2010;16:157-68
- Strouse C, Richardson P, Prentice G, et al. Defibrotide for treatment of severe veno-occlusive disease in pediatrics and adults: an exploratory analysis using data from the Center for International Blood and Marrow Transplant Research. Biol Blood Marrow Transplant 2016;22:1306-12
- Richardson PG, Ho VT, Giralt S, et al. Safety and efficacy of defibrotide for the treatment of severe hepatic veno-occlusive disease. Ther Adv Hematol 2012;3:253-65
- Harper JL. Veno-occlusive hepatic disease clinical presentation. 2016. http://emedicine.medscape.com/article/989167-clinical. [Last accessed 7 November 2016]
- Lee SH, Yoo KH, Sung KW, et al. Hepatic veno-occlusive disease in children after hematopoietic stem cell transplantation: incidence, risk factors, and outcome. Bone Marrow Transplant 2010;45:1287-93
- Carreras E, Díaz-Beyá M, Rosiñol L, et al. The incidence of veno-occlusive disease following allogeneic hematopoietic stem cell transplantation has diminished and the outcome improved over the last decade. Biol Blood Marrow Transplant 2011;17:1713-20
- Khera N, Zeliadt SB, Lee SJ. Economics of hematopoietic cell transplantation. Blood 2012;120:1545-51
- Lee SJ, Klar N, Weeks JC, et al. Predicting costs of stem-cell transplantation. J Clin Oncol 2000;18:64-71
- Svahn BM, Alvin O, Ringdén O, et al. Costs of allogeneic hematopoietic stem cell transplantation. Transplantation 2006;82:147-53
- Majhail NS, Mothukuri JM, Brunstein CG, et al. Costs of hematopoietic cell transplantation: comparison of umbilical cord blood and matched related donor transplantation and the impact of posttransplant complications. Biol Blood Marrow Transplant 2009;15:564-73
- Svahn BM, Remberger M, Alvin O, et al. Increased costs after allogeneic haematopoietic SCT are associated with major complications and re-transplantation. Bone Marrow Transplant 2012;47:706-15
- McDonald GB, Sharma P, Matthews DE, et al. Venocclusive disease of the liver after bone marrow transplantation: diagnosis, incidence, and predisposing factors. Hepatology 1984;4:116-22
- Jones RJ, Lee KS, Beschorner WE, et al. Venoocclusive disease of the liver following bone marrow transplantation. Transplantation 1987;44:778-83
- Mohty M, Malard F, Abecassis M, et al. Revised diagnosis and severity criteria for sinusoidal obstruction syndrome/veno-occlusive disease in adult patients: a new classification from the European Society for Blood and Marrow Transplantation. Bone Marrow Transplant 2016;51:906-12
- Deyo RA, Cherkin DC, Ciol MA. Adapting a clinical comorbidity index for use with ICD-9-CM administrative databases. J Clin Epidemiol 1992;45:613-19
- Weichle T, Hynes DM, Durazo-Arvizu R, et al. Impact of alternative approaches to assess outlying and influential observations on health care costs. Springerplus 2013;2:614
- Li Z, Mahendra G. Using “recycled predictions” for computing marginal effects, statistics and data analysis. SAS Global Forum; 2010, Paper 272–2010. http://support.sas.com/resources/papers/proceedings10/272-2010.pdf. [Last access 20 October 2016]
- Saito AM, Cutler C, Zahrieh D, et al. Costs of allogeneic hematopoietic cell transplantation with high-dose regimens. Biol Blood Marrow Transplant 2008;14:197-207
- Tsirigotis PD, Resnick IB, Avni B, et al. Incidence and risk factors for moderate-to-severe veno-occlusive disease of the liver after allogeneic stem cell transplantation using a reduced intensity conditioning regimen. Bone Marrow Transplant 2014;49:1389-92
- Pastores SM, Papadopoulos E, van den Brink M, et al. Septic shock and multiple organ failure after hematopoietic stem cell transplantation: treatment with recombinant human activated protein C. Bone Marrow Transplant 2002;30:131-4
- Kumar G, Ahmad S, Taneja A, et al. Severe sepsis in hematopoietic stem cell transplant recipients. Crit Care Med 2015;43:411-21
- Espérou H, Brunot A, Roudot-Thoraval F, et al Predicting the costs of allogeneic sibling stem-cell transplantation: results from a prospective, multicenter, French study. Transplantation 2004;77:1854-8
- Stranges E, Russo CA, Friedman B. Procedures with the most rapidly increasing hospital costs, 2004–2007. HCUP Statistical Brief #82. Rockville, MD: Agency for Healthcare Research and Quality; 2009. http://www.hcup-us.ahrq.gov/reports/statbriefs/sb82.pdf [Last accessed 20 October 2016]
- Cesaro S, Pillon M, Talenti E, et al. A prospective survey on incidence, risk factors and therapy of hepatic veno-occlusive disease in children after hematopoietic stem cell transplantation. Haematologica 2005;90:1396-404
- Mohty M, Malard F, Abecassis M, et al. Revised diagnosis and severity criteria for sinusoidal obstruction syndrome/veno-occlusive disease in adult patients: a new classification from the European Society for Blood and Marrow Transplantation. Bone Marrow Transplant 2016;51:906-12
- Dignan FL, Wynn RF, Hadzic N, et al. BCSH/BSBMT guideline: diagnosis and management of veno-occlusive disease (sinusoidal obstruction syndrome) following haematopoietic stem cell transplantation. Br J Haematol 2013;163:444-57
- Majhail NS, Mau LW, Denzen EM, et al. Costs of autologous and allogeneic hematopoietic cell transplantation in the United States: a study using a large national private claims database. Bone Marrow Transplant 2013;48:294-300