
Abstract
Aims: To calculate the cost reduction associated with diarrhea/flushing symptom resolution/improvement following treatment with above-standard dose octreotide-LAR from the commercial payor’s perspective.
Materials and methods: Diarrhea and flushing are two major carcinoid syndrome symptoms of neuroendocrine tumor (NET). Previously, a study of NET patients from three US tertiary oncology centers (NET 3-Center Study) demonstrated that dose escalation of octreotide LAR to above-standard dose resolved/improved diarrhea/flushing in 79% of the patients within 1 year. Time course of diarrhea/flushing symptom data were collected from the NET 3-Center Study. Daily healthcare costs were calculated from a commercial claims database analysis. For the patient cohort experiencing any diarrhea/flushing symptom resolution/improvement, their observation period was divided into days of symptom resolution/improvement or no improvement, which were then multiplied by the respective daily healthcare cost and summed over 1 year to yield the blended mean annual cost per patient. For patients who experienced no diarrhea/flushing symptom improvement, mean annual daily healthcare cost of diarrhea/flushing over a 1-year period was calculated.
Results: The economic model found that 108 NET patients who experienced diarrhea/flushing symptom resolution/improvement within 1 year had statistically significantly lower mean annual healthcare cost/patient than patients with no symptom improvement, by $14,766 (p = .03). For the sub-set of 85 patients experiencing resolution/improvement of diarrhea, their cost reduction was more pronounced, at $18,740 (p = .01), statistically significantly lower than those with no improvement; outpatient costs accounted for 56% of the cost reduction (p = .02); inpatient costs, emergency department costs, and pharmacy costs accounted for the remaining 44%.
Limitations: The economic model relied on two different sources of data, with some heterogeneity in the prior treatment and disease status of patients.
Conclusions: Symptom resolution/improvement of diarrhea/flushing after treatment with an above-standard dose of octreotide-LAR in NET was associated with a statistically significant healthcare cost decrease compared to a scenario of no symptom improvement.
Introduction
Neuroendocrine tumors (NETs) are rare, slow-growing tumors that originate in the hormone-producing cells of the body’s neuroendocrine system. The general regions affected include the pancreas, lungs, colon, stomach, small intestine, and rectum. NETs can commonly be divided into two types: pancreatic, also known as pancreatic islet cell tumors, and carcinoid, generally arising from the gut or bronchopulmonary systemCitation1. According to an analysis of the 2007 National Cancer Institute’s Surveillance, Epidemiology and End Results (SEER) database from 2003–2007, the incidence of NET was 5.76 new cases per 100,000 persons, and the prevalence was estimated to be ∼35 per 100,000 persons in 2004Citation2,Citation3. The incidence of NET has increased 5-fold since 1973Citation1,Citation4.
The primary clinical manifestation of functional NETs is carcinoid syndrome (CS), which consists of four key symptoms: flushing (occurs in 94% of patients with carcinoid syndrome), diarrhea (78%), cardiac disease caused by valvular heart lesions (53%), and abdominal pain or cramping (51%)Citation5–7. Carcinoid syndrome occurs in ∼8–35% of patients with well-differentiated NETs, most typically in the GI tract, with incidence ranging from 1.7–18.4%Citation8,Citation9. A recent analysis of SEER data from 2000–2011 among patients 65 years of age or older with any stage NET found that the incidence rate of CS has increased from 11% in 2000 to 19% in 2011Citation10. The first-line systemic therapy for metastatic NETs frequently includes somatostatin analogs (SSAs) such as octreotide or lanreotide. SSAs inhibit the secretion of gastrointestinal hormones and alleviate symptoms of CS associated with advanced pancreatic NETsCitation11,Citation12, such as diarrhea and flushing, and hormonal syndromeCitation13.
Although the majority of patients (over 70%) initially respond to symptomatic treatment of CS with SSAsCitation12, dose escalation with SSAs has been successfully demonstrated to further improve symptom controlCitation14,Citation15. In the NET 3-Center study, a retrospective study at three oncology centers in the US examining 239 NET patients who had been treated with an above-standard dose of octreotide LAR for carcinoid or hormonal syndrome or radiographic progression, the majority of patients who had reported CS symptoms experienced symptom resolution or improvement within 1 year after first dose escalation (diarrhea: 79%, flushing: 81%)Citation16. A recent systematic review of dose escalation instances confirms that clinical evidence and expert clinical opinion agree with these findings of CS symptom improvementCitation14.
It is currently unknown what the economic impact of CS symptom improvement or resolution might be on the healthcare costs or resource utilization of patients with CS. The current study aims to quantify the potential cost reduction associated with CS symptom resolution or improvement following treatment with an above-standard dose of octreotide LAR using an economic modeling approach based on clinical data obtained from the previously published NET 3-Center study.
Methods
Cost model overview
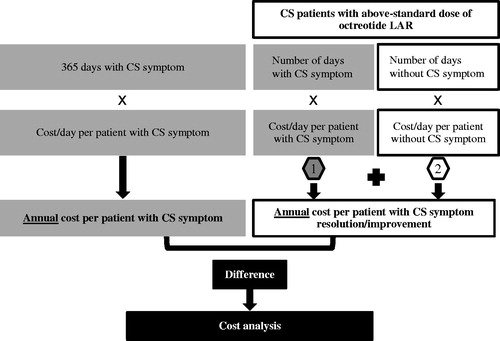
The economic model was developed using a US commercial payor’s perspective. The model estimated the incremental costs associated with CS symptom resolution or improvement by calculating the cost difference between the average annual per-patient costs of patients who experienced vs who did not experience resolution or improvement of CS-related flushing or diarrhea during the 12-month study period. illustrates the model structure. The model assessed total healthcare cost, including the individual cost components of inpatient, outpatient, emergency department (ED), and pharmacy costs.
Figure 1. Cost model.
Data sources
Study population
The study population for the economic model is based on the NET 3-Center studyCitation16. This study was a retrospective chart review of patients who were treated with an above-standard dose of octreotide LAR between January 2000 and December 2012 at three large tertiary oncology centers in the US: Dana-Farber Cancer Institute, Boston, MA; Robert H. Lurie Comprehensive Cancer Center of Northwestern University, Chicago, IL; and Moffitt Cancer Center and Research Institute, Tampa, FL. The NET-3 Center study was approved by the individual Institutional Review Boards, and de-identified data in compliance with the Health Insurance Portability and Accountability Act of 1996 (HIPAA) were used.
The study focused on adult patients over 18 years old who had a confirmed diagnosis of advanced carcinoid or pancreatic NET, and who had at least one dose escalation of octreotide LAR (i.e. had an increase in the dosage or dosing frequency of octreotide LAR above the standard dose of 30 mg every 4 weeks). The study excluded patients with poorly differentiated or high-grade tumors. To be included in the current analysis, patients needed to have at least 3 months of reported CS symptoms of interest (flushing or diarrhea) prior to the date of octreotide LAR dose escalation, and have recorded symptom status during the 12 months study period.
Two CS symptom populations were analyzed: (1) patients who experienced either flushing or diarrhea; and (2) patients who experienced diarrhea (irrespective of flushing). The two study populations were not mutually exclusive, as some of the patients in the diarrhea cohort also experienced flushing. Although flushing is a commonly reported CS symptom, it may not be severe enough to be the sole reason for seeking clinical treatment or hospitalization; therefore, the impact on healthcare costs for the relief of this symptom may be less.
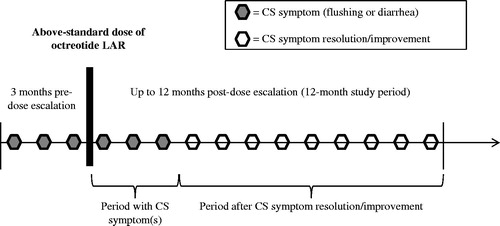
illustrates the NET 3-Center study’s design. All patients evaluated in the NET 3-Center study received at least one dose of octreotide LAR above the standard dose of 30 mg intragluteally every 4 weeks, resulting in an average dose of 45.3 mg.
Figure 2. Study design scheme.
Clinical inputs
Symptom resolution or improvement during the 12-month study period was determined based on the physician’s notes in medical records from the NET 3-Center study. The number of patients with diarrhea or with flushing/diarrhea and the average number of person-days with each symptom pre- and post-resolution/improvement are reported in . For patients whose medical charts noted having achieved symptom resolution or improvement during the study period, but the specific date of symptom resolution or improvement was unknown, their duration of symptom resolution or improvement was imputed based on the average number of days with symptoms of patients for whom this data was known. This adjustment was made for 29 patients in the flushing or diarrhea cohort, and for 24 patients in the diarrhea cohort.
Table 1. Clinical inputs from the NET 3-center chart review study for the cost model.
Cost inputs
Since the NET 3-Center study did not capture data on costs or healthcare utilization patterns, these data were obtained from a separate study by Broder et al. on the cost impact of CS-related symptoms in patients with NETs, which analyzed claims data from the Truven Health Analytics MarketScan healthcare claims database (2003–2012)Citation17–19.
Daily per-patient costs from this claims data analysis were stratified by symptom type, and were annualized and adjusted using multivariate OLS regression (adjusting for age, gender, region, chronic conditions, and Charlson comorbidity index). Costs were inflated to 2014 USD using the Medical Care component of the Consumer Price Index (CPI)Citation20, and applied to each patient scenario, as follows:
The inpatient cost was calculated as the product of the total inpatient cost among patients with hospitalization and the probability of hospitalization;
The emergency department (ED) cost was calculated as the product of the total ED costs among patients with ED visits and the probability of an ED visit; and
Pharmacy costs included an annualized mix of outpatient prescriptions for octreotide (any dose), lanreotide, cytotoxic chemotherapy, everolimus, sunitinib, interferon alpha, as well as medical procedures—including liver resection or cytoreduction, liver transplantation, embolization, chemoembolization, and radiofrequency ablation.
displays the cost inputs derived from Broder et al.Citation17–19.
Table 2. Cost inputs from claims data analysis.
The cost inputs for the group of patients with flushing or diarrhea included the prorated cost for patients with flushing for the proportion of patients who exhibited flushing without diarrhea, and the prorated cost for patients with diarrhea for the proportion of patients who had diarrhea with or without flushing. The distribution of the two CS symptoms was obtained from the NET 3-Center studyCitation16. Since the costs obtained from the claims data analysis were not incremental for each symptom and, thus, not additive, blending the costs this way ensured that costs were not double-counted for patients exhibiting both symptoms.
Cost analysis
Main analysis
The main outcome measure of this analysis was the cost difference between the annual per-patient costs for patients with vs without CS symptom resolution or improvement.
Annual mean costs for patients having symptom resolution or improvement were computed as the sum of the mean costs for the period before symptom resolution or improvement and the mean costs for the period after symptom resolution or improvement until the end of the 1-year study period. The mean costs for the period before symptom resolution or improvement were calculated as the product of the average number of days with each symptom until symptom resolution or improvement (derived from the NET 3-Center studyCitation16), multiplied by the daily cost associated with the respective symptom (derived from the study on the cost impact of CS-related symptomsCitation17–19). The mean costs for the period after symptom resolution or improvement were calculated as the average number of remaining days until the end of the 1-year study period multiplied by the daily cost for patients without each symptom.
The cost comparison of patients with CS symptom(s) and patients with CS symptoms resolution or improvement was performed using a two-sample t-test with unequal variance (Satterthwaite’s method)Citation21,Citation22. All analyses used a two-sided p-value of 0.05 to determine statistical significance. Analyses were performed using Microsoft Excel (2010) software.
Sensitivity analysis
The indirect cost for loss of work productivity due to CS symptoms was considered, in addition to the direct healthcare costs in the main analysis model. The indirect work loss cost was calculated by estimating the loss of wages due to absenteeism due to inpatient, outpatient, and ED visits for patients under 65 years of age. The number of patients under 65 years within each group was obtained from the NET 3-Center studyCitation16 (). Inputs on the number of hospital days and outpatient and ED visits were obtained from the claims data analysisCitation17–19. Inpatient stay assumed 8 h of loss of wages per day, multiplied by the number of hospital days. Outpatient and ED visits were assumed to be 4 h in duration, and were multiplied by the number of visits. The number of hours lost from work was then multiplied by the hourly national average labor wage (mean = $22.71/h, SD = $263.99/h)Citation23 to derive the indirect cost for loss in work productivity.
Table 3. Clinical inputs for patients under 65 years of age from the Net 3-Center chart review study.
Results
Main analysis
During the 12-month study period after the dose escalation of octreotide LAR, patients with CS symptom resolution or improvement in the flushing/diarrhea group had significantly lower annual mean total healthcare costs per patient of $14,766 (p = .03) compared to patients who had CS symptoms (). Outpatient healthcare costs contributed the largest percentage of the cost savings such that patients with CS symptom resolution or improvement had significantly lower annual mean outpatient healthcare costs per patient by $8,905 (p = .03). The annual mean inpatient, ED, and pharmacy costs per patient were found to be numerically lower for patients with flushing or diarrhea resolution or improvement by $3,891 (p = .44), $174 (p = .58), and $1,417 (p = .15), respectively.
Table 4. Cost reduction associated with CS symptom resolution or improvement: main analysis, healthcare cost.
Similarly, patients with resolution or improvement of diarrhea had statistically significantly lower annual mean total healthcare costs per patient by $18,740 (p = .01) than patients with diarrhea, with outpatient costs accounting for most of the difference (mean difference = $10,467, p = .02). The annual mean inpatient, ED, and pharmacy costs per patient were numerically lower for patients with diarrhea resolution/improvement by $6,104 (p = .30), $213 (p = .57), and $1,603 (p = .15), respectively.
Sensitivity analysis
Considering the indirect cost of work loss due to inpatient, outpatient, and ED visits for patients under 65 years of age resulted in an additional annual total cost reduction of $273 for patients who achieved resolution or improvement of CS-related flushing or diarrhea (). After accounting for indirect costs, cost savings remained statistically significant for total healthcare and outpatient costs in patients with resolution or improvement of flushing or diarrhea by $15,039 (p = .03) and $9,062 (p < .05), respectively, compared to patients with symptoms. Similar findings were observed for the comparison between patients with and without resolution or improvement of diarrhea, who had additional annual total cost savings of $358 per patient, significantly lower total costs by $19,098 (p = .01), and significantly lower outpatient costs by $10,644 (p = .03).
Table 5. Cost reduction associated with CS symptom resolution or improvement: sensitivity analysis, direct healthcare, and indirect work loss costs.
Discussion
In the development of this economic model, this study integrated cost data from a claims analysis, with clinical practice data showing the benefits of improvement or resolution of CS symptoms following treatment with above-standard dose of octreotide LAR. This study found that economic benefits were observed among patients with CS symptom resolution or improvement compared to patients who continued to have CS symptoms during the 12-month study period. The greatest cost savings were from the reduction in outpatient costs. A sensitivity analysis that accounted for indirect work loss costs from the employers’ perspective in addition to direct healthcare costs from the insurance payers’ perspective provided further evidence for the conclusion of significant cost reduction associated with CS symptom resolution or improvement in NET patients.
The results of this economic evaluation of the benefits of above-standard dose octreotide LAR extend the clinical findings of the NET 3-Center study, which demonstrated improved symptom control among the vast majority (79%) of NET patients with CS symptoms of diarrhea or flushing within their first year of octreotide LAR dose escalationCitation16. The clinical benefit and tolerability of an above-standard dose of octreotide LAR in treating advanced NET patients with CS symptoms was also demonstrated in a number of prior studiesCitation15,Citation24,Citation25, and expert clinical opinion supports dose escalation of somatostatin analogs for refractory hormonal symptomsCitation14.
Prior literature has established that CS symptoms impose a considerable economic burden. Substantial total monthly healthcare costs in the 12 month post-NET diagnosis period were also reported by Chuang et al.Citation26 in an analysis of a US administrative claims database: $9,093 per patient per month among the cohort who received medical therapy, where the majority (72%) had CS symptoms, and $8,810 among the cohort who received surgical therapy, where 40% of the patients had CS symptoms. In the claims data analysis used for cost inputs for this model, Broder et al.Citation19 reported significantly higher (p < .05) healthcare cost and medical resource utilization in newly-diagnosed CS patients with diarrhea than in those without, and concluded that the management of diarrhea in patients with CS should reduce costs and utilization. That study did not evaluate any treatments specifically. In another study that performed a review of the use of octreotide to control the debilitating symptoms of cancer-related diarrheas (including NET CS-related diarrhea), Peeters et al.Citation27 concluded that, while the cost of a therapeutic regimen with octreotide for patients with refractory diarrhea was substantially greater than that of a non-specific therapy, it led to lower overall cost, because it avoided the need for further treatment and/or hospitalization with intravenous fluid supplementation. Our economic model bridges the knowledge gap of these prior studies by quantifying the economic benefits of CS symptom resolution or improvement associated with treating patients with NET with octreotide LAR.
Achieving timely resolution or improvement of CS symptoms not only brings demonstrable clinical and economic benefits to patients, but could also relieve the humanistic burden of the syndrome. In one cross-sectional study, the health-related quality-of-life (QoL) of patients with NET was worse on all sub-scales of the SF-36 and PROMIS-29 QoL instruments than that of the general population or that of a mixed sample of cancer patientsCitation28. Additionally, even after adjusting for clinical and demographic characteristics, NET patients with an increased number of bowel movements or flushing episodes in that study experienced poorer QoL than NET patients without flushing or diarrhea.
While the current economic analysis has robustly demonstrated the economic benefit of dose escalation with octreotide LAR for the treatment of CS symptoms in NET patients, the study has a few limitations. First, the clinical information in the current model was derived from patients who received an above-standard dose of octreotide LAR, while cost and healthcare resource utilization information was derived from an analysis of patients who were treated with standard or with above-standard octreotide LAR dosing. As a result, the assumed healthcare costs for the duration of the 12-month study period may differ from actual costs for patients who use above-standard doses of octreotide LAR and do not experience CS symptom resolution or improvement. Therefore, a study that directly assesses the costs and healthcare resource utilization of non-responding—in terms of CS symptom control—NET patients with CS symptoms treated with standard vs above-standard dose of octreotide LAR is warranted. Second, this model does not take into account the possibility of a relapse of CS symptoms during the 12-month period, because this was not assessed in the NET 3-Center study. Third, healthcare costs associated with treatment of NET patients with or without CS symptoms were estimated using healthcare claims data analysis and, therefore, are subject to some limitations of claims data, such as harboring the potential for inaccuracies in coding of clinical conditions, data misclassification, or under-reporting of clinical symptoms and costs. For example, the claims data analysis that was used for providing cost inputs for this cost model found flushing coded in the claims of only 5.4% of the sample of 2,822 newly-diagnosed patients with CS, while much higher rates of flushing are expectedCitation18. In order to adequately assess the burden of flushing, future study is needed. Finally, there is some heterogeneity in the prior treatment and disease status of patients examined in the NET 3-Center study vs those in the healthcare claims data analysis, such as (1) patients with poorly differentiated or high-grade tumors were excluded from the NET 3-Center analysis but were probably included in claims data; (2) patients in the claims data analysis were newly-diagnosed (i.e. within 1 year) with NET, and their disease severity and tumor characteristics are unknown due to the nature of claims data. Since patients in the claims database were, on average, younger than patients in the NET 3-Center study, using the estimated healthcare costs for patients with or without CS symptoms from the healthcare claims database may yield conservative estimates of any economic benefits of symptom resolution or improvement if the cost of symptomatic chronic CS increases with time.
Conclusions
This study modeled the economic benefits of CS symptom resolution and improvement among NET patients treated with an above-standard dose of octreotide LAR, and found a statistically significant annual mean total healthcare cost reduction of ∼ $15,000–$19,000 per patient, including also indirect cost. These economic benefits are in addition to any potential improvements in quality-of-life and physical functioning that might be associated with CS symptom control.
Transparency
Declaration of funding
Funding for this research was provided by Novartis Pharmaceuticals Corporation. The study sponsor was involved in all stages of the study research and manuscript preparation, but all authors participated in the design of the study and contributed to the manuscript development.
Declaration of financial/other interests
LH, TT, FV, and MSD are employees of Analysis Group, Inc., which has received funding for this research from Novartis Pharmaceuticals Corporation. MPN is an employee of Novartis Pharmaceuticals Corporation, the sponsor of this study. ABB has previously received consultant fees from Novartis Pharmaceuticals Corporation.
Previous presentations
A synopsis of the current research was presented in poster format at the International Society of Gastrointestinal Oncology (ISGIO) Annual Conference (October 22–23, 2015, Arlington, VA), the Academy of Managed Care Pharmacy (AMCP) Annual Meeting (April 19–22, 2016, San Francisco, CA), and the International Society for Pharmacoeconomics and Outcomes Research (ISPOR) 21st Annual International Meeting (May 21–25, 2016, Washington, DC).
Acknowledgments
The authors are grateful to Matthew H. Kulke, MD, of Dana-Farber Cancer Institute, and Jonathan R. Strosberg, MD, of Moffitt Cancer Center, for providing access to NET 3-Center study data for these analyses. The authors would also like to thank Ana Bozas, PhD, of Analysis Group, Inc., for her editorial assistance, and Michael Hellstern, of Analysis Group, Inc., for his assistance with analysis and writing.
Related Research Data
References
- Yao JC, Hassan M, Phan A, et al. One hundred years after ‘carcinoid’: epidemiology of and prognostic factors for neuroendocrine tumors in 35,825 cases in the United States. J Clin Oncol 2008;26:3063-72
- Lawrence B, Gustafsson BI, Chan A, et al. The epidemiology of gastroenteropancreatic neuroendocrine tumors. Endocrinol Metab Clin North Am 2011;40:1-18, vii
- Frilling A, Akerstrom G, Falconi M, et al. Neuroendocrine tumor disease: an evolving landscape. Endocr Relat Cancer 2012;19:R163-85
- Modlin IM, Oberg K, Chung DC, et al. Gastroenteropancreatic neuroendocrine tumours. Lancet Oncol 2008;9:61-72
- Creutzfeldt W. Carcinoid tumors: development of our knowledge. World J Surg 1996;20:126-31
- Rorstad O. Prognostic indicators for carcinoid neuroendocrine tumors of the gastrointestinal tract. J Surg Oncol 2005;89:151-60
- Kaehler HJ, Heilmeyer L. [Clinical aspects and pathophysiology of carcinoid and carcinoid syndrome with special reference to the pharmacology of 5-hydroxytryptamine]. Ergeb Inn Med Kinderheilkd 1961;16:292-559
- Soga J. Carcinoids and their variant endocrinomas. An analysis of 11842 reported cases. J Exp Clin Cancer Res 2003;22:517-30
- DeVita VT, Lawrence TS, Rosenberg SA. DeVita, Hellman, and Rosenberg’s Cancer: principles & practice of oncology review. Philadelphia, PA, USA: Lippincott Williams & Wilkins; 2008
- Halperin DM, Shen C, Dasari A, et al. Frequency of carcinoid syndrome at neuroendocrine tumour diagnosis: a population-based study. Lancet Oncol 2017;18:525-34
- O’Toole D, Ducreux M, Bommelaer G, et al. Treatment of carcinoid syndrome: a prospective crossover evaluation of lanreotide versus octreotide in terms of efficacy, patient acceptability, and tolerance. Cancer 2000;88:770-6.
- Toumpanakis C, Caplin ME. Update on the role of somatostatin analogs for the treatment of patients with gastroenteropancreatic neuroendocrine tumors. Semin Oncol 2013;40:56-68.
- Strosberg JR. Systemic treatment of gastroenteropancreatic neuroendocrine tumors (GEP-NETS): current approaches and future options. Endocr Pract 2014;20:167-75
- Broder MS, Beenhouwer D, Strosberg JR, et al. Gastrointestinal neuroendocrine tumors treated with high dose octreotide-LAR: a systematic literature review. W J Gastroenterol 2015;21:1945-55.
- Strosberg JR, Weber J, Feldman M, et al. Above-label doses of octreotide-LAR in patients with metastatic small intestinal carcinoid tumors. Gastrointest Cancer Res 2013;6:81-5
- Strosberg JR, Benson AB, Huynh L, et al. Clinical benefits of above-standard dose of octreotide LAR in patients with neuroendocrine tumors for control of carcinoid syndrome symptoms: a multicenter retrospective chart review study. Oncologist 2014;19:930-6
- Broder MS, Chang E, Cherepanov D, et al. The cost impact of non-infectious diarrhea in patients with carcinoid syndrome. North American Neuroendocrine Tumor Society (NANETS) Symposium. Austin, TX: Pancreas 2016;45:472
- Novartis unpublished data on file: health resource utilization and costs of patients with carcinoid syndrome-related flushing; 2015
- Broder MS, Chang E, Romanus D, et al. Healthcare and economic impact of diarrhea in patients with carcinoid syndrome. W J Gastroenterol 2016;22:2118-25
- Bureau of Labor Statistics. Consumer price index for all urban consumers (CPI-U): medical care. Washington, DC: Bureau of Labor Statistics; 2014
- Ruxton GD. The unequal variance t-test is an underused alternative to student’s t-test and the Mann–Whitney U test. Behav Ecol 2006;17:688-90
- Neuhäuser M. Two-sample tests when variances are unequal. Animal Behav 2002;63:823-5
- Bureau of Labor Statistics. May 2014 national occupational employment and wage estimates. Washington, DC: US Bureau of Labor Statistics; 2015. http://www.bls.gov/oes/2014/may/oes_nat.htm. Accessed June 6, 2016
- Chadha MK, Lombardo J, Mashtare T, et al. High-dose octreotide acetate for management of gastroenteropancreatic neuroendocrine tumors. Anticancer Res 2009;29:4127-30
- Ferolla P, Faggiano A, Grimaldi F, et al. Shortened interval of long-acting octreotide administration is effective in patients with well-differentiated neuroendocrine carcinomas in progression on standard doses. J Endocrinol Invest 2012;35:326-31
- Chuang CC, Bhurke S, Chen SY, et al. Clinical characteristics, treatment patterns, and economic burden in patients treated for neuroendocrine tumors in the United States: a retrospective cohort study. J Med Econ 2015;18:126-36
- Peeters M, Van den Brande J, Francque S. Diarrhea and the rationale to use Sandostatin. Acta Gastroenterol Belg 2010;73:25-36
- Beaumont JL, Cella D, Phan AT, et al. Comparison of health-related quality of life in patients with neuroendocrine tumors with quality of life in the general US population. Pancreas 2012;41:461-6