
Abstract
Aims: In the absence of clinical data, accurate identification of cost drivers is needed for economic comparison in an alternate payment model. From a health plan perspective using claims data in a commercial population, the objective was to identify and quantify the effects of cost drivers in economic models of breast, lung, and colorectal cancer costs over a 6-month episode following initial chemotherapy.
Research design and methods: This study analyzed claims data from 9,748 Cigna beneficiaries with diagnosis of breast, lung, and colorectal cancer following initial chemotherapy from January 1, 2014 to December 31, 2015. We used multivariable regression models to quantify the impact of key factors on cost during the initial 6-month cancer care episode.
Results: Metastasis, facility provider affiliation, episode risk group (ERG) risk score, and radiation were cost drivers for all three types of cancer (breast, lung, and colorectal). In addition, younger age (p < .0001) and human epidermal growth factor receptor-2 oncogene overexpression (HER2+)-directed therapy (p < .0001) were associated with higher costs in breast cancer. Younger age (p < .0001) and female gender (p < .0001) were also associated with higher costs in colorectal cancer. Metastasis was also associated with 50% more hospital admissions and increased hospital length of stay (p < .001) in all three cancers over the 6-month episode duration. Chemotherapy and supportive drug therapies accounted for the highest proportion (48%) of total medical costs among beneficiaries observed.
Conclusions: Value-based reimbursement models in oncology should appropriately account for key cost drivers. Although claims-based methodologies may be further augmented with clinical data, this study recommends adjusting for the factors identified in these models to predict costs in breast, lung, and colorectal cancers.
Introduction
Significant reductions in morbidity and mortality have arisen from early detection and advances in cancer treatments, but these advances have led to rising costs which are unsustainableCitation1,Citation2. Cancer care costs in the US have risen from $72 billion in 2004 to $125 billion in 2010, and are expected to reach $173 billion by 2020Citation1. Despite the increasing cost of cancer care, an Institute of Medicine report from 2013 concluded that Page 2 of IOM report “cancer care is often not as patient-centered, accessible, coordinated, or evidence-based as it could be”Citation1, and that the various secular and economic trends presented a looming crisis. Preventive measures, early detectionCitation3, coordinated, patient-centered, evidence-based careCitation4, and alternate payment models (APMs)Citation5–8 have been proposed as ways to stem this economic crisis.
Financial incentives that reward providers for improved quality with appropriate utilization have been shown to reduce the total cost of care in oncology, without compromising qualityCitation3. Cancer care can have multiple cost drivers that depend on different cancer sub-types, as well as factors such as stage, treatment options, goals of therapy, and patient preferences. The costs of novel cancer drugs continue to rise; as a health plan we conducted a focused analysis on patients who receive chemotherapy, due to its impact on cancer care costsCitation3. Payers and providers face several challenges in measuring performance, defining value, measuring quality, and changing reimbursement to support effective cancer care. One such challenge for health plans is lack of detailed clinical data suitably robust across categories for risk stratification in order to accurately compare cancer care costs. Our analytic objective was to use multivariable regression models to identify and quantify the effects of cost drivers in breast, lung, and colorectal cancer costs over a 6-month episode following initial chemotherapy.
Patients and methods
We conducted a retrospective cohort study utilizing claims data from Cigna beneficiaries. Cigna is a large commercial health services company and insurance provider in the US. Beneficiaries aged 18–65 years with breast, lung, or colon cancer who began new chemotherapy from January 1, 2014 to December 31, 2015 were included. In order to classify new cases for inclusion, we included beneficiaries with continuous coverage and at least one chemotherapy claim (including cytotoxic, targeted, and immunotherapies, but excluding all oral drugs) paid from their medical benefit plan within the stated timeframe. For each beneficiary, we tracked back 6 months prior to verify that there were no previous chemotherapy claims; this was done to capture costs over a 6-month episode of care following new chemotherapyCitation5. For each episode, the trigger date was identified as the first chemotherapy date, and the episode window was defined as the time from the trigger date to 6 months afterward. This time period was chosen because our analysis showed that the majority of spend occurred in this timeframe following initial chemotherapy; this timeframe for a care episode can be seen also in the Centers for Medicare and Medicaid Services Oncology Care ModelCitation6.
We included the following factors in the analysis: age, human epidermal growth factor receptor 2 oncogene overexpression (HER2+)-directed therapy (for breast cancer), radiation as determined by current procedural terminology (CPT) codes (see Appendix), provider affiliation based on tax ID and fee schedule (classified dichotomously as [a] community based, or independent providers, vs [b] facility based, or providers affiliated with a hospital), and metastasis.
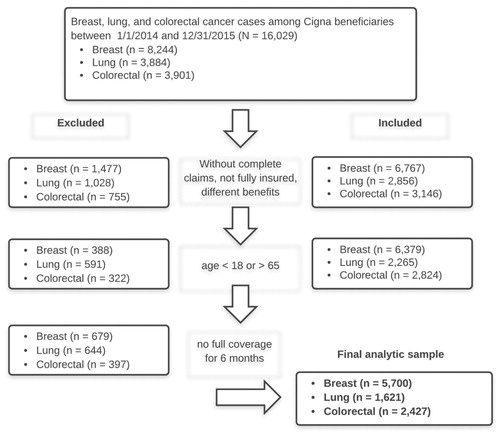
For all cancers, the presence of metastasis was determined by international classification of diseases (ICD)-9 codes beginning with 197, or equal to 198, 198.0, 198.1, 198.2, 198.3, 198.4, 198.5, 198.6, 198.7, 198.81, 198.82, or 198.89. We used chemotherapy claims and episode risk group (ERG) scoresCitation7 to further stratify the population. We then used claims with Healthcare Common Procedure Coding System (HCPCS) codes for trastuzumab: J9355, C9131, or J9354 (ado-trastuzumab and pertuzumab) as proxies for HER2+ breast cancers. Claims for VEGF (vascular endothelial growth factor)-directed therapies bevacizumab (J9035) and EGFR (epidermal growth factor receptor)-directed therapies (J9055, J9303) including cetuximab (J9055) and panitumumab (J9303) were used as proxies for metastatic disease in colon cancer. Likewise VEGF-directed therapy bevacizumab (J9035) was used as a proxy for metastatic disease in lung cancer; this method is accepted for classifying metastasis in claims dataCitation9,Citation10. In order to get complete data for the defined episode of care following new infusion chemotherapy, we excluded beneficiaries who had incomplete claims, were not fully insured, did not have 6 months of enrollment, or were not aged 18–65 years (see ).
Figure 1. Flow diagram of study inclusion and exclusion criteria.
These cancer-related factors were used in addition to Episode Risk Group (ERG) risk scores in order to examine the additional impact on cost of specific cancer-related characteristics. Patient-level risk scores used for adjustment were calculated using Optum Insight’s (formerly Ingenix) methodology, which relies on underlying medical conditions for the general population. ERG risk score is an estimate of expected cost burden per patient based on both general diagnostic information and retrospective review of costs over the prior 12 months. ERG risk score is an established method to control for variations due to patient comorbidities, ignoring impacts of unit cost, steerage opportunities, and/or utilizationCitation10.
During the episode, we also included costs that were not cancer-related if at least $500 were incurred for a given comorbidity, including: (a) hypertension, (b) IHD, (c) chronic obstructive pulmonary disease, (d) congestive heart failure, and (e) cardiomyopathy.
Winsorization is a two-sided truncation adjustment that limits the impact of outliers on the average expenditures. We used this method to truncate episode expenditure estimates at the 5th and 95th percentiles of per-episode expenditures by cancer type. Specifically, episode expenditures below the 5th percentile by cancer type were set to the 5th percentile, and episode expenditures above the 95th percentile were set to the 95th percentile within cancer type. This approach aligns with the methodology that the Centers for Medicare and Medicaid Services (CMS) has used for the oncology care modelCitation6.
We calculated episode costs as total medical (cancer and non-cancer) costs per member per episode for 6 months, from the time of the first chemotherapy treatment. We excluded pharmacy costs because approximately half the study population did not have pharmacy benefits through Cigna. However, costs for treatments such as injectable chemotherapy or supportive drugs incurred on the medical benefit were included.
To understand the impact of factors on the 6-month episode cost, we used generalized linear regression models with a log link and gamma distribution, including as predictors patient demographic factors, underlying ERG risk score, stage, treatments, and facility type. The data analysis for this paper was generated using SAS software, Version 9 of the SAS System (© 2013 SAS Institute Inc.). Likelihood ratio statistics were computed between successive models. In addition, we performed cross-validation by temporarily withholding 30% of the sample as the validation dataset; the remaining 70% was the development dataset, using stratified randomization in order to maintain sample characteristics. The datasets were recombined for the final models. Model fit was assessed using Scaled Pearson Chi-Square.
Results
Sample demographic and clinical characteristics are shown in . Mean age at time of chemotherapy was 50.5 years (SD = 8.7) in breast cancer as compared to lung (Mean = 57.0 years, SD = 6.3) and colorectal (Mean = 52.7 years, SD = 8.1) cancers. Lung cancer patients had highest ERG risk score (Mean = 19.81, SD = 9.3) compared with the other two cancer types. Diabetes was the most common comorbidity across cancer types (see ). As shown in , metastatic disease and facility-based provider affiliation were associated in a univariate fashion with significantly higher costs in all three cancer types (breast, lung, and colorectal). Results of the multivariable regression model in breast cancer (n = 5,692) indicated that metastatic disease, higher ERG risk score, radiation, younger age, HER2+-directed therapy, and facility provider type contributed significantly to higher cost (see ). As shown in , in lung cancer (n = 1,618), significant cost drivers identified were metastatic disease, higher ERG risk score, radiation therapy, and facility provider type. As shown in , in colorectal cancer (n = 2,423), significant cost drivers identified were metastatic disease, ERG risk score, radiation therapy, younger age, female gender, and facility provider type. Model fit, as assessed by Scaled Pearson χ2, was significant at α = 0.001 for the lung and colorectal multivariable regression models, and p = 0.21 for breast (test statistics shown in table notes).
Table 1. Sample demographic and clinical characteristics.
Table 2. Costs by cancer type, facility type, year, and setting.
Table 3. Multivariable regression model maximum likelihood parameter estimates, cost drivers in breast cancer (n = 5,692).
Table 4. Multivariable regression model maximum likelihood parameter estimates, cost drivers in lung cancer (n = 1,618).
Table 5. Multivariable regression model maximum likelihood parameter estimates, cost drivers in colorectal cancer (n = 2,423).
Metastasis was also associated with greater hospital admissions (mean for no metastasis in breast = 0.23 [±0.55 SD] admissions per member compared with mean for metastasis = 0.35 [±0.69 SD], p < 0.001; p < 0.001 for lung and colon), and hospital length of stay (p < 0.001) in all three cancers over the 6-month episode duration. Chemotherapy and supportive drug therapies accounted for the highest proportion (48%) of total medical costs across all cancer types among beneficiaries observed ().
Table 6. Distribution of medical costs.
Discussion
Our objective was to evaluate our method of using claims data from a commercially insured population to quantify factors that drive higher costs between baseline and performance cohorts, over the course of a 6-month episode of care among breast, lung, and colon cancer patients. Our findings should be used to improve the ability of health plans to quantify cost drivers in oncology with accurate risk adjustment, using claims data in the absence of clinical data.
We conducted a targeted analysis of cost drivers among patients who receive chemotherapy because they are expected, based on past research, to have higher costsCitation3. This time frame is consistent with the CMS oncology cancer model, and should be considered a snapshot in time of longer-term costs. Consistent with recent studies, we also found that approximately half the cost in this duration was from chemotherapy and supportive care drug costs, and that there was significant variation in the treatment regimensCitation5,Citation12. Future studies should include other prevalent cancer types, given recent advances and the expense of newer drugsCitation13.
The higher facility costs we observed were consistent with existing researchCitation12,Citation14,Citation15, and likely due to differences in fee schedules, as well as hospitals being tertiary referral centers and managing patients who have progressed through multiple lines of therapy. It is well known that staging is a major predictor of patient outcomes and cost; our data confirmed that metastatic disease was a significant driver across all three cancer typesCitation3,Citation9,Citation10,Citation16–17.
Our findings were consistent with existing research showing substantive contribution of the ERG risk score in accounting for comorbiditiesCitation7. In breast cancer, we found that metastatic disease, HER2+ directed therapies, and younger age contributed to higher additional cost. Younger women are more likely to receive aggressive chemotherapy regimens for breast cancer than older women, which likely accounted for the finding on ageCitation18. Our findings were consistent also with existing studies on cost drivers in colorectalCitation19 and lung cancersCitation12. Radiation has also been found in recent research to be a major source of expenditures, and has been proposed as a focus for future reimbursement reformCitation20,Citation21.
One limitation of the present study was that we included patients based on chemotherapy treatment; this could affect cost estimates in breast cancer, because some patients can avoid chemotherapy during the course of their treatment. Future research can drive affordability by examining multiple triggers including surgery, biopsy, and over-utilization of various diagnostic and therapeutic strategies. Our analysis was limited by the availability of pharmacy costs in the data. Including pharmacy costs would give a better picture of the total costs of care in future analyses. Chemotherapy and supportive drug therapies accounted for the highest proportions of total medical costs in our study, but future analyses should include hormonal therapies. Another limitation was that we observed a model fit test result that was not statistically significant in our breast cancer model; as stated by de Jong and Heller, in this case conclusions based on likelihood ratio tests must be regarded as more reliable, as their statistical properties are superiorCitation22. We therefore, used the cost driver coefficients from the model to inform our conclusions.
Conclusions
Accurate risk adjustment is key to enable health plans to measure and compare costs and reward providers under APMs. Several stakeholders including health plans have been engaged in building APMs in oncology that optimize costs, utilization, and quality. This has been one of the strategies to shift from volume- to value-based care and to stem the tide of unsustainable rise in overall cost of cancer care. We recommend that payers take into account the influential cost drivers in oncology necessary to appropriately risk-adjust for disease severity when comparing baseline and performance cohorts in APMsCitation23.
Cigna’s Accountable Care Organization initiative has established a shared savings program that offers practices nationwide an incentive to improve quality and affordability. Our Specialty Care Collaborative in Oncology is built on a similar foundation, incentivizing providers to engage in APMs that reward improved quality and affordability. Our methodology builds on past research, providing a valid tool to estimate costs when only claims data are available. Inclusion of these cost drivers is critical to engage providers in APMs toward improving outcomes and reducing costs, benefitting patients, providers, and payers.
Transparency
Declaration of funding
Work was performed at, and funded by, Cigna. The Cigna name is a registered service mark used herein to refer to operating subsidiaries of CIGNA Corporation, including Cigna Health and Life Insurance Company and Cigna Behavioral Health, Inc.
Declaration of financial/other interests
All authors are employed by Cigna. JME peer reviewers on this manuscript have no relevant financial or other relationships to disclose.
Ethical Board Review Statement
This research was conducted as a quality improvement initiative by Cigna in accordance with the Declaration of Helsinki.
Acknowledgments
The authors gratefully acknowledge the technical and editorial assistance provided by Dr Stuart Lustig, and the contributions to conception and design provided by Mary Deary-Weiss.
References
- Institute of Medicine. Delivering high-quality cancer care: charting a new course for a system in crisis. Washington, DC, USA: IOM; 2013
- Young RA, DeVoe JE. Who will have health insurance in the future? An updated projection. Ann Fam Med 2012;10:156-62
- Blumen H, Fitch K, Polkus V. Comparison of treatment costs for breast cancer, by tumor stage and type of service. Am Health Drug Benefits 2016;9:23-32
- Harrington SE, Smith TJ. The role of chemotherapy at the end of life: ‘when is enough, enough?’ JAMA 2008;299:2667-78
- Bach PB, Mirkin JN, Luke JJ. Episode-based payment for cancer care: a proposed pilot for Medicare. Health Aff Proj Hope 2011;30:500-9
- Kline RM, Bazell C, Smith E, Schumacher H, Rajkumar R, Conway PH. Centers for medicare and medicaid services: using an episode-based payment model to improve oncology care. J Oncol Pract 2015;11:114-6
- Newcomer LN. Changing physician incentives for cancer care to reward better patient outcomes instead of use of more costly drugs. Health Aff Proj Hope 2012;31:780-5
- Newcomer LN, Gould B, Page RD, Donelan SA, Perkins M. Changing physician incentives for affordable, quality cancer care: results of an episode payment model. J Oncol Pr 2014;10:322-6
- Thomas SK, Brooks SE, Mullins CD, Baquet CR, Merchant S. Use of ICD-9 coding as a proxy for stage of disease in lung cancer. Pharmacoepidemiol Drug Saf 2002;11:709-13
- Whyte JL, Engel-Nitz NM, Teitelbaum A, Gomez Rey G, Kallich JD. An evaluation of algorithms for identifying metastatic breast, lung, or colorectal cancer in administrative claims data. Med Care 2015;53:e49-57
- Optum Insight. Symmetry Episode Treatment Groups: Measuring health care with meaningful episodes of care. White Paper; 2012. Available from: https://www.optum.com/content/dam/optum/resources/whitePapers/symmetry_episode_treatment_groups_wp_06_2012.pdf [last accessed 19 Jun, 2017]
- Fisher MD, Punekar R, Yim YM, Small A, Singer JR, Schukman J, McAneny BL, Luthra R, Malin J. Differences in health care use and costs among patients with cancer receiving intravenous chemotherapy in physician offices versus in hospital outpatient settings. J Oncol Pract 2017;13:e37-46
- Toy EL, Vekeman F, Lewis MC, Oglesby AK, Duh MS. Costs, resource utilization, and treatment patterns for patients with metastatic melanoma in a commercially insured setting. Curr Med Res Opin 2015;31:1561-72
- Fitch K, Pyenson B. Site of Service cost differences for medicare patients receiving chemotherapy. San Francisco, CA, USA: Milliman; 2011
- Higgins A, Veselovskiy G, Schinkel J. National estimates of price variation by site of care. Am J Manag Care 2016;22:e116-21
- Chen VW, Ruiz BA, Hsieh M-C, Wu X-C, Ries LAG, Lewis DR. Analysis of stage and clinical/prognostic factors for lung cancer from SEER registries: AJCC staging and collaborative stage data collection system. Cancer 2014;120:3781-92
- O’Connell JB, Maggard MA, Ko CY. Colon cancer survival rates with the new American Joint Committee on Cancer sixth edition staging. J Natl Cancer Inst 2004;96:1420-25
- Lidgren M, Wilking N, Jonsson B, Rehnberg C. Resource use and costs associated with different states of breast cancer. Int J Technol Assess Health Care 2007;23:223-31
- Dekker JWT, Gooiker GA, van der Geest LGM, Kolfschoten NE, Struikmans H, Putter H, Wouters MWJM, Tollenaar RAEM. Use of different comorbidity scores for risk-adjustment in the evaluation of quality of colorectal cancer surgery: does it matter? Eur J Surg Oncol J Eur Soc Surg Oncol Br Assoc Surg Oncol 2012;38:1071-78
- Paravati AJ, Boero IJ, Triplett DP, Hwang L, Matsuno RK, Xu B, Mell LK, Murphy JD. Variation in the Cost of radiation therapy among medicare patients with cancer. J Oncol Pract 2015;11:403-9
- Warren JL, Yabroff KR, Meekins A, Topor M, Lamont EB, Brown ML. Evaluation of trends in the cost of initial cancer treatment. J Natl Cancer Inst 2008;100:888-97
- Draper NR. Generalized linear models for Insurance data by Piet de Jong, Gillian Z. Heller. Int Stat Rev 2008;76:315
- Salmon RB, Sanderson MI, Walters BA, Kennedy K, Flores RC, Muney AM. A collaborative accountable care model in three practices showed promising early results on costs and quality of care. Health Aff Proj Hope 2012;31:2379-87