
Abstract
Objective: To evaluate the cost-effectiveness of blinatumomab (Blincyto) vs standard of care (SOC) chemotherapy in adults with relapsed or refractory (R/R) Philadelphia-chromosome-negative (Ph−) B-precursor acute lymphoblastic leukemia (ALL) based on the results of the phase 3 TOWER study from a US healthcare payer perspective.
Methods: The Blincyto Global Economic Model (B-GEM), a partitioned survival model, was used to estimate the incremental cost-effectiveness ratio (ICER) of blinatumomab vs SOC. Response rates, event-free survival (EFS), overall survival (OS), numbers of cycles of blinatumomab and SOC, and transplant rates were estimated from TOWER. EFS and OS were estimated by fitting parametric survival distributions to failure-time data from TOWER. Utility values were based on EORTC-8D derived from EORTC QLQ-C30 assessments in TOWER. A 50-year lifetime horizon and US payer perspective were employed. Costs and outcomes were discounted at 3% per year.
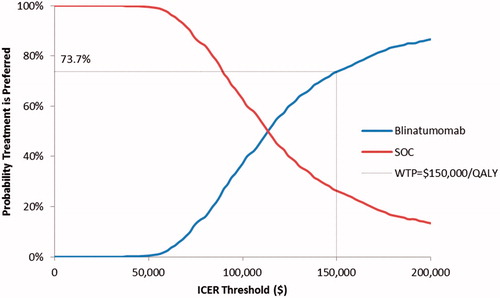
Results: The B-GEM projected blinatumomab to yield 1.92 additional life years and 1.64 additional quality-adjusted life years (QALYs) compared with SOC at an incremental cost of $180,642. The ICER for blinatumomab vs SOC was estimated to be $110,108/QALY gained in the base case. Cost-effectiveness was sensitive to the number and cost of inpatient days for administration of blinatumomab and SOC, and was more favorable in the sub-group of patients who had received no prior salvage therapy. At an ICER threshold of $150,000/QALY gained, the probability that blinatumomab is cost-effective was estimated to be 74%.
Limitations: The study does not explicitly consider the impact of adverse events of the treatment; no adjustments for long-term transplant rates were made.
Conclusions: Compared with SOC, blinatumomab is a cost-effective treatment option for adults with R/R Ph − B-precursor ALL from the US healthcare perspective at an ICER threshold of $150,000 per QALY gained. The value of blinatumomab is derived from its incremental survival and health-related quality-of-life (HRQoL) benefit over SOC.
Introduction
Philadelphia-chromosome-negative (Ph−) B-precursor (i.e, B-cell precursor) acute lymphoblastic leukemia (ALL) is an ultra-orphan disease affecting fewer than 10 per million working-age adults per year in the USCitation1–6. Patients with relapsed or refractory (R/R) Ph − B-precursor ALL face imminent risk of death, and, even with treatment, have a poor prognosisCitation7. Historically, median overall survival (OS) for patients with R/R ALL was 3.3 monthsCitation8. A relatively young population is affected by R/R Ph − B-precursor ALL, with 45–47% of patients younger than 35 years of ageCitation8. As a consequence, the typical patient dies at least 30 years prematurelyCitation9.
Treatment options for R/R Ph − B-precursor ALL are limited. Prior to results of the single-arm phase 2 study of blinatumomab (BLINCYTO®) in this particularly difficult-to-treat adult patient populationCitation10, the National Clinical Cancer Network guidelines recommended treatment of these patients with investigational products in clinical trials, or, in the absence of such trials, treatment with multi-drug salvage regimens or, if a donor was available, allogeneic hematopoietic stem cell transplantation (alloHSCT). Blinatumomab, now listed as a category 1 recommended therapyCitation11, is a major treatment advancement for this rare disease. Blinatumomab is a bi-specific CD19-directed CD3 T-cell engager approved in December 2014 by the Food and Drug Administration (FDA) for the treatment of R/R Ph − B-precursor ALL. Its approval was based on a single-arm, phase 2 studyCitation10 in adult patients with Ph − B-precursor ALL who were primary refractory, first relapse with first remission duration <12 months, relapsed within 12 months of alloHSCT, or were entering second or greater salvage. The efficacy benefit of blinatumomab was subsequently confirmed in the multi-center, phase 3 TOWER study of blinatumomab vs standard of care (SOC) chemotherapy in a similarly particularly difficult-to-treat patient population. TOWER, which was stopped early for efficacy, met its primary efficacy point for OS (hazard ratio [HR] for death = 0.71, 95% CI = 0.55–0.93; p = .012). Median OS was 7.7 months for blinatumomab and 4.0 months for SOCCitation12.
Early relapse is a negative prognostic factor for subsequent responses to salvage therapy and survival outcomesCitation13. However, among the sub-group of patients with no prior salvage chemotherapy with remission duration of <12 months, the treatment effect of blinatumomab was more pronounced, with HR (95% CI) for OS of 0.60 (0.35–0.91), and the median OS of 11.1 months for blinatumomab and 5.3 months for SOC. Hematological response rates were higher for blinatumomab vs SOC, including complete response (CR) (34% vs 16%; p < .001) and CR/CRh/CR with partial or incomplete hematologic recovery (CRi) (44% vs 25%, p = .001)Citation14.
Health-related quality-of-life (HRQoL) measures, as assessed using the European Organization for Research and Treatment of Cancer Quality of Life Questionnaire (EORTC QLQ-C30), were also better post-baseline for blinatumomab vs SOC; time-to deterioration in HRQoL measures was significantly delayedCitation15.
A cost-utility analysis is one of several meaningful approaches to quantifying the long-term value of healthcare interventions. In this type of analysis, the incremental cost-effectiveness ratio (ICER) is used to gauge the cost of a health intervention relative to its benefit, expressed as quality-adjusted life years (QALYs). In the US, an ICER of $50,000 per QALY has long been cited as a threshold for determining if a treatment is cost-effective. However, this value was established over 35 years ago and has not been adjusted for inflation, innovation, or increasing cost of research and developmentCitation16. More recently, ICER thresholds of $150,000 to as high as $300,000 per QALY have been suggested for oncology therapiesCitation17–21. In this study, the B-GEM was developed to evaluate the cost-effectiveness of blinatumomab compared with SOC using comparative data from the phase 3 randomized TOWER trial from the US healthcare payer perspective.
Methods
Model structure
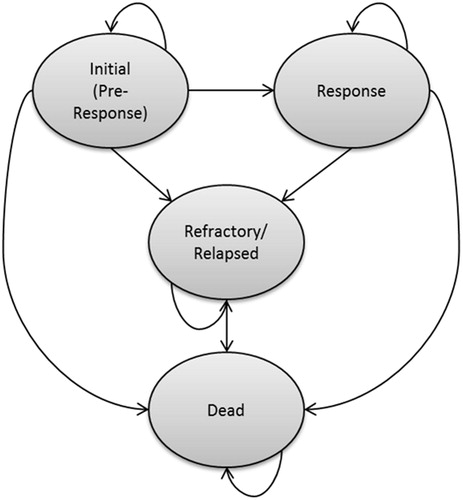
The economic evaluation uses the B-GEM, a partitioned survival model with states defined on the basis of response to treatment, relapse, and death. A schematic of the B-GEM, which was programmed in Microsoft Excel, is presented in . A weekly model cycle is used for estimating the proportion of patients in each health state over time. All patients enter the model in the “initial” state, and remain in this state for 12 weeks (unless they die during that period), after which they may enter either the “refractory/relapsed” state or “response” state, depending on response to therapy. The 12-week period was used because, in the TOWER study, responses were assessed at the end of cycle 2, which occurred 12 weeks after randomizationCitation12. Patients entering the response state are at risk of relapse or death. Those who respond initially then relapse enter the R/R state, and are at risk of death.
Figure 1. The B-GEM schematic.
Clinical effectiveness inputs to estimate health-state probabilities for blinatumomab and the SOC chemotherapy are based on data from the blinatumomab and SOC chemotherapy arms of TOWER. Drug acquisition and administration costs for patients receiving blinatumomab and SOC chemotherapy were modeled independently of response and were estimated by combining information on the percentage of patients initiating and completing each cycle of treatment in TOWER, with estimates of the costs per cycle. Costs of alloHSCT are modeled independently of response; these were calculated by combining estimates of the proportion of patients receiving a post-baseline alloHSCT in TOWER, with estimates of the expected costs of alloHSCT. Costs of subsequent salvage therapy are modeled as “one-off” costs at the time of entry into the refractory/relapsed state, based on information from TOWER. Terminal-care costs are modeled as one-off costs at the time of death.
Model estimation
Estimation of the B-GEM parameters is summarized in the sections below and in .
Table 1. Summary of model parameters.
Response, EFS, and OS
The probabilities of response for patients receiving blinatumomab and SOC were estimated based on the rates of CR/CRh/CRi at 12 weeks in the TOWER study (43.9% and 24.6%, respectively).
EFS among patients with response and OS to 23 months (the maximum duration of follow-up for EFS and OS in TOWER) were estimated by fitting parametric survival distributions to individual patient data from TOWER using Flexsurv, an R package for fully-parametric modeling of survival dataCitation22. A number of parametric distributions were fitted to EFS and OS data, including exponential, Weibull, log-logistic, lognormal, Gompertz, gamma, and restricted cubic spline (RCS) distributions. Parametric survival distributions were selected based on fit statistics, and visual inspection of survival distributions, hazard functions, time-dependent HRs, diagnostic plots for treatment effects, and clinical plausibility. For each outcome and distribution, survival models were estimated alternately by (a) including a single indicator variable for treatment group in the model formulation (restricted), and (b) including treatment-group interaction terms for every distributional parameter (unrestricted). With both approaches, the distributions of survival for blinatumomab and SOC were assumed to be of the same class (e.g. both are Weibull). However, with the first approach, the effect of treatment is restricted to a single distributional parameter (e.g. the scale parameter of the Weibull distribution) and yields projections of survival that are consistent with various treatment effect models such as proportional hazards, proportional odds, or accelerated failure time, depending on the distribution. The second approach places no such restrictions on the distributional parameters or the assumed nature of treatment effect within the class. Estimating the “restricted” and “unrestricted” models in this way permits comparison of fit statistics for the two approaches.
The Bayesian information criterion (BIC) statistic was used as the primary fit statistic, since it penalizes overly complex models and its use mitigates the risk of overfitting artefactual trends in the tails of the survival distributions. Diagnostic plots for treatment effects were produced using an extension of an approach proposed by Bagust and BealeCitation23. The estimated treatment effect for the chosen model was applied to failure times in the SOC arm to obtain a counterfactual survival distribution, and then the counterfactual SOC survival was compared with that of blinatumomab. Based on these methods, the restricted generalized gamma model was selected to model EFS among patients with response, and the restricted Gompertz model was selected to model OS ().
Figure 2. EFS among responders and OS in TOWER: Kaplan-Meier estimates and parametric survival distributions used in the B-GEM.
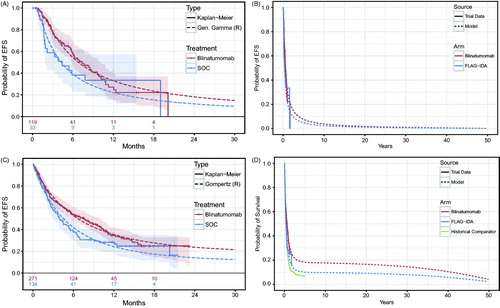
The plausibility of long-term projections of OS based on the Gompertz distribution was assessed using data from a historical comparator cohort (Study 20120310)Citation8. This historical comparator cohort represents the largest ever assembled cohort of R/R ALL patients, and had a longer follow-up of ∼5 years vs 23 months for TOWER. In order to obtain a comparable set of patients from Study 20120310, only patients treated in or after the year 2000 were included. Patients in the historical cohort were stratified by a combination of age (< 35 or ≥35 years) and prior lines of treatment (alloHSCT, in first salvage, in second or greater salvage), and weighted according to the distributions of these characteristics in the SOC chemotherapy arm of TOWER. The Gompertz curves from TOWER exhibit a nearly identical shape to the historical comparator cohort, with a clear pattern of rapidly decreasing hazards. The Gompertz model projects survival for the TOWER SOC chemotherapy arm ∼5% higher than that of the historical comparator cohort. This is likely a consequence of the improvement of survival outcomes for R/R ALL patients between 2000–2015 when TOWER was initiated, and because patients recruited in large randomized controlled trials tend to have a better prognosis than patients treated in typical clinical practice. The strong similarity of shape was confirmed by adjusting the historical comparator cohort survival curve by applying an HR of 0.85. This “adjusted” historical comparator curve had virtually an identical shape as the Gompertz curve for the SOC chemotherapy arm of TOWER, which further justifies the validity of using the Gompertz curve for predicting long-term OS in this patient population.
While the estimated restricted Gompertz model assumes a constant HR for blinatumomab vs SOC chemotherapy, it is not known how long the observed OS benefit of blinatumomab would last beyond the follow-up of TOWER. In the absence of evidence on the long-term survival benefit of blinatumomab, the hazard rate for the blinatumomab arm was assumed to be equal to that of the SOC chemotherapy arm beyond 4 years in the base case. That is, it was assumed that there would be no additional benefit of treatment on the hazards of death after this point. In order to model the effect of increasing age on mortality, age- and sex-matched US general population mortality rates were applied additively to the estimated Gompertz model.
Utility values
Utility values were estimated using an EORTC-8D preference-based measure derived from EORTC QLQ-C30 assessments during TOWER using methods described by Rowen et al.Citation24. Missing items on EORTC QLQ-C30 were imputed by carrying forward the item value from the prior assessment, or backward from the following assessment if the prior assessment was also missing. Assessments for which imputation was not feasible were dropped from the analysis. Utility values from TOWER were analyzed using Generalized Linear Model (GLM) regression, with utility value as the dependent variable and with covariates for treatment group (blinatumomab vs SOC), health state (baseline, pre-response assessment, in response, refractory or relapsed), interaction of treatment group and health state, and time from death (≥1 month, <1 month). An identity link and normal error term distribution were used to ensure consistency with the assumed additive effect of death on quality-of-life in the B-GEM (results were generally similar when different link functions and error term distributions were used). To account for correlation of utility values within patients, a generalized estimating equations (GEE) approach was used in calculation of standard errors (SEs). Mean (SE) utility values for each health state were calculated using the mean (SE) of predicted values, alternately setting the treatment group indicator covariate to blinatumomab or SOC.
Because of the short follow-up in the TOWER study relative to the modeling time horizon, extrapolation of utility values derived from TOWER over the entire model projection is associated with substantial uncertainty and is potentially biased. In particular, it is uncertain how long the differences in utility values by treatment group observed in TOWER would be maintained beyond the end of follow-up in the trial. Also, because patients surviving after a long time period have the potential to be cured (e.g. 48 months)Citation25–29, it would be reasonable to use general population norm utility values rather than disease-specific estimates. Furthermore, as patients grow older, HRQoL and utility values would be expected to decline. Accordingly, in the base-case, utility values for patients surviving more than 4 years were based on age- and sex-matched US general population norm valuesCitation30.
Costs
Blinatumomab and SOC chemotherapy
The dosing of blinatumomab was assumed to be the same as that employed in the TOWER study. In TOWER, blinatumomab was administered as a continuous intravenous (IV) infusion over 4 weeks, followed by a 2-week treatment-free period, for up to five consecutive cycles. In the TOWER study, a cycle was defined as 6 weeks in duration (4 weeks of continuous IV infusion of blinatumomab, followed by a 2-week treatment-free interval). In cycle 1, the dose was 9 μg/day for the first 7 days, followed by 28 μg/day for the remaining 3 weeks of the treatment period. In subsequent cycles, the dose of blinatumomab was 28 μg/day for all 4 weeks of the treatment period. Patients who achieved CR/CRh/CRi during the first two cycles could receive up to three additional cycles of blinatumomab as consolidation, and those completing five cycles could continue to receive up to 12 additional months as maintenance therapy (i.e. up to four cycles; each cycle was 12 weeks in duration: 4 weeks of blinatumomab followed by an 8-week treatment-free interval).
It was assumed that patients would follow recommendations to receive blinatumomab on an inpatient basis for 9 days during the first induction cycle and the first 2 days of the second cycle, consistent with the US prescribing information for BLINCYTO. Patients receiving outpatient treatment with blinatumomab were assumed to require daily home infusion therapy and an outpatient nurse visit every other day to refill the pump. The percentage of patients starting and completing each cycle was obtained from TOWER. To be consistent with the data on clinical outcomes, data for the intent to treat (ITT) population were used, in which 99% and 81% of blinatumomab and SOC patients, respectively, initiated study therapy. The most common reason for randomization without treatment was subject request. In calculating costs of medication, home infusion therapy, and outpatient visits, patients who discontinue within a cycle were assumed to receive one half of that cycle. The cost of blinatumomab medication was estimated to be $3,464.34 per 35 μg vial, based on the wholesale acquisition cost (WAC) price of Blincyto, as reported in the Truven Health Analytics RED BOOKCitation31. Each 35 μg vial contains 28 μg of useable medication. It was assumed that four vials would be used for the first 7 days of treatment (one vial on days 1, 3, 5, and 7), and that a single vial would be required for all subsequent days of treatment. The daily cost of hospitalization for administration of blinatumomab was calculated based on the average cost and mean length of stay for a hospitalization chemotherapy encounter reported in a retrospective study of the economic burden of hospitalization in patients with relapsed ALL by Barlev et al.Citation32. The per diem cost of home infusion therapy was estimated to be $67, based on a publically available per diem Medicare fee for home infusion therapy (HCPCS S9330)Citation33. The cost of a visit for pump refill was estimated to be $139, based on the published Medicare non-facility price for refill and maintenance of a portable infusion pump (HCPCS 96521)Citation34.
The cost per course of SOC chemotherapy was calculated by combining estimates of the percentage of patients starting and completing each treatment cycle from TOWER, with estimates of the average cost of a hospitalization for a chemotherapy encounter in patients with ALL as reported by Barlev et al.Citation32 ($58,565).
Allogenic stem-cell transplant
The probabilities of alloHSCT for patients receiving blinatumomab or SOC chemotherapy were estimated based on the treatment-group specific proportion of patients receiving such treatment in TOWER. The cost of alloHSCT was estimated based on an unpublished analysis from the study of health insurance claims data by Barlev et al.Citation32.
Subsequent salvage therapy
The probabilities of receipt of salvage treatment with chemotherapy (FLAG-IDA, hyper-CVAD, clofarabine-based regimens) or innovative anti-cancer therapies (blinatumomab, inotuzumab, and CAR-T cells) after patients stopped receiving investigational therapy in TOWER were estimated based on the treatment-group specific proportions of patients receiving such post-study treatments in TOWER. The costs per course of subsequent salvage treatment with chemotherapy and innovative anti-cancer therapies were assumed to be the same as the costs of initial salvage treatment with SOC chemotherapy and blinatumomab, respectively.
Analyses
Base case analyses, scenario analyses, deterministic sensitivity analyses (DSAs), and probabilistic sensitivity analyses (PSAs) were conducted. For each comparator, base-case results included expected lifetime costs, as well as life expectancy and QALYs. Costs, life years, and QALYs were discounted at 3% annually and reported by health stateCitation35. Net monetary benefit (NMB) was calculated for pre-specified threshold values for cost effectiveness (“willingness to pay for a QALY”) of $150,000, and $200,000 per QALY gainedCitation36. Scenario analyses and DSAs were conducted to assess the robustness of findings with respect to changes in key parameter estimates and assumptions. DSAs were reported as a tornado diagram. PSAs, based on 10,000 simulations, were conducted to account for uncertainty surrounding key B-GEM parameters. In PSAs, the response rates and parameters of the survival distributions were sampled from a joint bootstrap or “empirical” distribution, consisting of 1,000 sets of bootstrap statistics derived from 1,000 bootstrap samples of the TOWER data set. Each bootstrap sample was a random sample taken with replacement from each arm of the TOWER trial data set. For each bootstrap sample, we calculated bootstrap statistics for the response rates and the parameters of the survival distributions. We repeated this procedure 1,000 times to derive a joint bootstrap distribution for these bootstrap statistics. The model then samples from this joint bootstrap distribution in the PSA. This process is employed to ensure the correlation of these parameter estimates across the Monte Carlo simulations of the PSA. Results of the PSA were used to generate acceptability curves for blinatumomab and SOC chemotherapy, showing the probability that each treatment would be preferred given a range of values for the willingness-to-pay for a QALY.
Results
Base case
In the base case, blinatumomab was estimated to yield 1.92 more life-years (discounted) than SOC (). Discounted QALYs were estimated to be 1.64 greater with blinatumomab vs SOC. Total costs were estimated to be $180,642 greater with blinatumomab than with SOC, largely reflecting the expected greater treatment-related costs of blinatumomab therapy vs SOC chemotherapy ($395,094 vs $214,452, respectively), partially offset by lower costs of subsequent salvage treatment. The ICER for blinatumomab vs SOC was estimated to be $110,108 per QALY gained. At ICER thresholds of $150,000 and $200,000 per QALY gained, the NMB for blinatumomab vs SOC was estimated to be $65,446, and $147,476, respectively. A breakdown of the factors contributing to the NMB of blinatumomab using an ICER threshold of $150,000 per QALY is illustrated using a waterfall diagram in .
Figure 3. NMB of blinatumomab vs SOC based on ICER threshold of $150,000 per QALY gained. QALY, quality adjusted life year; R/R, relapsed/refractory; Allo-SCT, allogeneic hematopoietic stem cell transplantation; Subs., Subsequent, Tx, treatment; NMB, net monetary benefit. *Includes costs of drug acquisition and administration, including hospitalization, outpatient visits, and home infusion therapy.
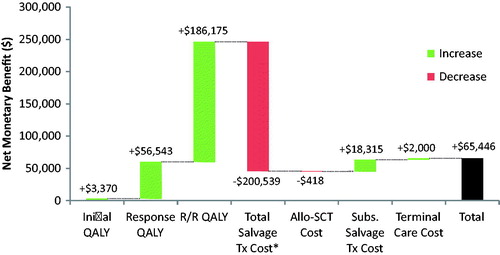
Table 2. Base case results.
Sub-group and scenario analyses
Several sub-group and scenario analyses were conducted (). First, a sub-group analysis was conducted in which parameter estimates derived from TOWER (response rates, EFS among responders, OS, treatment exposure, rates of alloHSCT, utilization of subsequent salvage therapy, and utility values) were based on data for the sub-group of patients who had received no prior salvage therapy. Compared with the base case, the ICER for blinatumomab vs SOC was estimated to be relatively more favorable in this sub-group ($98,378 per QALY gained).
Table 3. Results of sub-group and scenario analyses.
Data from the full analysis set of TOWER was used in the base-case analysis. To investigate the impact of the imbalance across study arms in drop-outs following randomization, a sub-group analysis was conducted in which B-GEM inputs were estimated using data from the safety analysis set of TOWER. Results for this analysis were modestly more favorable than for the base-case analysis ($105,736 per QALY gained).
In the base-case analysis, it is assumed that the HR for OS for blinatumomab vs SOC is 1.00 after 48 months. To investigate the impact of different assumptions regarding the duration of benefit on OS with blinatumomab, the B-GEM was run assuming the duration of benefit with blinatumomab on OS would be 36 and 60 months, respectively. Results were slightly less favorable when a 36-month duration of benefit was assumed ($114,575 per QALY) and slightly more favorable when a 60-month duration of benefit was assumed ($108,514 per QALY).
The B-GEM uses a 50-year time horizon in the base case. To investigate the impact of different modeling time horizons on the results of the analysis, results were generated for modeling time horizons of 30 and 60 years. Results were not materially different from the base case using a 60-year time horizon. However, results were less favorable using the 30-year modeling time horizon. These results should be interpreted cautiously, as they are likely biased against blinatumomab given the relatively high upfront costs and potential for long-term benefits.
In TOWER, patients could receive up to 12 months of maintenance therapy. However, the US prescribing information for blinatumomab does not include maintenance treatment. To investigate the impact of assuming no blinatumomab maintenance, a scenario analysis was run setting the drug acquisition and administration costs for blinatumomab after cycle 5 to zero. The ICER for blinatumomab vs SOC chemotherapy was more favorable ($98,917 per QALY gained) when maintenance therapy costs were set to zero. This scenario, should be interpreted cautiously as it does not adjust for the potential beneficial effects of maintenance therapy, and may be biased in favor of blinatumomab.
In TOWER, the rates of post-baseline alloHSCT were similar across study arms, with 24.0% of patients in the blinatumomab arm and 23.9% of patients in the SOC chemotherapy arm receiving transplant. These similar rates, which may seem counterintuitive, are likely due to clinicians adopting a different approach to the management of patients, dependent on study arm. This difference in management is observable in the median time to alloHSCT transplant, which was 3.6 months in the SOC arm compared with 11.3 months in the blinatumomab arm. To investigate the possible impact of differential rates of alloHSCT on model results, results were generated using rates of alloHSCT observed in Study MT103-21110 and the matched historical control cohort from Study 201203108 (25% for blinatumomab; 18% for SOC). Compared with the base case, results for this analysis were less favorable for blinatumomab vs SOC ($124,792 per QALY gained).
In the base case, the daily cost of hospitalization for blinatumomab and total cost per cycle of SOC were based on the mean cost of a hospitalization for chemotherapy from the analysis by Barlev et al.Citation32 ($58,565 per 10.8-day stay). This result may under-estimate hospitalization costs, due to the potential misclassification of diagnosis codes for hospitalization causes in claims databases. We, therefore, conducted a scenario analysis using the cost for all hospitalizations for ALL from this paper ($132,137 per 19.6-day stay)Citation32. The ICER for blinatumomab was $66,860 using this estimate.
In TOWER, EORTC-8D utility values were higher for patients receiving blinatumomab than among those receiving SOC, even after controlling for disease state. Nevertheless, to assess the sensitivity of model results to assumed differential utility values, a scenario analysis was run in which the utility values for the relapsed/refractory state were assumed to be the same for blinatumomab and SOC. This reduced the discounted QALYs gained for blinatumomab to 3.78, and increased the ICER to $112,853. Another scenario analysis was performed in which the general population utilities values for patients who remain alive after 60 months were reduced to reflect the potential long-term decrement in quality-of-life resulting from receipt of cytotoxic chemotherapy and allogenic SCT. In the absence of published estimates of the long-term decrement in utility values among ALL patients, the utility values were reduced by 0.285, which is half the difference between the estimated utility value for patients in response in the blinatumomab arm (0.814) and the general population norm utility value for persons of 40–49 years of age (0.871). This scenario resulted in an ICER of $113,174.
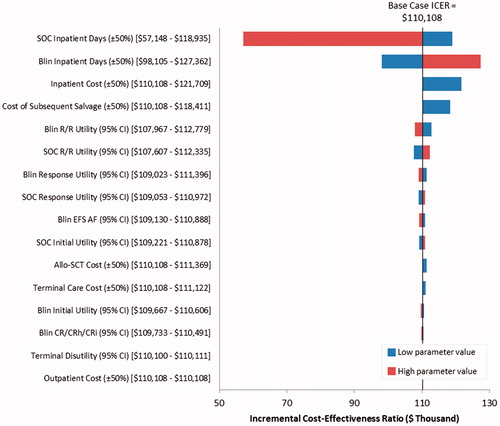
In deterministic sensitivity analyses, the ICER was most sensitive to the number and cost of inpatient days for administration of blinatumomab and SOC (). Varying the cost of subsequent salvage therapy and utility values also affected the ICER.
Figure 4. Tornado diagram showing results of deterministic sensitivity analyses on the cost-effectiveness of blinatumomab vs SOC. SOC, standard of care; Blin, blinatumomab; R/R, relapsed or refractory; EFS, event-free survival; Allo-SCT, allogeneic stem cell transplant; CR, complete response; CRh, complete response with partial hematologic recovery; CRi, complete response with partial or incomplete hematologic recovery.
In probabilistic sensitivity analyses, the probability that blinatumomab would yield more QALYs than SOC was estimated to be 99.1%. Blinatumomab had higher costs than SOC in 100% of the simulations. The probability that blinatumomab is cost-effective vs SOC was estimated to be 73.7% for an ICER threshold of $150,000 per QALY and 86.6% for an ICER threshold of $200,000 per QALY ().
Figure 5. Cost-effectiveness acceptability curves for blinatumomab and SOC.
Discussion
In the large, randomized phase 3 TOWER study of patients with R/R Ph − B-precursor ALL, significantly longer OS was demonstrated for the blinatumomab group relative to patients receiving SOC chemotherapy Remission also rates were significantly improved, as was the duration of remissionCitation12. Blinatumomab improved EFS compared with SOC, and demonstrated HRQoL benefits by delaying an EFS event or HRQoL deterioration across most measures relevant to oncology patientsCitation12,Citation15. The significant clinical benefits seen with blinatumomab in TOWER likely will establish it as the new standard of care for R/R Ph − B-precursor ALL. In order to demonstrate its economic value, the cost-effectiveness of blinatumomab was assessed in this patient population using TOWER data.
In this cost-effectiveness analysis, nearly two life-years (undiscounted) were projected to be gained with blinatumomab vs SOC (4.69 vs 2.78, respectively), which underscores the potentially revolutionary benefit blinatumomab provides patients who develop this particularly difficult-to-treat form of leukemia. In the base-case analysis, the incremental cost was $180,642, and the ICER per life-year gained was $94,251. After accounting for the impact of ALL and treatment on HRQoL, the ICER per QALY gained was found to be $110,108, which falls below the range of ICER thresholds that have been suggested for oncology therapies in the US ($150,000–$300,000 per QALY)Citation20,Citation37. Even using the conservative ICER threshold of $150,000 per QALY, the probability that blinatumomab is cost-effective vs SOC was estimated to be 73.7%. The results of this analysis suggest that blinatumomab is an efficient use of US healthcare spending. Access to innovative therapies such as blinatumomab provides patients with meaningful new therapeutic options that extend survival.
In the sub-group analyses, patients who had received no prior salvage therapy were found to have a more favorable ICER compared with the base case; the ICER for blinatumomab vs SOC was estimated to $98,378 per QALY gained. This sub-group analysis is pertinent to the decision problem, as clinicians are likely to use blinatumomab early in the treatment pathway (i.e. in patients who have not received prior salvage therapy) given that treating patients earlier in the treatment pathway (i.e. patients with a better prognosis) with a more effective therapy is likely to lead to improvements in both absolute and relative OS.
Data from the full analysis set of TOWER was used in the base-case analysis. To investigate the impact of the imbalance across study arms in drop-outs following randomization, a sub-group analysis was conducted in which B-GEM inputs were estimated using data from the safety analysis set of TOWER. Results for this analysis were modestly more favorable than for the base-case analysis ($105,736 per QALY gained).
In the base-case analysis, it is assumed that the HR for OS for blinatumomab vs SOC is 1.00 after 48 months. To investigate the impact of different assumptions regarding the duration of benefit on OS with blinatumomab, the B-GEM was run assuming the duration of benefit with blinatumomab on OS would be 36 and 60 months, respectively. Results were slightly less favorable assuming a 36-month duration of benefit ($114,575 per QALY) and slightly more favorable assuming a 60-month duration of benefit ($108,514 per QALY).
Limitations
Despite the quality of the TOWER data, this analysis has several limitations. First, long-term projections of OS for blinatumomab and SOC are subject to considerable uncertainty, due to the limited follow-up of the TOWER study; long-term follow-up was discontinued prematurely when the trial ended early for efficacy. Second, the model assumes that HRQoL for patients beyond 4 years is equal to that of the age-matched general population. This does not account for potential long-term effects of ALL, salvage therapies, or alloHSCT on HRQoL. Third, while the model includes the cost of alloHSCT, only the alloHSCT utilization that was observed during the follow-up of TOWER was modeled. While rates of alloHSCT were nearly identical between the two groups, median time to alloHSCT was greater among blinatumomab patients who achieved CR/CRh/CRi. It is, therefore, possible that rates of alloHSCT are higher among blinatumomab patients, but that the follow-up of TOWER was not sufficient to capture the full extent of alloHSCT use in the blinatumomab group. Upon examination of a scenario with higher alloHSCT in the blinatumomab arm, results were less favorable but still under the ICER threshold of $150,000 per QALY gained. Fourth, the TOWER trial allowed patients to receive maintenance therapy with blinatumomab. Such treatment is not included in the FDA-approved prescribing information for blinatumomab. Fifth, adverse events were not modeled explicitly in B-GEM. Considering that most of the adverse events were managed in the inpatient setting, their associated costs were likely captured in the hospitalization costs. In TOWER, patients in the SOC arm vs blinatumomab arm were more likely to have any adverse events of grade ≥3 (91.7% vs 86.5%), and more likely to have high economic burden adverse events such as neutropenia (57.8% vs 37.8%) and infection (52.3% vs 34.1%)Citation12. Therefore, by not considering adverse events, B-GEM likely over-estimated the incremental cost-effectiveness ratio of blinatumomab vs SOC in the US. Finally, this analysis is based on a partitioned survival model. While such models are useful since they faithfully represent the outcomes observed in the source data, they are limited in that they do not easily permit examination of the potential impact on OS of changes in estimates and assumptions regarding intermediate outcomes such as response.
Conclusions
The TOWER trial demonstrated improved survival and HRQoL in patients treated with blinatumomab vs SOC. Results from this analysis using the B-GEM show that, at a willingness-to-pay threshold of $150,000 per QALY gained, blinatumomab is a cost-effective option relative to SOC in this particularly difficult-to-treat patient population. In light of these findings, and considering the rarity of R/R Ph − B-precursor ALL, its dire prognosis, and the fact that there has not been an innovative therapy for this disease for several decades, blinatumomab should be made available as a treatment option for patients with R/R Ph − B-precursor ALL in the US.
Transparency
Declaration of funding
This work was supported by Amgen, Inc., Thousand Oaks, CA.
Declaration of financial/other relationships
AS has served as an advisory board member and consultant for Amgen, and has received research grants from Amgen. ZFZ, JLF, ZC, and GH are employed by and own stock in Amgen Inc. TED is an owner of and JA, DB, and MH are employees of Policy Analysis Inc. (PAI), which received from funding for this analysis from Amgen. Peer reviewers on this manuscript have received an honorarium from JME for their review work, but have no other relevant financial relationships to disclose.
Acknowledgments
The authors would like to thank Julie Gegner, PhD, employee of Amgen, for writing and editorial support.
Related Research Data
References
- Moorman AV, Chilton L, Wilkinson J, et al. A population-based cytogenetic study of adults with acute lymphoblastic leukemia. Blood 2010;115:206-14
- Fielding AK, Richards SM, Chopra R, et al. Outcome of 609 adults after relapse of acute lymphoblastic leukemia (ALL); an MRC UKALL12/ECOG 2993 study. Blood 2007;109:944-50
- Kantarjian H, Thomas D, O’Brien S, et al. Long-term follow-up results of hyperfractionated cyclophosphamide, vincristine, doxorubicin, and dexamethasone (Hyper-CVAD), a dose-intensive regimen, in adult acute lymphocytic leukemia. Cancer 2004;101:2788-801
- Oriol A, Vives S, Hernandez-Rivas JM, et al. Outcome after relapse of acute lymphoblastic leukemia in adult patients included in four consecutive risk-adapted trials by the PETHEMA Study Group. Haematologica 2010;95:589-96
- Rowe JM, Buck G, Burnett AK, et al. Induction therapy for adults with acute lymphoblastic leukemia: results of more than 1500 patients from the international ALL trial: MRC UKALL XII/ECOG E2993. Blood 2005;106:3760-7
- Tabor EE, Waddell JA, Solimando DA Jr. Blinatumomab and pembrolizumab. Hosp Pharm 2015;50:269-73
- Geyer MB, Hsu M, Devlin SM, et al. Overall survival among older U.S. adults with ALL remains low despite modest improvement since 1980: SEER analysis. Blood 2017;129:1878-81
- Gokbuget N, Kelsh M, Chia V, et al. Blinatumomab vs historical standard therapy of adult relapsed/refractory acute lymphoblastic leukemia. Blood Cancer J 2016;6:e473
- Katz AJ, Chia VM, Schoonen WM, et al. Acute lymphoblastic leukemia: an assessment of international incidence, survival, and disease burden. Cancer Causes Control 2015;26:1627-42
- Topp MS, Gökbuget N, Stein AS, et al. Safety and activity of blinatumomab for adult patients with relapsed or refractory B-precursor acute lymphoblastic leukaemia: a multicentre, single-arm, phase 2 study. Lancet Oncol 2015;16:57-66
- NCCN. Clinical practice guidelines in oncology for acute lymphoblastic leukemia, Version 1.2017. http://www.nccn.org/professionals/physician_gls/pdf/all.pdf. Accessed June 28, 2017
- Kantarjian H, Stein A, Gokbuget N, et al. Blinatumomab versus chemotherapy for advanced acute lymphoblastic leukemia. N Engl J Med 2017;376:836-47
- Gokbuget N, Dombret H, Ribera JM, et al. International reference analysis of outcomes in adults with B-precursor Ph-negative relapsed/refractory acute lymphoblastic leukemia. Haematologica 2016;101:1524-33
- Dombret H, Topp MS, Schuh A, Wei A, Martinelli G, Durrant S, Larry Bacon C, Nie K, Zimmerman Z, Kantarjian H. Blinatumomab vs SOC chemotherapy in first salvage compared with second or greater salvage in a phase 3 study. EHA Learning Center. Jun 24, 2017. Abstract S478
- Topp M, Zimmerman Z, Cannell P, et al. Health-related quality of life (HRQoL) of blinatumomab versus standard of care (SOC) chemotherapy in patients with relapsed or refractory Philadelphia negative B-cell precursor acute lymphoblastic leukemia in a randomized, open-label phase 3 study (TOWER). Oral presentation at ASH 58th Annual Meeting & Exposition. San Diego, CA. December 3, 2016
- Nanavaty M, Kaura S, Mwamburi M, et al. The use of incremental cost-effectiveness ratio thresholds in health technology assessment decisions. J Clin Pathways 2015;1:29-36
- Aldy J, Viscusi W. Adjusting the value of a statistical life for age and cohort effects. Rev Econ Stat 2008;90:573-81
- Nadler E, Eckert B, Neumann PJ. Do oncologists believe new cancer drugs offer good value? Oncologist 2006;11:90-5
- Ubel PA, Berry SR, Nadler E, et al. In a survey, marked inconsistency in how oncologists judged value of high-cost cancer drugs in relation to gains in survival. Health Aff (Millwood) 2012;31:709-17
- Jakubowiak AJ, Campioni M, Benedict A, et al. Cost-effectiveness of adding carfilzomib to lenalidomide and dexamethasone in relapsed multiple myeloma from a US perspective. J Med Econ 2016;19:1061-74
- Stopeck A, Rader M, Henry D, et al. Cost-effectiveness of denosumab vs zoledronic acid for prevention of skeletal-related events in patients with solid tumors and bone metastases in the United States. J Med Econ 2012;15:712-23
- Jackson C. Package ‘flexsurv’. Flexible parametric survival and multi-state models. 2016. https://cran.r-project.org/web/packages/flexsurv/flexsurv.pdf. Accessed January 30, 2016
- Bagust A, Beale S. Survival analysis and extrapolation modeling of time-to-event clinical trial data for economic evaluation: an alternative approach. Med Decis Making 2014;34:343-51
- Rowen D, Brazier J, Young T, et al. Deriving a preference-based measure for cancer using the EORTC QLQ-C30. Value Health 2011;14:721-31
- Mehta J, Powles R, Singhal S, et al. Autologous bone marrow transplantation for acute myeloid leukemia in first remission: identification of modifiable prognostic factors. Bone Marrow Transplant 1995;16:499-506
- Mehta J, Powles R, Treleaven J, et al. Long-term follow-up of patients undergoing allogeneic bone marrow transplantation for acute myeloid leukemia in first complete remission after cyclophosphamide-total body irradiation and cyclosporine. Bone Marrow Transplant 1996;18:741-6
- Powles R, Mehta J, Singhal S, et al. Autologous bone marrow or peripheral blood stem cell transplantation followed by maintenance chemotherapy for adult acute lymphoblastic leukemia in first remission: 50 cases from a single center. Bone Marrow Transplant 1995;16:241-7
- Singhal S, Powles R, Treleaven J, et al. Long-term outcome of adult acute leukemia patients who are alive and well two years after allogeneic bone marrow transplantation from an HLA-identical sibling. Leuk Lymphoma 1999;34:287-94
- Singhal S, Powles R, Treleaven J, et al. Long-term outcome of adult acute leukemia patients who are alive and well 2 years after autologous blood or marrow transplantation. Bone Marrow Transplant 1999;23:875-9
- Sullivan PW, Ghushchyan V. Preference-based EQ-5D index scores for chronic conditions in the United States. Med Decis Making 2006;26:410-20.
- Truven Heath Analytics. Red Book. 2016. http://micromedex.com/products/product-suites/clinical-knowledge/redbook. Accessed September 26, 2016
- Barlev A, Lin VW, Song X. Burden of hospitalization in relapsed acute lymphoblastic leukemia. Curr Med Res Opin 2016;32:1209-12
- Blue Cross and Blue Shield of Michigan. Medicare advantage PPO enhanced benefits. Fee schedule. Revised July 1, 2016. https://www.bcbsm.com/content/dam/public/Providers/Documents/help/medicare-advantage-fee-schedule.pdf. Accessed September 26, 2016
- Center for Medicare and Medicaid Services. 2016. Physician fee schedule search. https://www.cms.gov/apps/physician-fee-schedule/search/search-criteria.aspx. Accessed September 26, 2016
- Sanders GD, Neumann PJ, Basu A, et al. Recommendations for conduct, methodological practices, and reporting of cost-effectiveness analyses: Second panel on cost-Effectiveness in health and medicine. JAMA 2016;316:1093-103
- Laska EM, Meisner M, Siegel C, et al. Ratio-based and net benefit-based approaches to health care resource allocation: proofs of optimality and equivalence. Health Econ 1999;8:171-4
- Hillner BE, Schrag D, Sargent DJ, et al. Cost-effectiveness projections of oxaliplatin and infusional fluorouracil versus irinotecan and bolus fluorouracil in first-line therapy for metastatic colorectal carcinoma. Cancer 2005;104:1871-84
- Chastek B, Harley C, Kallich J, et al. Health care costs for patients with cancer at the end of life. J Oncol Pract 2012;8:75s-80s