
Abstract
Aims: Methods for integrating external costs into clinical databases are not well-characterized. The purpose of this research was to describe and implement methods for estimating the cost of hospitalizations, prescriptions, and general practitioner and specialist visits used to manage hyperlipidemia patients experiencing cardiovascular (CV) events in the United Kingdom (UK).
Methods: This study was a retrospective cohort study using the Clinical Practice Research Datalink and Hospital Episode Statistics data. Costs were incorporated based on reference costs from the National Health Service, and labor costs from the Personal Social Services Research Unit. The study population included patients seen by general practitioners in the UK from 2006–2012. Patients ≥18 years were selected at the time of their first CV-related hospitalization defined as myocardial infarction, ischemic stroke, heart failure, transient ischemic attack, unstable angina, or revascularization. To be included, patients must have received ≥2 lipid-lowering therapies. Outcome measures included healthcare utilization and direct medical costs for hospitalizations, medications, general practitioner visits, and specialist visits during the 6-month acute period, starting with the CV hospitalization, and during the subsequent 30-month long-term period.
Results: There were 24,093 patients with a CV hospitalization included in the cohort. This study identified and costed 69,240 hospitalizations, 673,069 GP visits, 32,942 specialist visits, and 2,572,792 prescriptions, representing 855 unique drug and dose combinations. The mean acute period and mean annualized long-term period costs (2014£) were £4,060 and £1,433 for hospitalizations, £377 and £518 for GP visits, £59 and £103 for specialist visits, and £98 and £209 for medications.
Conclusions: Hospital costs represent the largest portion of acute and long-term costs in this population. Detailed costing using utilization data is feasible and representative of UK clinical practice, but is labor intensive. The availability of a standardized coding system in the UK drug costing data would greatly facilitate drug costing.
Introduction
Most new interventions are subject to review by reimbursement authorities, who are tasked with defining the trade-off between their costs and benefits. This review process is most valuable when it incorporates real-world patterns of care and costs. In many countries, providers are not reimbursed for each discrete service; therefore, identifying costs can be challenging because economic information is separated from clinical data. To solve this problem, external costs must be combined with utilization data in a framework designed to integrate information from different sources; historically, this required health economic models which often included data from a variety of sourcesCitation1,Citation2. More recently, however, there has been an increasing focus on using “real-world”, country-specific data in making policy decisionsCitation3,Citation4.
With the release of the Clinical Practice Research Datalink (CPRD) in 2012, a more complete picture of clinical practice in the UK is now available for research. The linkage includes data from general practice, hospital inpatient and outpatient records from the Hospital Episode Statistics (HES), and mortality data from the Office of National Statistics, as well as linkages to other data sources. Fortunately, the UK Department of health conducts annual costing studies to facilitate the application of reference costs to resources used in medical practice by the National Health Service (NHS)Citation5. In addition, the Personal Social Services Research Unit (PSSRU) at the University of Kent, University of Manchester, and the London School of Economics and Political Science provides additional detail about social care staff costsCitation6.
As a result of these resources, a variety of studies have been conducted that estimate costs based on resource utilization derived from CPRD and HES data, many of which were published recentlyCitation7–18. However, it is still challenging to understand the methods used, and to implement them in researchCitation19. Because this is a new and evolving area, the primary aim of this study was to describe our methods for incorporating costs into CPRD and HES data, including characterizing important challenges in the implementation. Furthermore, since coronary heart disease is a leading cause of death worldwide, and is the leading cause of death in the UKCitation20, our secondary aim was to illustrate the methods by estimating total acute and long-term costs for hospitalizations, prescriptions, general practitioner (GP) visits, and outpatient specialist visits (as recorded in the GP data) in a population of patients who have experienced their first cardiovascular event.
Methods
Study overview
This study is focused on the methods of incorporating costs into CPRD and HES data. The context in which the methods are described involves the estimation of total direct medical costs in patients who had their first CV event and who were receiving lipid-lowering therapy prior to the event (). Information about the cohort was published previously in a study of incremental costs of CV eventsCitation21.
Figure 1. Overview of the costing process.
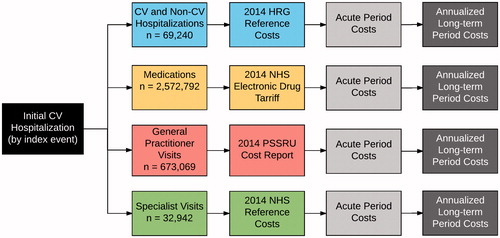
The study design was a retrospective cohort study using primary care data from CPRD. CPRD is a widely used data source based on the GP electronic health record, and includes diagnoses, tests, observations, medical history, test results, referrals, and prescriptionsCitation22,Citation23. Patients are included from each participating practice, and these patients (6.9% of the UK population) have been found to be comparable to the UK general population in terms of age, sex, and ethnicity. One of the CPRD linkages is with the Hospital Episode Statistics (HES) inpatient data, which was used to identify CV events requiring inpatient hospitalization. This study used the full HES data, which includes all clinical and procedure data, as well as maternity, critical, and augmented care data.
Patient populations
The study population included adult patients (≥18 years) in CPRD who were linked to HES data as of January 1, 2005, and who had their first CV hospitalization between January 2006 and March 31, 2012 (end of HES observation period). Patients were selected at the time of their first CV hospitalization in the HES data, and only patients who had a CV hospitalization in the HES data were included. Patients were required to have at least 1 year of data prior to the CV hospitalization to minimize the inclusion of recurrent events. Similarly, we ensured that patients had hypercholesterolemia prior to their first CV hospitalization by requiring them to have received at least two prescriptions for any lipid-lowering therapy in the 180 days prior to the hospitalization, based on their GP records in CPRD.
Hospitalizations
CV hospitalizations were identified using the primary diagnosis code, which were recorded using International Classification of Diseases, Tenth Revision (ICD-10) codes (see Supplementary Materials). Hospitalizations included myocardial infarction (MI), ischemic stroke (IS), heart failure (HF), transient ischemic attack (TIA), or unstable angina (UA). Also included were hospitalizations with other primary diagnosis codes if they also included coronary artery bypass graft, percutaneous transluminal coronary angioplasty (PTCA), or percutaneous coronary intervention (PCI) based on Office of Population, Censuses, and Surveys (OPCS) codes (see Supplementary Materials). To minimize inclusion of individuals with previous CV hospitalizations not recorded in HES, we excluded patients with a history of an acute MI or IS in their medical history using the CPRD data. Conditions in CPRD were identified using Read codes based on code lists from the Quality Outcomes Framework (QOF)Citation24.
All HES data were processed for all patients, regardless of whether they were ultimately included in the study, to ensure that the process did not need to be repeated. Hospitalizations (“spells”) were comprised of one or more linked episodes of careCitation25, and were assigned an HRG code using the 2013/2014 Healthcare Resource Groups (HRG) Reference Costs Grouper softwareCitation26. In order to assign the HRG code, information from the HES files was extracted and re-organized to correspond to the inputs required for the HRG grouper. The HES episodes, hospitalizations, patient, episode diagnoses, episode procedures, maternity, and critical care files were read into the statistical software. All diagnoses and procedures for each episode were combined to be on a single record in our input episode file. Age at admission and gender from the CPRD data were also incorporated into the input episode file. Data from the HES hospitalizations file regarding admission and discharge information for each hospitalization (spell) were incorporated into an input hospital file. Input files for maternity and critical care were created from the corresponding HES files, and included information about the level of neonatal care and about critical care dates and duration. The newly-created input files were merged together and reorganized to create a single input file that could be read by HRG grouper software. Records rejected by the grouper software due to invalid ICD-10 codes were updated and the grouping software was re-run until as many of the records as possible could be grouped.
After passing the input file to the grouper and completing the grouping process, the resulting output files were read back into the statistical software. The output file contained a record for each hospitalization including the HRG code, length of stay, and a trimpoint for determining long vs short stays for each spell. We used the 2013–2014 Reference Costs for each HRG to apply the correct costCitation27. Since these costs are provided for elective inpatient, non-elective inpatient long stay, non-elective inpatient short stay, and day case, additional processing was required. We used the admission method from the HES hospitalizations file to identify day cases, and the patient classification from the HES episodes file to identify elective inpatient stays. The hospitalizations file admission method, HRG grouper length of stay, and HRG grouper trimpoint information were all used to determine non-elective inpatient short and long stays.
Prescription data
Anti-hypertensive, anti-thrombotic, anti-diabetic, anti-hyperlipidemic medications were included in the analyses. Categories were derived from British National Formulary (BNF) chaptersCitation28. Anti-hypertensive medications included the following seven BNF chapters: Beta-adrenoceptor Blocking Drugs, Vasodilator Antihypertensive Drugs, Centrally Acting Anti-hypertensive Drugs, Adrenergic Neurone Blocking Drugs, Alpha-adrenoceptor Blocking Drugs, Drugs Affecting the Renin-angiotensin System, and Calcium-channel Blockers. Anti-thrombotic medications included two BNF chapters: Anti-platelet Drugs and Oral Anti-coagulants. Anti-diabetic medications included two BNF chapters (excluding all needles and equipment products): Insulins and Anti-diabetic Drugs. Anti-hyperlipidemic medications included five BNF chapters for Statins, Ezetimibe, Fibrates, Nicotinic Acid, and Bile Acid Sequestrants.
All drugs in these categories that were used in the study timeframe were identified. Each identified product was matched to its listing in the NHS Drug TariffCitation29. Unit costs from September 2014 were used, where possible. For medications that were rarely used and were not included in September 2014, the cost from the closest month prior to September 2014 was used. For drug costing, we identified all unique products used by patients in the cohort to avoid having to match every possible medication. Matching between the drugs in the NHS Drug Tariff and those used in CPRD was performed using string-matching. Using the product name in the CPRD product file, we removed all whitespace, removed text in parentheses (manufacturer name), converted to lower case, and removed the trailing “s” from the dose form. This resulted in a concatenated string of ingredient, dose, and dose form (e.g. “amoxicillin 250 mg capsule”). We did the same for the NHS Drug Tariff product name, although there was no manufacturer name to remove. When no match could be found for a record from the CPRD data, the appropriate cost record was identified by hand. The generic cost was used when there were both branded and generic costs available. For each matching cost record from the NHS Drug Tariff, the cost per unit was calculated (generally cost per pill); total costs were estimated by multiplying the quantity supplied from the CPRD prescription record by the cost per unit for each drug from the NHS Drug Tariff.
Visits and referrals
All GP visits in the Clinical file were classified by a practicing UK clinician who classified each of the 29 consultation types into one of three categories: Clinic, Surgery, and Telephone (see Supplementary Materials). Costs were derived from the 2014 Personal Social Services Research Unit cost reportCitation30. We included direct care staff costs and qualification costs. We wanted to align our costs with the National Institute for Health and Care Excellence (NICE) lipid guidelines, which assigned a single cost to an office visitCitation31. Therefore, we assumed that Clinic and Surgery visits would require similar resources and used the same cost (£46, based on an 11.7-minute patient contact), but that Telephone would require fewer resources and would cost less (£28, based on a 7.1-minute telephone contact). Visits were limited to one per day per type.
Outpatient specialist visits were identified from the Referral file using the “outpatient hospital” classification. Specialist type was identified and matched against the mean NHS Reference cost for office visits to the same (or closest matching) specialtyCitation27.
Study time horizon and follow-up
The date of the CV hospitalization that qualified the patient to be in a cohort was defined as the “index” date. Patients were required to have at least 12 months of data before this date, as well as at least 30 days of follow-up afterward. Demographics and comorbidity information was based on data prior to the index CV hospitalization. The follow-up period started with the date of the index CV hospitalization and continued for up to 36 months, or until the end of data availability (March 31, 2012), date of death, subsequent CV hospitalization, or date of last known up-to-standard CPRD record for the patient in the practice, whichever came first. The first 6-month period after the index CV hospitalization was defined as the “acute period”, and the subsequent 30-month period was defined as the long-term period.
End-points and analyses
Utilization measures were estimated on patients based on available data during follow-up. Costs were estimated by multiplying the quantity of each resource used by the corresponding unit cost of the resource. Inverse probability weighting was used to account for censoring and death when estimating total costsCitation32,Citation33. The intervals used for the weighting were two 6-month time intervals for the first year and annual intervals for years 2 and 3. Death was treated as a censoring event to be consistent with previous workCitation21. We used bootstrapping to estimate variances of the inverse probability weighted estimates for each time interval. Costs for the initial 6-month acute period were reported as acute costs, and costs for the 30-month long-term period were annualized and reported as long-term costs.
Patient demographic and clinical characteristics were described using means and standard deviations for continuous variables, and percentages for categorical variables. All analyses were conducted in R (version 3.2.2).
Results
We identified several challenges related to costing based on the CPRD and HES data. For costing of hospitalizations, the process required identifying appropriate variables across many files, and iterating to identify ICD-10 codes that had been outdated. As a result, we had to update records containing ICD-10 codes rejected by the grouper software due to deprecated codes. These included changing N180 to N185 (end stage renal disease), L89 to L899 (decubitus ulcer), C80 to C800 (malignant neoplasm), H547 to H549 (visual impairment), O60 to O603 (preterm delivery), K85 to K859 (acute pancreatitis), A09 to A090 (diarrhea and gastroenteritis), and N188 to N189 (other chronic renal failure). In addition, we had to add “X” to the end of codes that were less than three characters to match all possible values and improve matching by the HRG grouper software. Hospital records (spells) that could not be costed were dropped (6,678/350,731 = 1.9%). Virtually all of these (6,492/6,678 = 97%) were due to errors detected by the grouper as part of its validation process, resulting in an error HRG (UZ01Z) that indicated an error in the input data preventing the software from identifying a relevant HRG. With regard to prescription costing, matching between the cost file and the prescription file by ingredient name and dose was successfully completed by a simple computer program for about half of the medications; however, the other half had to be matched by hand.
For the estimation part of the study, we identified unique patients with CV hospitalizations in the study time window (105,526), selected those with linked, up-to-standard general practitioner data (69,248), then selected those who received at least two lipid-lowering therapy prescriptions within 180 days (28,051), and finally selected those without a prior history of myocardial infarction or ischemic stroke (24,093). The mean age in the cohort was 72.7 years, mean body mass index was 28.8 kg/m2, mean LDL cholesterol was 2.4 mmol/L, proportion male was 59% and proportion current smokers was 12%. In the cohort, 87% were receiving anti-hypertensive medication, 78% were receiving anti-thrombotics, and 25% were receiving anti-diabetic medications. The most common index CV hospitalization was for UA (24%), followed by revascularization (21%, with PTCA =12% and CABG =9%), MI (19%), HF (15%), IS (14%), and TIA (7%). There were 9,686 person-years of follow-up during the acute period, and 22,798 person-years of follow-up during the long-term period.
For this cohort of patients, we costed 69,240 CV and non-CV hospitalizations, 673,069 GP visits, 32,942 specialist visits, and 2,572,792 prescriptions, representing 855 unique drug and dose combinations. Overall, the 2014 cost per person was £4,060 during the 6-month acute period, and £1,433 per year during the long-term period. For the initial CV hospitalization, the mean cost per patient was £2,889, with a mean length of stay (LOS) of 9.9 days. Because patients were censored at subsequent CV hospitalizations of the kind that were required for inclusion, these were not included in follow-up costs. Mean costs per person and mean LOS per hospitalization for non-CV hospitalizations are provided in for both the acute and long-term periods.
Table 1. Utilization and costs after CV event (2014 £).
The mean CV prescription cost per patient accounting for censoring was £98 during the 6-month acute period, and £209 per year during the long-term period. Accounting for censoring, the mean GP visit cost per person was £377 during the acute period, and £518 per person per year during the long-term period. The mean outpatient specialist visit cost per person was £59 during the acute period, and £103 per person per year during the long-term period ().
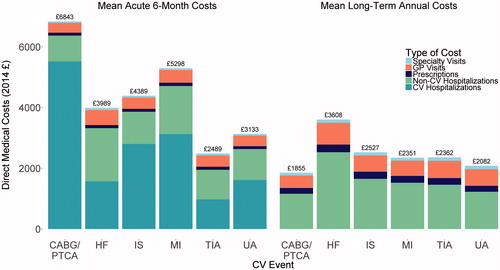
The mean acute period and mean annualized long-term period costs by type of index event are provided in . Mean acute costs per person varied from £2,489 for TIA to £6,843 for revascularization. Long-term annualized costs per person per year ranged from £1,855 for revascularization to £3,608 for HF.
Figure 2: Costs by CV event, type of cost, and time after CV event. See methods for abbreviations and definitions of cost types.
Discussion
This study describes the process, and the results, for estimating direct medical costs from the CPRD and HES data in a cohort of patients experiencing a CV event. Overall, we were able to cost virtually all of the records we intended to include in our research. The ability to estimate the cost of care in the UK using data from routine clinical practice is feasible, making the conduct of cost studies possible. This is greatly facilitated by the NHS efforts to estimate and provide detailed costing resources. In other countries, it may be more challenging to find appropriate costs to combine with utilization data across the continuum of clinical care. However, many of the logistical issues in managing the data (e.g. string-matching, defining visit types, etc.) are likely to be similar.
The clinical results indicated that hospitalization costs and GP visit costs are the largest components of the total direct medical cost in this patient population, whereas medications and specialist visits represented much smaller proportions. Our results were intentionally simple, because the primary aim was to describe the methods we used. These results are useful for burden of illness studies and economic evaluations of cardiovascular interventions. More detailed results using these methods, including longitudinal analyses, are described elsewhereCitation21.
In retrospect, we might have used a simpler approach for drug costing by applying mean costs to classes of medications based on BNF chapter and sub-chapter information. However, there is no single approach to costing prescriptions that will work for all research studies. When studying healthier or lower risk patients where hospitalization costs are less influential and prescriptions more important, it may be important to conduct a similarly precise costing exercise. Furthermore, detailed prescription costing may also be important when measuring the incremental costs attributable to a newly-diagnosed condition, as opposed to measuring the total cost of care (as was done in this study).
Despite the methodological details available from publications estimating costs using CPRD data (with or without HES), there are still several challenges in doing such work. As mentioned previously, one of the largest challenges is mapping all the drug and dose combinations (855 combinations for this study) to an appropriate cost from the NHS Drug Tariff. The NHS Drug Tariff provides monthly costs that are current to the most recent month and year; however, it only reflects drugs that were used in the month of the report. Costs for all medications used during the entire year are available in the Prescription Cost AnalysisCitation34. However, this is published annually, and may not be sufficiently current for some research needs. In either case, the drug costs can only be matched to CPRD prescription records using string-matching using ingredient, dose, and dose form.
Another approach would have been to map the drugs from each data source to a common representation of the drug. The RxNorm drug vocabulary was designed for this kind of application, although it does not contain direct mappings to the NHS Drug Tariff or the CPRD product tableCitation35. RxNorm has a standard representation of ingredients, as well as their synonyms, and also has relationships that link these ingredients to available doses and dose formsCitation36. Hence, using this approach requires mapping from the raw data to ingredients, which may be more successful than matching concatenated ingredient, dose, and dose form strings. One potential limitation to using RxNorm is that it is focused on drugs available in the US market, and may not cover all UK-specific drugs or formulations. Vocabulary mappings between RxNorm and Gemscript codes (included in the CPRD product file) are being developed by the Observational Health Data Sciences and Informatics organization, and may eventually handle half of the required mapping processCitation37.
There were challenges with missing data, which is endemic to all research using data captured for other purposes. The linkage between CPRD and HES is available for just under 60% of practices in the UK, which might be a problem for smaller cohortsCitation38. Also, missing or incomplete records can make it challenging to import HES data in the required format required for the HRG calculator. Also, as others have done, we used the HRG calculator for a specific year to generate costs from that year. This means that deprecated ICD-10 codes must be changed to reflect those in place in the year used for costing. Depending on the years involved and the coding changes that occurred, this may be a simple or complicated process.
Physician visits were classified using 29 different terms in our version of the CPRD data. Based on clinical input the terms were categorized into three groups: clinic, surgery, and telephone. Clinic and surgery were subsequently collapsed into a GP office visit, resulting in two categories (office visit and telephone consultation). The decision to do this was based on aligning with the NICE lipid guidelines which assigned a single cost to an office visit. Others have taken a different approach, using the actual visit duration and staff role (e.g. nurse, physician, etc.) multiplied by the appropriate PSSRU costs per minute, to estimate a more precise cost for each visitCitation9,Citation11.
We used CPRD outpatient specialist referral data to estimate outpatient visit costs because the HES outpatient data were not available. This required mapping the 89 specialist categories in CPRD to those in the NHS Reference Costs, which is an imperfect process. In our study, these costs were not influential, so any inaccuracies are unlikely to affect the results in any meaningful way. However, for conditions that involve a substantial amount of specialist visits, this would not be the case. Furthermore, HES Outpatient data are now available, which may provide more detail. For studies using HES Outpatient data, the process of costing visits is provided by Canavan et al.Citation7.
Like others, we did not include costs for tests in our study. Because of the low cost for simple, commonly used tests like lipid panels and complete blood counts, we elected to ignore these costs. However, others have included test costs, and the methods for these are provided in several studiesCitation13,Citation16. They generally involve identifying the Read codes for relevant tests, and identifying the appropriate NHS cost for each. As with medications, the choice of whether to include such costs, and which tests to include, should depend on the research question. Similarly, the use of care homes (nursing homes) or other methods of assisted living or long-term rehabilitation are not included in the data we had available, but they may be relevant for specific clinical areas.
In terms of logistical considerations in building a study, it may be preferable to incorporate cost data, prior to finalizing the study cohort, as we did with the HES data. In principle, it should not matter, but research is an iterative process and it may take some time to finalize a cohort because of quality checks and software code reviews. Inadvertently excluding even a single patient would require the costing process to be repeated; hence, we recommend applying costs to a “super-cohort” of patients over all follow-up time. This process ensures that any programming errors or other changes do not require any changes to the costing process.
The process of applying costs to observational data is still challenging, even with high quality data provided by the NHS. This is particularly true for medications, where it would be beneficial to be able to link drugs between the NHS Drug Tariff and the CPRD prescription data. The importance of drug costs was disproportionate to the effort required to estimate the costs in this study; however, this is not likely to be true for other studies. Having established mappings between the available cost files and the CPRD files would greatly facilitate research involving the cost of care in the UK.
Transparency
Declaration of funding
This study was funded by Amgen Inc.
Declaration of financial/other relationships
MD, MG, and RG work with Outcomes Insights, Inc., which was funded to conduct this study. LK and DC are employees of Amgen as well as shareholders. JME peer reviewers on this manuscript have no relevant financial or other relationships to disclose.
Supplementary_Materials.docx
Download MS Word (23.7 KB)Acknowledgments
Ethics approval and consent to participate: CPRD data is de-identified for research purposes, and was exempt from the need for ethics approval. This research was approved by the CPRD Independent Scientific Advisory Committee (ISAC).
Availability of data and material: The data that support the findings of this study are available from CPRD, but restrictions apply to the availability of these data, which were used under license for the current study, and so are not publicly available. Data are, however, available from the authors upon reasonable request and with permission of CPRD until applicable data retention policies require the destruction of the study data sets.
References
- Weinstein MC, O’Brien B, Hornberger J, et al. Principles of good practice for decision analytic modeling in health-care evaluation: report of the ISPOR Task Force on Good Research Practices—Modeling Studies. Value Health 2003;6:9-17
- Caro JJ, Briggs AH, Siebert U, et al. Modeling good research practices—overview: a report of the ISPOR-SMDM Modeling Good Research Practices Task Force–1. Med Decis Making 2012;15:796-803
- Garrison LP, Neumann PJ, Erickson P, et al. Using real-world data for coverage and payment decisions: the ISPOR Real-World Data Task Force report. Value Health 2007;10:326-35
- Oyinlola JO, Campbell J, Kousoulis AA. Is real world evidence influencing practice? A systematic review of CPRD research in NICE guidances. BMC Health Serv Res 2016;16:299
- Department of Health. NHS reference costs. Reference Cost Collection: National Schedule of Reference Costs—Year 2013–14. 2014. https://www.gov.uk/government/collections/nhs-reference-costs. [Last accessed 20 January 2015]
- Curtis L. Personal social services research unit. Unit Costs Heal Soc Care 2014. 2014. http://www.pssru.ac.uk/project-pages/unit-costs/2014/. [Last accessed 20 January 2015]
- Canavan C, West J, Card T. Calculating total health service utilisation and costs from routinely collected electronic health records using the example of patients with irritable bowel syndrome before and after their first gastroenterology appointment. Pharmacoeconomics 2016;34:181-94
- Fleming DM, Taylor RJ, Haguinet F, et al. Influenza-attributable burden in United Kingdom primary care. Epidemiol Infect 2016;144:537-47
- Happich M, Kirson NY, Desai U, et al. Excess costs associated with possible misdiagnosis of Alzheimer’s disease among patients with vascular dementia in a UK CPRD population. J Alzheimers Dis 2016;53:171-83
- Hollingworth W, Biswas M, Maishman RL, et al. The healthcare costs of heart failure during the last five years of life: A retrospective cohort study. Int J Cardiol 2016;224:132-8
- Kingswood JC, Nasuti P, Patel K, et al. The economic burden of tuberous sclerosis complex in UK patients with renal manifestations: a retrospective cohort study in the clinical practice research datalink (CPRD). J Med Econ 2016;19:1-11
- Rudisill C, Charlton J, Booth HP, et al. Are healthcare costs from obesity associated with body mass index, comorbidity or depression? Cohort study using electronic health records. Clin Obes 2016;6:225-31
- Holden SE, Jenkins-Jones S, Poole CD, et al. The prevalence and incidence, resource use and financial costs of treating people with attention deficit/hyperactivity disorder (ADHD) in the United Kingdom (1998 to 2010). Child Adolesc Psychiatry Ment Health 2013;7:34
- Punekar YS, Wurst K, Shukla A. Resource use and costs up to two years post diagnosis among newly diagnosed COPD patients in the UK primary care setting: a retrospective Ccohort study. COPD 2015;12:267-75
- Reed C, Hong J, Novick D, et al. Health care costs before and after diagnosis of depression in patients with unexplained pain: a retrospective cohort study using the United Kingdom General Practice Research Database. Clinicoecon Outcomes Res 2013;5:37-47
- Violato M, Gray A, Papanicolas I, et al. Resource use and costs associated with coeliac disease before and after diagnosis in 3,646 cases: results of a UK primary care database analysis. PLoS One 2012;7:e41308
- Wade AG, Saragoussi D, Despiégel N, et al. Healthcare expenditure in severely depressed patients treated with escitalopram, generic SSRIs or venlafaxine in the UK. Curr Med Res Opin 2010;26:1161-70
- Lafuma A, Laurendeau C, Berdeaux G. Costs and persistence of brimonidine versus brinzolamide in everyday glaucoma care: an analysis conducted on the UK General Practitioner Research Database. J Med Econ 2008;11:485-97
- Asaria M, Grasic K, Walker S. Using linked electronic health records to estimate healthcare costs: key challenges and opportunities. Pharmacoeconomics 2016;34:155-60
- British Heart Foundation. British Heart Foundation CVD statistics. 2016. https://www.bhf.org.uk/research/heart-statistics. [Last accessed 1 October 2016]
- Danese MD, Gleeson M, Kutikova L, et al. Estimating the economic burden of cardiovascular events in patients receiving lipid-modifying therapy in the UK. BMJ Open 2016;6:e011805
- Herrett E, Gallagher AM, Bhaskaran K, et al. Data resource profile: Clinical Practice Research Datalink (CPRD). Int J Epidemiol 2015;44:827-36
- Williams T, van Staa T, Puri S, et al. Recent advances in the utility and use of the general practice research database as an example of a UK Primary Care Data resource. Ther Adv Drug Saf 2012;3:89-99
- Health and Social Care Information Centre. QOF Business Rules, v28.0. http://www.hscic.gov.uk/qofbrv28. [Last accessed 20 January 2015]
- Aylin P, Williams S, Bottle A, et al. Counting hospital activity: spells or episodes? BMJ 2004;329:1207
- Health and Social Care Information Centre. HRG4+ Grouper Reference Manual Reference Costs 13/14. 2014. http://content.digital.nhs.uk/media/13823/HRG4-201314-RC-Grouper-Reference-Manual/pdf/HRG4__201314_Reference_Costs_Grouper_Reference_Manual_v1.0.pdf [Last accessed 20 January 2015]
- Department of Health. NHS reference costs 2013 to 2014. www.gov.uk. 2014. https://www.gov.uk/government/publications/nhs-reference-costs-2013-to-2014. [Last accessed 20 January 2015]
- Joint Formulary Committee, 2015. British National Formulary. 69. London: BMJ Group and Pharmaceutical Press.
- National Health Service England and Wales. Electronic drug tariff. Surry; 2014. http://www.ppa.org.uk/edt/September_2014/mindex.htm [Last accessed 20 January 2015]
- Curtis L. Unit costs of health and social care 2014. Kent: University of Kent, Personal Social Services Research Unit; 2014
- NICE. Lipid modification: NICE guideline (CG181). Natl Inst Heal Clin Excell 2014;12:231-54
- Lin DY. Linear regression analysis of censored medical costs. Biostatistics 2000;1:35-47
- Griffiths RI, Gleeson ML, Danese MD, et al. Inverse probability weighted least squares regression in the analysis of time-censored cost data: an evaluation of the approach using SEER-Medicare. Value Health 2012;15:656-63
- Health and Social Care Information Centre. Prescription cost analysis, England 2014. 2015. http://content.digital.nhs.uk/catalogue/PUB17274. [Last accessed 17 November 2016]
- Liu S, Ma W, Moore R, et al. RxNorm: Prescription for electronic drug information exchange. IT Prof 2005;7:17-23
- National Library of Medicine. RxNorm technical documentation[ 2017. https://www.nlm.nih.gov/research/umls/rxnorm/docs/2017/rxnorm_doco_full_2017-2.html. [Last accessed 22 May 2017]
- Observational Health Data Science and Informatics. Athena standardized vocabularies. 2016. http://www.ohdsi.org/web/athena/. Last accessed 22 May 2017
- Clinical Practice Research Datalink. CPRD linked data; 2017. https://www.cprd.com/dataAccess/linkeddata.asp. [Last accessed 22 May 2017]