
Abstract
Aim: To assess the cost-effectiveness of nutrition education by dedicated dietitians (DD) for hyperphosphatemia management among hemodialysis patients.
Materials and methods: This was a trial-based economic evaluation in 12 Lebanese hospital-based units. In total, 545 prevalent patients were cluster randomized to DD, trained hospital dietitian (THD), and existing practice (EP) groups. During Phase I (6 months), DD (n = 116) received intensive education by DD trained on renal nutrition, THD (n = 299) received care from trained hospital dietitians, and EP (n = 130) received usual care from untrained hospital dietitians. Patients were followed-up during Phase II (6 months).
Results: At baseline, EP had the lowest weekly hemodialysis time, and DD had the highest serum phosphorus and malnutrition-inflammation score. The additional costs of the intervention were low compared with the societal costs (DD: $76.7, $21,007.7; EP: $4.6, $18,675.4; THD: $17.4, $20,078.6, respectively). Between Phases I and II, DD showed the greatest decline in services use and societal costs (DD: –$2,364.0; EP: –$1,727.7; THD: –$1,105.7). At endline, DD experienced the highest decrease in adjusted serum phosphorus (DD: –0.32; EP: +0.16; THD: +0.04 mg/dL), no difference in quality-adjusted life-years (QALY), and the highest societal costs. DD had a cost-effectiveness ratio of $7,853.6 per 1 mg decrease in phosphorus, compared with EP; and was dominated by THD. Regarding QALY, DD was dominated by EP and THD. The results were sensitive to changes in key parameters.
Limitations: The analysis depended on numerous assumptions. Interpreting the results is limited by the significant baseline differences in key parameters, suggestive of higher baseline societal costs in DD.
Conclusions: DD yielded the greatest effectiveness and decrease in societal costs, but did not affect QALY. Regarding serum phosphorus, DD was likely to be cost-effective compared with EP, but had a low cost-effectiveness probability compared with THD. Regarding QALY, DD was not likely to be cost-effective. Assessing the long-term cost-effectiveness of DD, on similar groups, is recommended.
Introduction
Elevated serum phosphorus is a serious consequence of chronic kidney disease. It is associated with increased patient morbidityCitation1, mortalityCitation2–5, and high healthcare costsCitation6. International clinical practice guidelines recommend “normalizing” serum phosphorus of hemodialysis patients through dialysis, phosphate-binding medications, and low phosphorus dietCitation7,Citation8. However, more than a decade after the first guidelines were issued, hyperphosphatemia remains a common condition among renal patients, especially those treated with hemodialysis, with nearly one in two patients being hyperphosphatemicCitation9,Citation10.
Economic evaluations are a useful tool to identify the economic value of an intervention and guide decision-making in healthcare. Up-to-now, efforts were focused on one intervention in the field of hyperphosphatemia management, which is phosphate bindersCitation11. Despite the mounting evidence on the clinical effectiveness of nutrition educationCitation12, the cost-effectiveness of this intervention has not been addressedCitation11.
The most recent local evidence on the effectiveness of dietetic interventions for hyperphosphatemia management among prevalent hemodialysis patients emanates from the Nutrition Education for Management of Osteodystrophy (NEMO) trialCitation13 Results from the NEMO trial showed that intensive nutrition education by dedicated dietitians targeting hyperphosphatemia management was superior to the other protocols in reducing serum phosphorus, without compromising the nutritional status of the patientsCitation14–16. Assessing the value for money of dedicated dietitians would be very important for helping decision-makers efficiently allocate scarce resources devoted to hemodialysis patients.
The aim of this study was, therefore, to conduct an economic evaluation (including a cost-effectiveness analysis (CEA) and a cost-utility analysis (CUA)), from the societal perspective of the nutrition education provided by dedicate dietitians for hemodialysis patients in Lebanon, in comparison with the existing practice in the country and to another proposed alternative.
Methods
We used individual patient-level data from the NEMO trial to perform the CEA and CUA, and followed international guidelines for the analysis and reporting of economic evaluationsCitation17,Citation18. A societal perspective was used, with a time horizon of 1 year.
Trial
Design
The design, methods, and clinical results of the NEMO trial are detailed elsewhereCitation13–16. The NEMO trial was conducted in Lebanon, where all hemodialysis units are hospital-based. The NEMO trial compared three protocols of nutrition education for hyperphosphatemia management among hemodialysis patients. In brief, 12 hospital-based hemodialysis units (n = 570) were randomly assigned to cluster A (6 units; n = 271) and cluster B (6 units; n = 299). Cluster A patients were then equally assigned according to their hemodialysis shifts into two protocols: dedicated dietitian (DD) (n = 133) and existing practice (EP) (n = 138); cluster B patients were assigned to the trained hospital dietitian (THD) protocol. Participants were followed for 12 months, and measures were collected at three time-points: t-0 (beginning of month 1), t-1 (end of month 6) and t-2 (end of month 12). The NEMO trial received ethical approval from the ethical committees of participating hospital-based hemodialysis units, and was conducted according to the Declaration of Helsinki.
Subjects
Consenting patients, adult, receiving dialysis for at least 6 months, free of cancer, infection with human immunodeficiency virus, and hepatitis C were considered.
Interventions
Phase I (t-0 to t-1: 6 months):
The DD group received intensive nutrition education during hemodialysis sessions by dietitians who were trained on renal nutrition and dedicated to the hemodialysis units. The nutrition education in this group targeted hyperphosphatemia management using a renal-oriented culturally-validated educational tool based on the transtheoretical model of behavioral changeCitation13. It was delivered on a basis of 2 h per month. The existing practice was not compromised in DD units, and hospital dietitians were left to provide their usual care.
The EP group received the usual care by their hospital dietitians, i.e. patient consultations delivered only following nephrologists’ consult requests. This group represented the existing practice in Lebanon, where dietitians have limited knowledge about renal nutrition, and are not dedicated to hemodialysis patients.
The THD group received care by their hospital dietitians, as per the latter’s availability; however, in this group, the dietitians were equally trained on renal nutrition as the dedicated dietitians, but were not devoted to hemodialysis patients in particular. This group represented an alternative to having a dedicated dietitian; whereby the hospital dietitians’ education is ensured, but the dietitian-to-patient frequency of consultations or contact time was not set.
Phase II (t-1 to t-2: 6 months) was a follow-up period.
Economic evaluation
Outcomes
The outcome of the CEA was serum phosphorus, and that of the CUA was quality-adjusted life-year (QALY).
Serum phosphorus was retrieved from the patients’ medical charts, and its 6-month mean values were calculated at t-0, t-1, and t-2.
QALY incorporates the quality of a health state (quality-of-life: QoL) with the duration of survival (life-years: LYs) using a multiplicative formula. It is the preferred and most common outcome in economic evaluationCitation19. QoL was measured with the Short Form (SF)-36 questionnaire, assessing the two dimensions of physical and mental health over the past 30 daysCitation20. Patients completed the validated culturally-specific pilot-tested version of the SF-36Citation13,Citation21 at the three time-points.
Costs
Cost data were collected at t-1 and t-2, following the three steps of costs identification, measurements, and valuation, as detailed in Rizk et al.Citation22.
Costs identification: included costs were categorized as (1) healthcare sector costs (cost of the intervention (nutrition education), costs associated with hemodialysis, emergency hemodialysis, healthcare professional consultation, hospitalization, medications, and integrated home care); (2) costs to patient and family (caregiver costs and productivity losses); and (3) costs in other sectors (travel costs)Citation17.
Costs measurement: using a pilot-tested resource utilization questionnaire (Appendix 1) adapted to Lebanese hemodialysis patients.
Costs valuation: the costs were gathered and calculated in Lebanese pounds (LBP), converted to US$(1 US$ = 1,507.5 LBP; year of reference: 2011)Citation23 and uprated to 2015US$ using Consumer Price Indices (Index, 2010 = 100)Citation24. A macro-costing valuation was applied, whereby composite intermediate resources were identified and measured. The mean reported costs incurred by patients were used to value the costs of emergency hemodialysis, consultations with healthcare professionals, hospitalizations, and professional care. The costs of drugs were derived from the Lebanese National Drug IndexCitation25. The valuation of informal care was based on the proxy good methodCitation26, and the valuation of productivity losses was based on the human capital approachCitation27.
The costing of the intervention (nutrition education) in each group is detailed in Appendix 2.
The reported quantity/frequency of use of each service was multiplied by its respective mean cost to obtain the total costs. Discounting was not applied, because the analysis was limited to 1 year.
Preparation of data
Serum phosphorus was adjusted for baseline differences between the three groups, following a regression method controlling for baseline serum phosphorus, age, gender, weekly hemodialysis time, and malnutrition-inflammation score (MIS), as detailed by van Mastrigt et al.Citation28. For the base-case CEA, missing values of patients who withdrew during Phase I were replaced by their baseline value minus half of the difference in serum phosphorus between t-0 and t-1 of participants from the same unit and study group (peers), assuming that the patients attrited at mid-point of the phase and that evolution of serum phosphorus was linear. For Phase II, missing values were replaced by the patients’ values at t-1 minus the difference in serum phosphorus between t-1 and t-2 of their peers.
For the CUA, SF-36 QoL data were converted to utilityCitation29. Mean utility between t-0 and t-1; and between t-1 and t-2 was retained for Phase I and Phase II, respectively. Missing QoL data were imputed by last observation carried forward, when available, or by the mean of the peers. Regarding LYs, for each phase survived, patients were allocated 0.5 LYs. Patients not surviving the phase due to mortality or extended hospitalization were allocated 0.25 LYs, assuming that they withdrew at the mid-point of the study phase. The LYs of those who were transferred, got a transplant, or withdrawal were imputed by the mean of their peers. QALYs were the product of utility and LYs. Total QALYs were obtained by summing QALYs at each phase.
As for the costs, the missing values of patients who survived the phase were imputed by the mean of their peers. For those who died or were extensively hospitalized, their values were imputed by half of the mean costs of their peers, for the same above-mentioned reasoning. Those who attrited for other reasons were attributed the mean costs of their peers in parallel to their LYs.
Analyses
Analyses were conducted using SPSS. Descriptive statistics were generated. Chi-square and Student’s T-test were used to determine the baseline between-group differences for categorical and continuous data, respectively. One-way ANOVA followed by Bonferroni Post-Hoc were used to assess the between-group differences in costs at t-1 and t-2; p < .05 was used for significance.
To determine the cost-effectiveness and cost-utility of DD, incremental cost-effectiveness and cost-utility ratios (ICERs, ICURs) were calculated. The ICER or ICUR is a ratio that compares the additional costs and effects of the assessed intervention with the control. The cost-effectiveness and cost-utility of DD vs EP/THD were calculated as the difference in mean costs (C) divided by the difference in mean effects (E) (serum phosphorus and QALY, respectively) at t-2:
DD vs EP = (CDD – CEP)/(EDD – EEP); DD vs THD = (CDD – CTHD)/(EDD – ETHD).
Sensitivity analyses
Three one-way sensitivity analyses were performed to test the robustness of the results of the base-case. The first analysis assessed the effects of excluding the costs of the maintenance hemodialysis and transportation, following the reasoning of Grima et al.Citation30. The second analysis examined the impact of imputation, thus included complete cases only. The third analysis was carried out only on hyperphosphatemic patients (phosphorus >5.5 mg/dL) at baseline, as they are at higher risks for morbi-mortality, and are suggested to have higher costs than normophosphatemic patients. In the final analysis, the mean drop in unadjusted serum phosphorus between t-2 and t-0 (delta adjustment) was used for the CEA. For the CUA, we used the regression-based adjusted QALYs. In this analysis, QALYs were adjusted for baseline differences in utility between the three groups. We resorted to this adjustment because QoL is associated with clinical outcomes among hemodialysis patients, including hospitalization and mortalityCitation20,Citation31.
Non-parametric bootstraps were conducted to assess the stochastic uncertainty in the data using the bootstrapping technique in Excel, where the original sample was re-sampled, resulting in 5,000 simulated ICERs/ICURs per scenario. Cost-effectiveness/utility acceptability curves (CEACs/CUACs) were plotted using the probability estimates of DD’s cost-effectiveness (compared with each of the other interventions) over a range of willingness-to-pay (WTP) thresholds. The latter were defined as the amount of money the society is willing to pay to gain one unit of effect. In Lebanon, the value the society is willing to pay to gain one QALY is not defined. Accordingly, we used several thresholds ranging from three times the Gross Domestic Product in Lebanon ($31,272.84)—threshold suggested by the World Health OrganizationCitation32,Citation33, to £30,000 ($43,612.49)—explicit threshold adopted in the UKCitation34, and $50,000—implicit threshold adopted in the USCitation35.
Results
Patients’ characteristics
The flow diagram of the trial is detailed in Appendix 3. At baseline, the three groups were comparable with respect to sociodemographic characteristics, except for employment status. Weekly hemodialysis time was significantly lower in the EP group. The DD group had the highest mean serum phosphorus, which was above the recommended rangeCitation7. Also, the DD group had the highest mean MIS, denoting the worst malnutrition-inflammation status ().
Table 1. Participants’ characteristics (n = 545).
Services use
During Phase I, the DD group consumed more services than other groups (especially emergency hemodialysis, specialist physician consults, several medications, and hospitalization). The THD group used more professional home care and lost most productivity hours. The EP group used more informal care. During Phase II, the DD group consumed a greater volume of emergency hemodialysis, specialist physician consults, sevelamer, and erythropoietin. The THD group consumed more calcium carbonate, professional home care, and lost most productivity hours ().
Table 2. Services use during the 12-month period.
Between Phase I and Phase II, the DD group showed the greatest decline in the use of the most costly healthcare services. The volume of emergency hemodialysis in this group decreased by 44% compared with 18.6% and 16.8% in the EP and THD groups, respectively. The consumption of sevelamer decreased in the DD group by 51.1%, relative to 32.2% in the EP group, and to an increase of 29.8% in THD. Hospitalization days decreased by 48.4% in the DD group, compared with 11.9% and 2% in the EP and THD groups, respectively. The DD group also exhibited the slowest increase in productivity losses (+7.44% vs +57.6% and +19.6% for DD, EP, and THD, respectively).
Costs
The cost distribution of the three groups is displayed in Appendix 4. As per , the societal, healthcare, patient, and family-related costs differed between groups. The mean cost of the nutrition education was highest in the DD group; yet the cost of this intervention represented less than 1% of the societal costs of each of the three groups during both study phases.
Table 3. Costs during the 12-month period (US$2015).
The mean societal costs were highest in the DD group. Similarly, the mean healthcare costs were highest in the DD group. The THD group had the highest mean costs to patients and family. During Phase I, the social costs were highest in the DD group, whereas, during Phase II, THD had the highest costs.
Between Phase I and Phase II, the DD group exhibited the highest decrease in societal costs (–$2,226.4) compared with the EP (–$1,320.8) and THD (–$654.6) groups. This was remarkably noted for the costs of emergency hemodialysis (–$51 vs –$11.5 vs –$2.4, for DD, EP, and THD, respectively), medications (–$419.9 vs –$61.0 vs –$58.5), and hospitalization (–$1,151.0 vs –$1,010 vs –$310.6) costs.
Study outcomes
During Phase I, the adjusted serum phosphorus decreased in the DD (mean drop: –0.58 mg/dL) and EP (mean drop: –0.09 mg/dL) groups; and remained unchanged in the THD group. During Phase II, mean serum phosphorus increased in all groups. This increase was accentuated in the DD and EP groups (+0.26 and +0.25 mg/L, respectively) more than the THD group (+0.04 mg/dL). At the end of the study, the EP group had the highest mean adjusted serum phosphorus. Moreover, mean adjusted serum phosphorus was higher than baseline values in the EP and THD groups, in contrast to the DD group. At each study phase, the EP group gained the most QALYs ().
Table 4. Study outcomes (mean (SD)).
Cost-effectiveness and cost-utility analyses
In the base-case CEA (), in comparison with the EP protocol, the ICER of DD for societal costs per 1 mg decrease in serum phosphorus was $7,853.6. On the other hand, the THD protocol dominated the DD protocol, i.e. the DD group had higher serum phosphorus and higher societal costs. The THD protocol was likely to be the most cost-effective intervention ().
Figure 1. Cost-effectiveness acceptability curve presenting the probability that the protocol is cost-effective (y-axis) with respect to serum phosphorus, given various ceiling ratios for willingness-to-pay (x-axis). The ICER was represented in absolute values, given that the beneficial outcome is the decrease in serum phosphorus, resulting in a negative ICER. DD, dedicated dietitian; EP, existing practice; THD, trained hospital dietitian; ICER, incremental cost-effectiveness ratio.
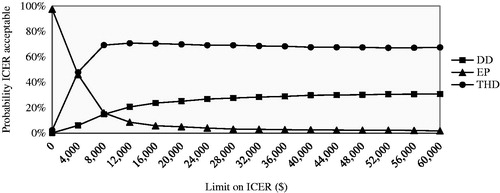
Table 5. Incremental cost-effectiveness and cost-utility ratios.
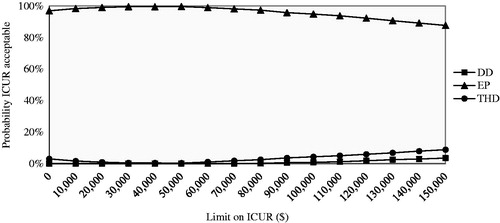
In the CUA, the DD protocol was dominated by the EP and THD protocols. Even for the highest WTP threshold, the probability of the DD protocol being cost-effective was almost null. The EP protocol had the highest probability of being cost-effective ().
Figure 2. Cost-utility acceptability curve presenting the probability the protocol is cost-effective (y-axis) with respect to quality-adjusted life-year gain, given various ceiling ratios for willingness-to-pay (x-axis). DD, dedicated dietitian; EP, existing practice; THD, trained hospital dietitian; ICUR, incremental cost-utility ratio.
Sensitivity analyses
The results of the cost-effectiveness and cost-utility of the three protocols were inconclusive (). Regarding serum phosphorus, for all the scenarios, the ICER of DD vs EP was lower than the base-case result, thus more cost-effective. When compared with THD, the ICER of DD ranged between $9,212.8 for the delta adjustment, and $265,243.2 for hyperphosphatemic cases. The THD protocol had the highest probability of being cost-effective for hyperphosphatemic patients and when hemodialysis and transportation costs were excluded. For the delta adjustment, and for complete cases, the probability of DD and THD being cost-effective tied at $8,000 and $60,000, respectively. Above these values, DD was the most cost-effective protocol (Appendix 5).
Regarding QALY, the DD protocol was dominated by EP for all scenarios, expect for hyperphosphatemic cases, and by THD for all scenarios, except for complete cases. Even for the highest suggested WTP threshold, the probability of the DD protocol being cost-effective was low. EP was the most cost-effective protocol (Appendix 6).
Discussion
In this study, we explored the cost-effectiveness of intensive nutrition education provided by trained dedicated dietitians (DD), compared with the existing practice (EP) in Lebanon—where dietitians have limited knowledge about renal nutrition and no dietitian-to-patient contact time is set, and to another protocol (THD)—where dietitian education is ensured, yet the contact time with the patients is not established.
The results showed that the direct costs of the nutrition education are extremely low compared with the costs of other interventions incurred as part of the management of hemodialysis patients. At the end of the study, in comparison with the EP and THD groups, the DD group exhibited the greatest decrease in serum phosphorus, no difference in QALY, and the highest societal costs.
Regarding serum phosphorus management, the DD protocol was likely to be cost-effective compared with the EP protocol. However, it is very difficult to draw a firm conclusion of this analysis, since we lack a societal WTP threshold for a decrease in serum phosphorus. On the other hand, the results were inconclusive for the comparison of the DD protocol vs THD protocol. Regarding QALY, the DD protocol was dominated by both of the other protocols, in most of the cases. When DD was not dominated (the case of hyperphosphatemic patients in comparison with EP, and complete cases in comparison with THD), it was associated with a cost per QALY gained higher than what is considered to be an efficient use of finite healthcare resourcesCitation32,Citation34,Citation35. The probability of the DD protocol being cost-effective was low for the base-case and sensitivity analyses.
Several factors might explain these results. At baseline, the DD group had the highest MIS and serum phosphorus. High MIS predicts increased mortality, days, and frequency of hospitalization, as well as lower QoLCitation36–39. High serum phosphorus is associated with the same deleterious consequencesCitation2–5,Citation40. This suggests higher baseline costs of DD compared with the other groups. This might also explain the greater decline in resources use and costs (notably for hospitalization and medications, especially costly phosphate binders) after the implementation of the intervention (Phase II). Within this scope, it is worthy to note that, despite achieving a greater serum phosphorus decrease in comparison with THD (–0.32 vs +0.04 mg/dL), mean serum phosphorus of the DD group remained higher, causing it to be dominated in the base-case analysis. The contradictory results between this analysis and the one using the delta adjustment illustrate this observation. Moreover, patients in the DD group might have been more critically ill than those in the other groups, as exhibited by the high mortality rate even before enrollment in the study (Appendix 3). In addition, as mentioned in Karavetian et al.Citation14, the effectiveness of the DD protocol might have been partially “masked” by the improvement noted in the EP group, where contamination of information through patients and nurses and passive education through posters and distribution of educational material took place; and in THD group, where the intervention was sustained during Phase II, in contrast to the DD group, where the intervention was stopped.
The sensitivity analysis demonstrated uncertainty in the cost-effectiveness of the DD protocol. In particular, we were not able to identify whether the nutrition education is an economically attractive intervention among hyperphosphatemic patients, and contradictory results were obtained regarding serum phosphorus and QALY. This finding is not in line with results from a previous economic evaluation of phosphate bindersCitation41, which revealed better cost-effectiveness with increasing serum phosphorus—taking into account the accentuated morbi-mortality risk with hyperphosphatemia. The limited time horizon in our study (1 year vs lifetime in Brennan et al.Citation41) might explain this contradictory finding, as it did not allow us to explore whether there is a future decrease in mortality and morbidity with better phosphorus control due to the nutrition education.
Our analysis depended on numerous assumptions and has several limitations. First, although we resorted to adjustments for baseline differences in key parameters of the economic evaluation (serum phosphorus and utility), we were not able to adjust our analysis for all baseline differences between the three groups, notably the malnutrition-inflammation status. Second, we did not collect cost data at baseline, assuming that the cluster randomization would results in similar groups; however, this was not the case and groups ended having different baseline key variables. As these baseline differences suggest higher baseline use of resources and costs in the DD group, it would have been wise to collect costs data at baseline, and resort to a regression-based adjustment of patient-level cost dataCitation42. Although it is uncommon to report baseline costs in trial-based economic evaluations, van Asselt et al.Citation42 argued that costs at baseline would influence costs during the trial and presented the case for reporting these costs and investigating their influence, to be able to attribute the difference that is found at endline to the intervention. Third, the most important assumptions in our analysis related to attrited cases. We used patient-specific values when available from a previous time-point, and followed the imputation by the mean using the most detailed values, where data from a previous time-point were unavailable. We assumed that is the most feasible method, in light of the limited number of patients in each group in each unit, although it might not be the most robust one. The results were sensitive to this parameter, and ICERs/ICURs varied between the base-case analysis and when only complete cases were included. Potentially, attrited patients had different resource-consuming characteristics than the ones who finished the trial. A post-hoc analysis addressing this issue might provide an answer to this question. In addition, we assumed that death or hospitalization took place at the mid-point of each phase, that costs and serum phosphorus followed a linear evolution throughout time, and that patients maintained the same QoL at withdrawal, and applied our analyses accordingly. We adopted this method because costs, serum phosphorus, and QoL values were not available at time of attrition; and due to the lack of studies describing the evolution of costs, serum phosphorus, and QoL, mainly before death, transfer, and transplant in hemodialysis patients. Fourth, as discussed in Rizk et al.Citation22, the estimation of resources consumption used a self-reported questionnaire, rather than documented sources (patient or facility records). This potentially leads to recall bias or poor understanding of the questions among patients with limited cognitive skills. Valuation of some resources costs also relied on information collected from patients, due to the lack of a manual for cost analysis in healthcare research in LebanonCitation22. In an attempt to overcome these two limitations, the resource utilization questionnaire used in this study was designed following good practices for improved accuracyCitation43. Fifth, economic evaluations of interventions targeting hyperphosphatemia management in hemodialysis patients usually adopt a time horizon longer than the one adopted in this study, in order to capture the long-term effect of reducing serum phosphorusCitation11. In fact, the time horizon should be long enough to include all relevant costs and outcomes of the interventionCitation44. This was not the case of our analysis, and exploring the cost-effectiveness of the DD protocol through a model-based analysis adopting a lifetime horizon is needed, especially that this protocol was associated with the best clinical outcomes and greatest decrease in societal costs in post-implementation. Additionally, it is worthy to note that the cost of the intervention is expected to further decrease in the long run, taken that the initial training of the dietitians (≈10% of the cost of DD intervention) is a one-time intervention. Finally, differences in healthcare systems funding, costs of healthcare and other resources, and societal WTP for health interventions, among other factors, limit our ability to directly generalize our results to other countries.
The primary strength of this analysis is that it used patient-level data from a randomized controlled trial; and tried to compare a novel intervention with the existing practice, and to another alternative. This could be considered as a first step towards implementing evidence- and value-based care for hemodialysis patients in Lebanon. In addition, the NEMO trial was conducted following a practical fashion, increasing the likelihood of the generalizability of its results to real-world practice; and its economic evaluation was performed from the preferred (societal) perspective.
According to the National Kidney Registry, nearly 3,300 patients receive hemodialysis in LebanonCitation45. The monthly budget implications of making dedicated dietitians available for all patients would be substantial (≈$40,000). Yet, a closer look at the cost savings of this intervention are also likely to be quite substantial, making this intervention worthy of an exhaustive evaluation and possibly of its consideration as part of the management of hemodialysis patients. For instance, the difference in the mean decrease in societal costs between DD and EP ($636.3) and between DD and THD ($1,258.3) in post-implementation would offset more than 8- and 16-times the cost of the 6-month nutrition education, respectively.
Finally, this CEA/CUA assessed dedicated dietitians providing education targeting serum phosphorus management. This is one aspect of the medical nutrition therapy of renal patients; and exploring other outcomes of the dietetic management is recommended, especially that previous evidence suggests substantial cost savings of nutrition interventions among renal patients through malnutrition prevention and managementCitation46 and improved QoLCitation47,Citation48. Future clinical studies should investigate the impact of nutrition education on relevant clinical end-points (i.e. morbidity and mortality), and CEA should assess equitable groups at baseline using an extended time horizon, to provide a more realistic evaluation of the economic attractiveness of this intervention. While healthcare funding decisions must be made using the best currently available data, it is possible that future estimates of the cost-effectiveness of the nutrition education may differ.
Conclusions
The additional costs of the nutrition education were low as compared with the societal costs of hemodialysis patients. Regarding serum phosphorus, the DD protocol was likely to be cost-effective compared with EP, yet the probability of DD being cost-effective compared with the THD protocol was low. No effect of the DD protocol was noted on QALY; this protocol was, therefore, dominated by the EP and THD protocols. Although our results did not confirm the cost-effectiveness of the intensive nutrition education, a closer look at the low cost of the nutrition education, coupled with the greater decrease in the use of services and costs during the post-implementation phase, would potentially reveal the true added economic value of the DD protocol.
Transparency
Declaration of funding
None reported.
Declaration of financial/other relationships
None reported.
Acknowledgments
None reported.
References
- Roman-Garcia P, Carrillo-Lopez N, Cannata-Andia JB. Pathogenesis of bone and mineral related disorders in chronic kidney disease: Key role of hyperphosphatemia. J Ren Care 2009;35(Suppl):34-8
- Fernandez-Martin JL, Martinez-Camblor P, Dionisi MP, et al. Improvement of mineral and bone metabolism markers is associated with better survival in haemodialysis patients: The COSMOS study. Nephrol Dial Transplant 2015;30:1542-51
- Floege J, Kim J, Ireland E, et al. Serum iPTH, calcium and phosphate, and the risk of mortality in a European haemodialysis population. Nephrol Dial Transplant 2011;26:1948-55
- Tentori F, Blayney MJ, Albert JM, et al. Mortality risk for dialysis patients with different levels of serum calcium, phosphorus, and PTH: The Dialysis Outcomes and Practice Patterns Study (DOPPS). Am J Kidney Dis 2008;52:519-30
- Naves-Diaz M, Passlick-Deetjen J, Guinsburg A, et al. Calcium, phosphorus, PTH and death rates in a large sample of dialysis patients from Latin America. The CORES Study. Nephrol Dial Transplant 2011;26:1938-47
- White DA, Odedina F, Xiao H, et al. The economic burden of end-stage renal disease with hyperphosphatemia. Dis Manag Health Outcomes 2012;14:99-106
- Eknoyan G, Levin A, Levin NW. Bone metabolism and disease in chronic kidney disease. Am J Kidney Dis 2003;42:1-201
- Kidney Disease: Improving Global Outcomes (KDIGO) CKD-MBD Work Group. KDIGO clinical practice guideline for the diagnosis, evaluation, prevention, and treatment of Chronic Kidney Disease-Mineral and Bone Disorder (CKD-MBD). Kidney Int 2009;76(Suppl):1-130
- Port FK. Improving outcomes for dialysis patients in the international Dialysis Outcomes and Practice Patterns Study. Clin J Am Soc Nephrol 2006;1:246-55
- Fernandez-Martin JL, Carrero JJ, Benedik M, et al. COSMOS: The dialysis scenario of CKD-MBD in Europe. Nephrol Dial Transplant 2013;28:1922-35
- Rizk R, Hiligsmann M, Karavetian M, et al. Economic evaluations of interventions to manage hyperphosphataemia in adult haemodialysis patients: A systematic review. Nephrology 2016;21:178-87
- Karavetian M, de Vries N, Rizk R, et al. Dietary educational interventions for management of hyperphosphatemia in hemodialysis patients: A systematic review and meta-analysis. Nutr Rev 2014;72:471-82
- Karavetian M, Abboud S, Elzein H, et al. Nutritional education for management of osteodystrophy (NEMO) trial: Design and patient characteristics, Lebanon. Nutr Res Pract 2014;8:103-11
- Karavetian M, de Vries N, Elzein H, et al. Effect of behavioral stage-based nutrition education on management of osteodystrophy among hemodialysis patients, Lebanon. Patient Educ Couns 2015;98:1116-22
- Karavetian M, Elzein H, Rizk R, et al. Nutritional education for management of osteodystrophy: Impact on serum phosphorus, quality of life, and malnutrition: NEMO: impact on QOL and malnutrition. Hemodial Int 2016;20:432-40
- Rizk R, Karavetian M, Hiligsmann M, et al. Effect of stage-based education provided by dedicated dietitians on hyperphosphataemic haemodialysis patients: results from the Nutrition Education for Management of Osteodystrophy (NEMO) randomised controlled trial. J Hum Nutr Diet 2017. DOI: 10.1111/jhn.12472
- Drummond M, Sculpher M, Torrance G, et al. Methods for the economic evaluation of health care programmes. 3rd ed. Oxford: Oxford University Press; 2005
- Husereau D, Drummond M, Petrou S, et al. Consolidated Health Economic Evaluation Reporting Standards (CHEERS) statement. Cost Eff Resour Alloc 2013;11:6
- Weinstein MC. Recommendations of the panel on cost-effectiveness in health and medicine. JAMA 1996;276:1253-8
- Kalantar-Zadeh K, Kopple JD, Block G, et al. Association among SF36 quality of life measures and nutrition, hospitalization, and mortality in hemodialysis. J Am Soc Nephrol 2001;12:2797-806
- Sabbah I, Drouby N, Sabbah S, et al. Quality of life in rural and urban populations in Lebanon using SF-36 health survey. Health Qual Life Outcomes 2003;1:30
- Rizk R, Hiligsmann M, Karavetian M, et al. A societal cost-of-illness study of hemodialysis in Lebanon. J Med Econ 2016;19:1157-66
- Data Series [Internet]. 2011. Beirut: Banque du Liban. http://www.bdl.gov.lb/statistics/table.php?name¼t5282usd. Accessed October 3, 2016
- Consumer Prices [Internet]. 2016. Paris: Organisation for Economic Cooperation and Development (OECD). http://stats.oecd.org/index.aspx?DatasetCode=MEI_PRICES. Accessed October 3, 2016
- Ministry of Public Health of Lebanon. Lebanon National Drug Index. 4th ed. Beirut: Ministry of Public Health of Lebanon; 2011
- Koopmanschap MA, van Exel NJA, van den Berg B, et al. An overview of methods and applications to value informal care in economic evaluations of healthcare. Pharmacoeconomics 2008;26:269-80
- Luce BR, Elixhauser A. Estimating costs in the economic evaluation of medical technologies. Int J Technol Assess Health Care 1990;6:57-75
- van Mastrigt G, van Asselt T, Kessels F, et al. How to deal with imbalances in baseline utility between treatment groups in quality adjusted life year calculations. G. van Mastrigt [dissertation], Outcome assessment and economic evaluation of short-stay intensive care for coronary artery bypass patients. Maastricht: Maastricht University; 2009:119-35
- Brazier J, Roberts J, Deverill M. The estimation of a preference-based measure of health from the SF-36. J Health Econ 2002;21:271-92
- Grima DT, Bernard MLM, Dunn ES, et al. Cost-effectiveness analysis of therapies for chronic kidney disease patients on dialysis. Pharmacoeconomics 2012;30:981-9
- Lowrie EG, Curtin RB, LePain N, et al. Medical outcomes study short form-36: A consistent and powerful predictor of morbidity and mortality in dialysis patients. Am J Kidney Dis 2003;41:1286-92
- Marseille E, Larson B, Kazi DS, et al. Thresholds for the cost–effectiveness of interventions: Alternative approaches. Bull World Health Organ 2015;93:118-24
- International Monetary Fund, World Economic Outlook Database. 2012. Gross domestic product per capita, current prices (U.S. dollars) [Internet]. Washington: International Monetary Fund – World Economic Outlook. http://www.imf.org/external/pubs/ft/weo/2014/01/weodata/weorept.aspx?pr.x=77&pr.y=10&sy=2012&ey=2019&scsm=1&ssd=1&sort=country&ds=.&br=1&c=446&s=NGDPDPC&grp=0&a=. Accessed October 14, 2016
- NICE. The guidelines manual [Internet]. 2012. London: The National Institute for Health and Care Excellence (NICE). https://www.nice.org.uk/process/pmg6/chapter/assessing-cost-effectiveness. Accessed October 14, 2016
- Neumann PJ, Cohen JT, Weinstein MC. Updating cost-effectiveness—the curious resilience of the $50,000-per-QALY threshold. N Engl J Med 2014;371:796-7
- Pisetkul C, Chanchairujira K, Chotipanvittayakul N, et al. Malnutrition-inflammation score associated with atherosclerosis, inflammation and short-term outcome in hemodialysis patients. J Med Assoc Thai 2010;93(Suppl):147-56
- Kalantar-Zadeh K, Kopple JD, Block G, et al. A malnutrition-inflammation score is correlated with morbidity and mortality in maintenance hemodialysis patients. Am J Kidney Dis 2001;38:1251-63
- Kalantar-Zadeh K, Kopple JD, Humphreys MH, et al. Comparing outcome predictability of markers of malnutrition-inflammation complex syndrome in haemodialysis patients. Nephrol Dial Transplant 2004;19:1507-19
- Rambod M, Bross R, Zitterkoph J, et al. Association of malnutrition-inflammation score with quality of life and mortality in hemodialysis patients: A 5-year prospective cohort study. Am J Kidney Dis 2009;53:298-309
- Qunibi WY. Consequences of hyperphosphatemia in patients with end-stage renal disease (ESRD). Kidney Int 2004;66(Suppl):8-12
- Brennan A, Akehurst R, Davis S, et al. The cost-effectiveness of lanthanum carbonate in the treatment of hyperphosphatemia in patients with end-stage renal disease. Value Health 2007;10:32-41
- van Asselt ADI, van Mastrigt GAPG, Dirksen CD, et al. How to deal with cost differences at baseline. PharmacoEconomics 2009;27:519-28
- Thorn JC, Coast J, Cohen D, et al. Resource-use measurement based on patient recall: Issues and challenges for economic evaluation. Appl Health Econ Health Policy 2013;11:155-61
- Evers S, Goossens M, De Vet H, et al. Criteria list for assessment of methodological quality of economic evaluations: Consensus on Health Economic Criteria. Int J Technol Assess Health Care 2005;21:240-5
- Annual Report – 2012 [Internet]. 2012. Beirut: Lebanese Kidney Registry. http://kidneyregistrylb.com/national-registry-2/annual-report-2012/. Accessed October 16, 2016
- Lacson E, Ikizler TA, Lazarus JM, et al. Potential impact of nutritional intervention on end-stage renal disease hospitalization, death, and treatment costs. J Ren Nutr 2007;17:363-71
- Ebrahimi H, Sadeghi M, Amanpour F, et al. Influence of nutritional education on hemodialysis patients’ knowledge and quality of life. Saudi J Kidney Dis Transplant 2016;27:250-5
- Wiser NA, Shane JM, McGuigan AT, et al. The effects of a group nutrition education program on nutrition knowledge, nutrition status, and quality of life in hemodialysis patients. J Ren Nutr 1997;7:187-93
- Karavetian M, Rizk R. Development and evaluation of continuing education course in renal nutrition. Nutr Res Pract 2016;10:99-107
- Karavetian M, Elzein H, Hwalla N, de Vries N. Dietetic practices in hemodialysis units in Lebanon and their conformity with KDOQI nutrition guidelines. Int J Health Nutr 2013;4:1-8
Appendix 1: Resource utilization questionnaire

Appendix 2: Costing of the nutrition education
Cost components and mean costs per patient of the three protocols (LBP).
The costs gathered and calculated in LBP were converted to US$(1 US$ = 1,507.5 L.L.; year of reference: 2011)Citation23 and uprated to 2015US$using Consumer Price Indices (Index, 2010 = 100)Citation24. The costs of the dietetic interventions for the DD, EP, and THD groups for Phase I and Phase II were as follows: $74.5, $2.2; $2.6, $2.1; and $13.3, $4.2, respectively.
Appendix 3: Flow diagram of the trial
A total of 720 patients participated in the study; 570 of those met the inclusion criteria.
Appendix 4: Cost distribution of the study groups

aDD (dedicated dietitian): 2.5th percentile: $19,799.49; 97.5th percentile: $22,377.03.
bEP (existing practice): 2.5th percentile: $17,556.73; 97.5th percentile: $19,843.65.
cTHD (trained hospital dietitian): 2.5th percentile: $19,325.09; 97.5th percentile: $20,871.02.
Appendix 5: Cost-effectiveness acceptability curves for sensitivity analyses
Cost-effectiveness acceptability curve presenting the probability the protocol is cost-effective (y-axis), with respect to serum phosphorus, given various ceiling ratios for willingness-to-pay (x-axis). Sensitivity analyses performed for complete cases, hemodialysis and transportation costs excluded, hyperphosphatemia at baseline and difference in serum phosphorus as outcome. The ICER was represented in absolute values, given that the beneficial outcome is the decrease in serum phosphorus, resulting in a negative ICER. DD, dedicated dietitian, EP, existing practice; THD, trained hospital dietitian; P, serum phosphorus; HD, hemodialysis; ICER, incremental cost-effectiveness ratio.
Appendix 6: Cost-utility acceptability curves for sensitivity analyses
Cost-utility acceptability curves presenting the probability the protocol is cost-effective (y-axis), with respect to QALY gain, given various ceiling ratios for willingness-to-pay (x-axis). Sensitivity analyses performed for complete cases, hemodialysis, and transportation costs excluded, hyperphosphatemia at baseline and adjusted QALY. DD, dedicated dietitian, EP, existing practice; THD, trained hospital dietitian; P, serum phosphorus; HD, hemodialysis; QALY, quality-adjusted life-year; ICUR, incremental cost-utility ratio.