
Abstract
Aim: To conduct a cost-effectiveness analysis to compare ocrelizumab vs subcutaneous (SC) interferon beta-1a for the treatment of relapsing multiple sclerosis (RMS).
Methods: A Markov cohort model with a 20-year horizon was developed to compare ocrelizumab with SC interferon beta-1a from a US payer perspective. A cohort of patients with relapsing-remitting MS (RRMS) and Expanded Disability Status Scale (EDSS) scores of 0–6, who initiated treatment with ocrelizumab or SC interferon beta-1a, were entered into the model. The model considered 21 health states: EDSS 0–9 in RRMS, EDSS 0–9 in secondary-progressive multiple sclerosis (SPMS), and death. Patients with RRMS could transition across EDSS scores, progress to SPMS, experience relapses, or die. Transition probabilities within RRMS while patients received ocrelizumab or SC interferon beta-1a were based on data from the two SC interferon beta-1a-controlled Phase III OPERA I and OPERA II trials of ocrelizumab in RMS. Transitions within RRMS when off-treatment, RRMS-to-SPMS transitions, transitions within SPMS, and transitions to death were based on the literature. Utilities of health states, disutilities of relapses, costs of therapies, and medical costs associated with health states, relapse, and adverse events were from the literature and publicly available data sources. The model estimated per-patient total costs, incremental cost per life year (LY) gained, and incremental cost per quality-adjusted LY (QALY) gained. Deterministic sensitivity analyses (DSA) and probabilistic sensitivity analysis (PSA) were conducted to evaluate the robustness of the model results.
Results: Ocrelizumab was associated with a cost savings of $63,822 and longer LYs (Δ = 0.046) and QALYs (Δ = 0.556) over a 20-year time horizon. The results of the model were robust in the DSA and PSA.
Limitations: The model did not consider subsequent treatments and their impact on disease progression.
Conclusions: The results suggest that ocrelizumab is more cost-effective than SC interferon beta-1a for the treatment of RMS.
Introduction
Multiple sclerosis (MS) is a chronic, immune-mediated disease of the central nervous system characterized by inflammation, demyelination, and axonal damageCitation1–3. Common symptoms include motor and sensory dysfunction, muscle weakness, fatigue, vision problems, bladder dysfunction, and cognitive impairmentCitation4. Although it can develop at any age, MS is most commonly diagnosed in people aged 20–40 years and affects twice as many women as menCitation3,Citation5. In the US, MS is estimated to affect over 400,000 individuals, and represents the most common cause of long-term neurological disability in young adultsCitation5. Approximately 85% of patients are initially diagnosed with relapsing MS (RMS), a form of MS in which periods of disease activity (relapses) alternate with periods of complete or partial remissionCitation3,Citation5,Citation6. As disease symptoms worsen, a patient’s disability level increases, ranging from experiencing mild difficulty with walking to being wheelchair- or bed-boundCitation2.
The main goal in the management of RMS is to reduce the frequency of relapses and slow disease progressionCitation7. To this end, disease-modifying therapies (DMTs) have long been the mainstay of treatment for MSCitation8. DMTs work by modulating the aberrant immune response underlying MS and include oral, injectable, and infused agentsCitation9. One of the DMTs available for the treatment of RMS is subcutaneous (SC) interferon beta-1aCitation8. Because of its demonstrated efficacy and tolerability, SC interferon beta-1a remains one of the most widely used MS treatments in clinical practiceCitation10,Citation11. A more recent addition to the armamentarium of DMTs for the treatment of MS is ocrelizumab, a humanized monoclonal antibody that selectively targets CD20+ B cells. The safety and efficacy of ocrelizumab were compared with those of SC interferon beta-1a in the two Phase III randomized controlled clinical trials OPERA I and OPERA II, which involved more than 1,600 patients with RMS followed for up to 96 weeksCitation12–15. In the OPERA trials, ocrelizumab was associated with a greater reduction in annual relapse rate (ARR) and 12- and 24-week confirmed disability progression (CDP) compared with SC interferon beta-1a. In addition, the proportion of ocrelizumab-treated patients who experienced adverse events (AEs) was found to be similar to that of SC interferon beta-1a-treated patients. Ocrelizumab was approved by the FDA on March 28, 2017 for the treatment of RMS, as well as primary progressive forms of MSCitation16.
While clinical trial data demonstrate ocrelizumab’s superiority as an effective and well-tolerated treatment for patients with RMS, the cost-effectiveness of ocrelizumab and SC interferon beta-1a has not yet been compared. Accordingly, we conducted a cost-effectiveness analysis (CEA) to evaluate the economic value of ocrelizumab vs SC interferon beta-1a in the treatment of RMS from the perspective of a US Payer.
Methods
Target population and comparators
The model compared the cost-effectiveness of ocrelizumab and SC interferon beta-1a for the treatment of RMS. The target population was adult patients with RMS, as in the OPERA I and OPERA II trials. At the time of entry into the model, patients had an average age of 37 years, were predominantly female (66%), and were distributed across different Expanded Disability Status Scale (EDSS) scores based on the baseline distribution observed in the OPERA trials ()Citation12. Patients were entered into the model in the relapse-remitting MS (RRMS) state of RMS, and could progress to secondary progressive MS (SPMS) of RMS.
Table 1. Model inputs: patient demographics.
Perspective and time horizon
The model presented results from the perspective of a US third party payer. The time horizon was 20 years in the base case. This long time horizon was required to capture the effect of treatment in the case of a chronic disease with no cure like MS. The model had a cycle length of 1 year, consistent with previous MS-related CEA modelsCitation17,Citation18.
Model structure
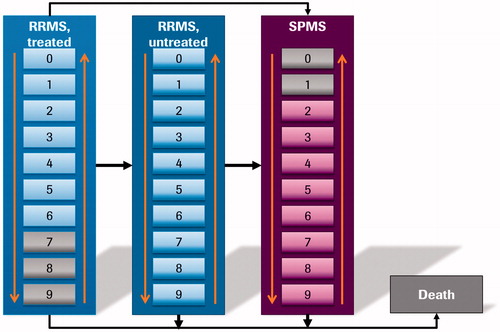
A cohort multi-state Markov model with 21 states was developed in Excel (Microsoft, Redmond, WA) to simulate the disease course of RMS patients receiving treatment with ocrelizumab and SC interferon beta-1a. In particular, the model considered EDSS 0–9 in RRMS (modeled as “RRMS-treated” and “RRMS-untreated” separately), EDSS 0–9 in SPMS, and death. EDSS score is one of the most commonly used tools to measure disease progression in patients with MS, especially in clinical trials. It is a physician-rated scale of neurological disability, ranging from 0 (no disability) to 10 (death due to MS)Citation19, in which disability—and, thus, disease severity—is measured by assessing seven functional systems (pyramidal, cerebellar, sensory, vision, brainstem, bowel and bladder, and mental), as well as ambulationCitation20. Whilst the EDSS scale allows physicians to rate patients using 0.5-point increments, health states were defined here as 1-point increments for modeling purposes, consistent with prior CEAs of MS treatmentsCitation17,Citation18.
Patients with RRMS entered the model in one of the 10 EDSS scores under “RRMS-treated” (i.e. patients with RRMS treated with either ocrelizumab or SC interferon beta-1a), as illustrated in . In each cycle, patients could then: (1) transition between EDSS scores within “RRMS-treated”, as observed in the OPERA I and OPERA II trialsCitation12; (2) discontinue treatment and transition to “RRMS-untreated”; (3) progress to SPMS; or (4) transition to death, as informed by the general population mortality adjusted by EDSS score-specific mortality multipliers. The transition from “RRMS-treated” to “RRMS-untreated” in EDSS scores 0–6 was based on the discontinuation rate due to AEs reported in the OPERA I and OPERA II trialsCitation12. In addition, patients discontinued treatment if they reached an EDSS score ≥7. Following discontinuation, patients switched to “RRMS-untreated” and transitioned within this category, as informed by natural history dataCitation21. The transitions from “RRMS-treated” and “RRMS-untreated” to SPMS and transitions within SPMS were also informed by natural history data. At any point, patients could transition to death, as informed by the general population mortality adjusted by EDSS state-specific mortality multipliers, with no direct treatment effect assumedCitation17,Citation18,Citation22.
Figure 1. Model structure. RRMS, relapsing-remitting multiple sclerosis; SPMS, secondary progressive multiple sclerosis.
Model inputs
Transition probabilities
As patients with RRMS could progress to a higher or lower EDSS score or remain in the same EDSS score, the transition matrix was a 10 by 10 matrix (), with the transition probabilities representing the likelihood of patients moving between EDSS scores over a 1-year time horizon.
The RRMS-to-RRMS transition probabilities between EDSS scores while receiving ocrelizumab and SC interferon beta-1a (i.e. “RRMS-treated”) were extracted from the OPERA I and OPERA II trials. After discontinuing ocrelizumab or SC interferon beta-1a, patients were assumed to no longer receive a DMT and to transition between EDSS scores within RRMS based on the data reported in Palace et al.Citation21, which were derived from 898 untreated RMS patients in the British Columbia Multiple Sclerosis (BCMS) database during the 1980–1995 periodCitation23.
The transition probabilities from RRMS to SPMS were based on those reported in Mauskopf et al.Citation18. They depended on the starting EDSS score in RRMS, but did not vary with treatment. However, the treatment received indirectly impacted the transition to SPMS by influencing the distribution of patients across EDSS scores in RRMS.
The transition probabilities within SPMS were also based on the data reported in Palace et al.Citation21. The analyses in Palace et al.Citation21 were based on a pooled population of patients with RRMS and SPMS who did not receive treatment. When the Palace et al.Citation21 data were applied to RRMS, improvement in EDSS score was allowed; when they were applied to SPMS, improvement in EDSS score was not allowed.
Relapses
The ARRs for ocrelizumab and SC interferon beta-1a in “RRMS-treated” were derived from the OPERA I and OPERA II trialsCitation12. The same relapse rate was assumed for each treatment, regardless of EDSS score, due to limited data availability. Out of all the relapses, 21% were assumed to require hospitalization (hospitalized relapses), based on Goldberg et al.Citation24. The relapse rates by EDSS score in “RRMS-untreated” and SPMS were obtained from the fingolimod National Institute for Health and Care Excellence (NICE) submission ()Citation25.
Table 2. Model inputs: relapses and utilities.
Discontinuation rates of ocrelizumab and SC interferon beta-1a
Based on the OPERA I and OPERA II trials, the annual AE-related discontinuation probability for ocrelizumab was 1.9%, and that for SC interferon beta-1a was 3.3%Citation12, and these were applied while patients were in EDSS scores of 0–6 in “RRMS-treated”. Patients were forced to discontinue treatment once they reached an EDSS score ≥7 in RRMS or transitioned to SPMS.
Safety
Three serious AEs were included in the model (infections and infestations; nervous system disorders; and injury, poisoning, and procedural complications), and their rates were derived from the OPERA I and II trials ()Citation12.
Table 3. Safety inputs.
Mortality
The mortality rates in RRMS and SPMS were estimated based on the mortality rates of the general population adjusted by the standard mortality ratio (SMR) of MS patients reported in the literature. The mortality rates of the general population, stratified by age and gender, were obtained from the Center for Disease Control and Prevention (CDC)Citation22. The SMRs for RRMS and SPMS stratified by EDSS score were derived from the fingolimod NICE submission ()Citation25.
Utilities
The utilities by EDSS scores in RRMS and SPMS were derived from Orme et al.Citation26. The SPMS utility decrement, compared to RRMS in the same EDSS score, was 0.045 Citation26. Disutility for a non-hospitalized relapse was 0.07, and disutility for a hospitalized relapse was 0.24 ()Citation26,Citation27. Each relapse was assumed to last 1.51 months, as reported in Gani et al.Citation28.
Costs
Treatment costs. Treatment costs included drug costs, administration costs, and monitoring costs (). All costs were either based on 2016 US dollars (USD) or inflated to 2016 USD using the Medical Care component of the Consumer Price Index (CPI)Citation29.
Table 4. Model inputs: costs.
Drug costs. Drug costs were calculated using the dosing schedules and unit costs. The dosing schedule of SC interferon beta-1a was based on the product label (8.8 mcg 3-times per week for weeks 1–2; 22 mcg 3-times per week for weeks 3–4; and 44 mcg 3-times per week for subsequent weeks)Citation30. The dosing schedule of ocrelizumab was based on the OPERA I and OPERA II trials (two 300 mg infusions at days 1 and 15, followed by a 600 mg infusion every 24 weeks)Citation12. The Wholesale Acquisition Cost (WAC) of ocrelizumab and SC interferon beta-1a were obtained from The Micromedex Red Book Online (Thomson)Citation31. The cost of 600 mg of ocrelizumab was $32,500. The unit cost of SC interferon beta-1a for 8.8 mcg or 22 mcg was $35.87 per mg; for 44 mcg, the unit cost was $12.56 per mg. Assuming patients are 100% adherent to the dosing schedules specified above, the annual cost of SC interferon beta-1a was calculated to be $86,179, and the annual cost of ocrelizumab was $65,000 ().
Administration costs. For ocrelizumab, the administration cost per year was calculated based on the number of infusions per year (from the OPERA I and II trials), duration of infusion (2.5 h for the initial two doses of 300 mg and 3.5 h for subsequent doses of 600 mg), and cost per infusion. The cost per infusion was derived from the Center for Medicare & Medicaid Services (CMS) Physician Fee Schedule (Current Procedural Terminology [CPT] codes: 96365, 96366)Citation32 (). For the first year, the administration cost of ocrelizumab was $313.85; for the following years, the annual administration cost was $234.54 ().
The model assumed 1-h of nursing costs each year to discuss with or train patients and/or caregivers in the proper injection technique for SC interferon beta-1a. The cost of nurse time was derived from the CMS Physician Fee Schedule for nurse visits (CPT code: 99211)Citation32. The resulting annual administration cost for SC interferon beta-1a was $20.05 ().
Monitoring costs. In the case of ocrelizumab, the model assumed that no additional monitoring was needed (). In the case of SC interferon beta-1a, as indicated in the product label, complete blood count and liver function tests are recommended at 1, 3, and 6 months following therapy initiation, and periodically afterwardsCitation30. Accordingly, the model assumed both complete blood count and liver function tests 3-times during the first year and once per year in the following years. Cost per service of a complete blood count (Healthcare Common Procedure Coding System [HCPCS] codes: 85025, 85027) and liver function test (HCPCS code: 80076) were $9.70 and $11.13, respectively, per CMS Clinical Diagnostic Laboratory ScheduleCitation32. The resulting annual monitoring costs for SC interferon beta-1a were $62.49 for the first year and $20.83 for each following year ().
AE-related costs. Costs of infections and infestations were based on the costs of influenza, lower respiratory tract infections, and urinary tract infections from Mauskopf et al.Citation18, and inflated to 2016 USD using the Medical Care component of the CPI ()Citation29. Costs of nervous system disorders and injury, poisoning, and procedural complications were based on costs reported in the 2013 Healthcare Cost and Utilization Project (HCUP) Nationwide Inpatient Sample (NIS)Citation33, and inflated to 2016 USD using the Medical Care component of the CPI ()Citation29.
Disease state costs by EDSS score. Direct health state costs in the base case by EDSS scores were obtained from Kobelt et al.Citation34 and inflated to 2016 USD using the Medical Care component of the CPICitation29 (). The direct costs include inpatient costs, costs of ambulatory care, and costs of lab tests.
Relapse costs. The cost of a non-hospitalized relapse was $1,890, and that of a hospitalized relapse was $20,661, based on the costs reported in O’Brien et al.Citation35 and inflated to 2016 USD using the Medical Care component of the CPI ()Citation29.
Model assumptions
Treatment effects. Patients were assumed to adhere 100% to treatment (i.e. receiving treatment based on the recommended dosing schedule) before discontinuation. In addition, treatment effects were assumed to remain constant over time without considering waning effects. The transition probabilities of ocrelizumab and SC interferon beta-1a were estimated from the OPERA I and II trials, and were applied to the entire period patients received treatment.
Discontinuation of ocrelizumab and SC interferon beta-1a. The model assumed a constant annual discontinuation rate of ocrelizumab (1.9%) and SC interferon beta-1a (3.3%) due to AEs for patients with RRMS with EDSS scores 0–6, as observed in the OPERA I and II trials. Additionally, all patients were assumed to discontinue treatment when they reached EDSS score ≥7 or transitioned to SPMS. The model did not consider any subsequent DMT.
Transitions from RRMS to SPMS. Transition from RRMS to SPMS only depended on the EDSS scores in RRMS, and did not vary with treatment received. Patients transitioning from RRMS to SPMS were assumed to progress by one EDSS score, with the exception that EDSS score 9 in RRMS transitioned to EDSS score 9 in SPMS.
Relapse rates. Treatment was assumed to impact relapse rate. The same relapse rate, estimated using the OPERA I and II trial data, was assumed for all EDSS scores for patients on ocrelizumab and SC interferon beta-1a, since relapses were not reported by EDSS score in the trials. Following treatment discontinuation, natural history data were used to inform the relapse rate at each EDSS score. In addition, the percentage of hospitalized relapses among all relapses was assumed to be the same, regardless of treatments received.
Model outputs
Total direct costs, clinical outcomes, and incremental cost-effectiveness ratios (ICERs) comparing ocrelizumab and SC interferon beta-1a were reported. Total direct costs comprised drug acquisition and administration costs, monitoring costs, AE-related costs, disease state costs by EDSS score, and relapse-associated costs. Clinical outcomes included life years (LYs) and quality-adjusted life years (QALYs). ICERs included incremental costs per LY gained and incremental costs per QALY gained. Cost and effectiveness measures were discounted at 3.0% per yearCitation36. A half cycle correction was applied.
Deterministic sensitivity analyses (DSA)
Deterministic sensitivity analyses (DSA) were performed to determine the impact of individual model parameter inputs on the model results. The parameters tested in the DSA included time horizon, drug costs, discontinuation rate, disease state costs by EDSS score, relapse rate, and the inclusion of subsequent DMT costs.
Probabilistic sensitivity analyses (PSA)
Key variables used in the model were included in the probabilistic sensitivity analysis (PSA), and the inputs for these variables were drawn randomly and simultaneously based on specified distributions to calculate a corresponding ICER value. Direct costs by EDSS scores, costs of non-hospitalized and hospitalized relapses, and drug costs were varied based on Gamma distributions. ARRs for ocrelizumab and SC interferon beta-1a were varied based on Normal distributions. Discontinuation rates for each drug, utility of RRMS and SPMS by EDSS state, disutility of relapse, as well as RRMS to RRMS transition probabilities while receiving ocrelizumab and SC interferon beta-1a were varied based on Beta distributions. The process was repeated 5,000 times. The results of the PSA were expressed in a cost-effectiveness plane and cost-effectiveness acceptability curve.
Results
Base case
In the base case, ocrelizumab dominated SC interferon beta-1a in cost per LY gained and cost per QALY gained (), suggesting that ocrelizumab was associated with lower total costs and better outcomes compared to SC interferon beta-1a. The discounted LYs (14.557 vs 14.511) and QALYs (6.826 vs 6.270) for ocrelizumab were higher than SC interferon beta-1a. In addition, ocrelizumab had lower total costs per patient compared to SC interferon beta-1a ($614,519 vs $678,341), with an estimated cost saving of $63,822 over the 20-year time horizon (). Ocrelizumab was associated with lower total drug costs ($423,573 vs $472,633), higher administration costs ($1,595 vs $110), lower monitoring costs ($0 vs $148), lower AE-related costs ($1,123 vs $1,608), lower EDSS disease state costs ($160,786 vs $170,308), and lower relapse costs ($27,422 vs $33,534) compared to SC interferon beta-1a ().
Table 5. Base-case results.
DSA
Ocrelizumab remained dominant over SC interferon beta-1a when the time horizons were switched to 5 years, or lifetime. In other scenarios, ocrelizumab remained dominant, except when the drug cost of ocrelizumab was increased by 25% or when the cost of SC interferon beta-1a was discounted by 15% or 25%. In addition, when all-cause discontinuation rates instead of AE-related discontinuation rates were considered, the ICER was $7,561. Notably, in all the scenarios considered in the model, the ICER was less than $150,000 per QALY gained ().
Table 6. DSA results.
PSA
The probability of ocrelizumab being cost-effective was 96.9% at a willingness-to-pay (WTP) threshold of $100,000 per QALY gained, and increased to 98.9% at a WTP of $150,000. In 84.5% of the cases, ocrelizumab dominated SC interferon beta-1a ().
Figure 2. Probabilistic sensitivity analyses (PSA). WTP, willingness-to-pay; QALY, quality adjusted life year.

Discussion
As the number of treatment options with different mechanism of action for MS expands, and the chronic nature of the disease warrants a prolonged treatment course, it becomes crucially important to assess both the clinical and economic value of existing treatments. Ocrelizumab, an anti-CD20 monoclonal antibody, has demonstrated clinical superiority compared with SC interferon beta-1a in two Phase III trials, OPERA I and OPERA II, in RMSCitation37. Here, using model inputs from the OPERA trials and the literature or other publicly available data, we conducted a CEA of ocrelizumab vs SC interferon beta-1a in RMS.
The results of the base-case analysis showed that ocrelizumab dominated SC interferon beta-1a, both in terms of cost per LY gained and cost per QALY gained, suggesting that ocrelizumab is associated with lower total costs and better clinical outcomes, compared to SC interferon beta-1a among patients with RMS. In particular, over the 20-year time horizon, the per-patient costs savings associated with ocrelizumab were estimated to be $63,822. Results were robust in DSA and PSA, as ocrelizumab remained dominant over SC interferon beta-1a in the majority of case scenarios. In the DSA, the only exceptions were observed when the cost of ocrelizumab was increased, SC interferon beta-1a was considerably discounted, or discontinuation rates were based on all-cause discontinuation instead of AE-related discontinuation.
While cost-effectiveness models comparing several DMTs have been developed in the pastCitation17,Citation18,Citation24,Citation38–41, to the best of our knowledge, this is the first time that the relative economic value of ocrelizumab and SC interferon beta-1a has been assessed. The finding that ocrelizumab is a cost-effective treatment for RRMS compared with the widely used SC interferon beta-1a is distinctly relevant to payers, policy-makers, physicians, and patients alike, especially in light of the March 2017 approval of ocrelizumab. A better understanding of the economic impact of available treatments is especially important in the case of a lifelong disease with a substantial economic burden like MS. Indeed, the average all-cause healthcare costs per MS patient per year have been estimated to range from $17,545 in the absence of relapses to $41,969 in the presence of relapses (in 2011 US dollars)Citation42. As the severity of relapses increases, so do medical costs. The adjusted incremental annual cost of low-to-moderate severity relapses was $8,269 per patient, compared to no relapse; the incremental value increased to $24,180 when comparing patients who had high severity relapses with those who had no relapsesCitation42. This high financial burden highlights a pressing need for cost-effective treatments. Besides relapses, increasing levels of functional disability have also been associated with higher healthcare costs and resource utilizationCitation34. In this scenario, treatments that can limit the number of relapses and slow disease and disability progression, while minimizing direct and indirect costs, are urgently needed. Given its superiority over SC interferon beta-1a in terms of reduction in relapse rate and disability level—as shown in the OPERA I and OPERA II trials—and lower annual drug costs, ocrelizumab dominated SC interferon beta-1a in the current model. Future studies comparing ocrelizumab and other available treatments for RMS are warranted to better characterize its clinical and economic value and further define its role in the management of RMS.
The results of this cost-effectiveness model should be interpreted in light of some limitations. First, the current model did not consider subsequent therapies in the base-case following discontinuation of ocrelizumab and SC interferon beta-1a. Second, an inherent limitation of Markov models is that they are memory-less, which means that all the patients who are in a particular health state have the same probability of transitioning, regardless of their treatment or disease history. This may be different in real-world clinical practice, where a patient’s history may influence disease progression or therapeutic choices. Nevertheless, since this issue likely applies to both ocrelizumab- and SC interferon beta-1a-treated patients, it is not expected to bias the model results. Third, the model used data from the BCMS database from 1980–1995 to inform the transition between EDSS scores within RRMS among untreated patients. While these data might be outdated, to the best of our knowledge, there are no recent long-term natural history data for untreated patients, since the number of available treatment options has increased dramatically over the past two decades. Furthermore, in the model, disease progression was defined using the EDSS score; while this score is widely used in clinical trials, it is less commonly used in clinical practice, where disease progression may be measured differently. Lastly, in the base case, the model applied the transition probabilities observed in the OPERA I and II trials to the entire period that patients were on therapy. Given that the two trials only had 96 weeks of follow-up, uncertainties arising from this approach should be considered when evaluating the model results.
Conclusions
The clinical superiority of ocrelizumab compared to SC interferon beta-1a, a widely used treatment for RMS, has previously been demonstrated in randomized controlled trials. Results of the current analysis demonstrated ocrelizumab’s economic value as a cost-effective treatment compared to SC interferon beta-1a. In particular, ocrelizumab was associated with better clinical benefits and lower costs than SC interferon beta-1a.
Transparency
Declaration of funding
This work was funded by Genentech, Inc.
Declaration of financial/other relationships
EM and NPT are employees of Genentech, Inc. HY, ED, AG, and RF are employees of Analysis Group, Inc., which has received consultancy fees from Genentech, Inc.
Appendices
Download MS Word (58.5 KB)Acknowledgments
Medical writing assistance was provided by Cinzia Metallo, PhD, an employee of Analysis Group, Inc.
References
- Ciccarelli O, Barkhof F, Bodini B, et al. Pathogenesis of multiple sclerosis: insights from molecular and metabolic imaging. Lancet Neurol 2014;13:807-22
- Compston A, Coles A. Multiple sclerosis. Lancet 2008;372:1502-17
- Ransohoff RM, Hafler DA, Lucchinetti CF. Multiple sclerosis—a quiet revolution. Nat Rev Neurol 2015;11:134-42
- National Multiple Sclerosis Society [Internet]. MS symptoms. 2016. http://www.nationalmssociety.org/Symptoms-Diagnosis/MS-Symptoms. Accessed October 2016
- HealthLine [Internet]. Multiple sclerosis by the numbers: facts, statistics, and you. 2015. http://www.healthline.com/health/multiple-sclerosis/facts-statistics-infographic. Accessed October 2016
- Murray TJ. Diagnosis and treatment of multiple sclerosis. BMJ 2006;332:525-7
- Fox EJ, Rhoades RW. New treatments and treatment goals for patients with relapsing-remitting multiple sclerosis. Curr Opin Neurol 2012;25(Suppl):S11-S9
- Tanasescu R, Ionete C, Chou IJ, et al. Advances in the treatment of relapsing-remitting multiple sclerosis. Biomed J 2014;37:41-9
- Straus Farber R, Harel A, Lublin F. Novel agents for relapsing forms of multiple sclerosis. Annu Rev Med 2016;67:309-21
- Limmroth V, Putzki N, Kachuck NJ. The interferon beta therapies for treatment of relapsing–remitting multiple sclerosis: are they equally efficacious? A comparative review of open-label studies evaluating the efficacy, safety, or dosing of different interferon beta formulations alone or in combination. Therap Adv Neurol Disord 2011;4:281-96
- Bergvall N, Petrilla AA, Karkare SU, et al. Persistence with and adherence to fingolimod compared with other disease-modifying therapies for the treatment of multiple sclerosis: a retrospective US claims database analysis. J Med Econ 2014;17:696-707
- Mahler K. Roche investor science conference call. ECTRIMS 2015. http://www.roche.com/dam/jcr:ac2ce818-e143-4f8a-b909-6961553b8bbb/en/irp151012.pdf. Accessed 17 July 2017
- Medscape [Internet]. First data from ocrelizumab phase 3 studies in MS. 2015. http://www.medscape.com/viewarticle/852408. 2015. Accessed October 2016
- Medscape [Internet]. More positive results for ocrelizumab in relapsing MS. 2016. http://www.medscape.com/viewarticle/862648. 2016. Accessed October 2016
- Hauser SL, Bar-Or A, Comi G, et al. Ocrelizumab versus interferon beta-1a in relapsing multiple sclerosis. N Engl J Med 2017;376:221-34
- FDA [Internet]. Ocrelizumab product label. 2017. https://www.accessdata.fda.gov/drugsatfda_docs/label/2017/761053lbl.pdf. Accessed April 2017
- Hernandez L, Guo S, Kinter E, et al. Cost-effectiveness analysis of peginterferon beta-1a compared with interferon beta-1a and glatiramer acetate in the treatment of relapsing-remitting multiple sclerosis in the United States. J Med Econ 2016;19:684-95
- Mauskopf J, Fay M, Iyer R, et al. Cost-effectiveness of delayed-release dimethyl fumarate for the treatment of relapsing forms of multiple sclerosis in the United States. J Med Econ 2016;19:432-42
- National Multiple Sclerosis Society [Internet]. Kurtzke expanded disability status scale (EDSS) form. 2016. http://www.nationalmssociety.org/NationalMSSociety/media/MSNationalFiles/Brochures/10-2-3-29-EDSS_Form.pdf. Accessed October 2016
- Kurtzke JF. Rating neurologic impairment in multiple sclerosis: an expanded disability status scale. Neurology 1983:33:11444-52
- Palace J, Bregenzer T, Tremlett H, et al. UK multiple sclerosis risk-sharing scheme: a new natural history dataset and an improved Markov model. BMJ Open 2014;4:e004073
- Kochanek KD, Murphy SL, Xu J, et al. Deaths: final data for 2014. Natl Vital Stat Rep 2016;65:1-122
- Scalfari A. The natural history of multiple sclerosis, a geographically based study 10: relapses and long-term disability. Brain 2010;133:1914-29
- Goldberg L, Edwards NC, Fincher C, et al. Comparing the cost-effectiveness of disease-modifying drugs for the first-line treatment of relapsing-remitting multiple sclerosis. J Manag Care Pharm 2009;15:543-55
- National Institute for Health and Clinical Excellence. Single technology appraisal (STA): Fingolimod for the treatment of relapsing-remitting multiple sclerosis in adults. NICE Technology Appraisal Guidance 127; 2011
- Orme M, Kerrigan J, Tyas D, et al. The effect of disease, functional status, and relapses on the utility of people with multiple sclerosis in the UK. Value Health 2007;10:54-60
- National Institute for Health and Clinical Excellence [Internet]. Alemtuzumab for treating relapsing?remitting multiple sclerosis. 2014. https://www.nice.org.uk/guidance/ta312/documents/multiple-sclerosis-relapsingremitting-alemtuzumab-fad-document2. Accessed July 2017
- Gani R, Giovannoni G, Bates D, et al. Cost-effectiveness analyses of natalizumab (Tysabri®) compared with other disease-modifying therapies for people with highly active relapsing-remitting multiple sclerosis in the UK. Pharmacoeconomics 2008;26:617-27
- Bureau of Labor Statistics [Internet]. Consumer price index – all urban consumers. 2016. http://data.bls.gov/cgi-bin/surveymost. Accessed October 2016
- FDA [Internet]. Rebif product label. 1996. http://www.accessdata.fda.gov/drugsatfda_docs/label/2003/ifnbser050203LB.pdf. Accessed October 2016
- Micromedex Solutions [Internet]. Red Book Online. 2017. http://www.micromedexsolutions.com/micromedex2/librarian. Accessed April 2017
- Centers for Medicare & Medicaid Services [Internet]. Clinical laboratory fee schedule. 2016. https://www.cms.gov/Medicare/Medicare-fee-for-service-Payment/clinicallabfeesched/index.html. Accessed October 2016
- U.S. Department of Health & Human Services [Internet]. Weighted national estimates from HCUP Nationwide Inpatient Sample (NIS). 2013. http://hcupnet.ahrq.gov/HCUPnet.jsp. Accessed October 2016
- Kobelt G, Berg J, Atherly D, et al. Costs and quality of life in multiple sclerosis a cross-sectional study in the United States. Neurology 2006;66:1696-702
- O’Brien JA, Ward AJ, Patrick AR, et al. Cost of managing an episode of relapse in multiple sclerosis in the United States. BMC Health Serv Res 2003;3:1
- Lipscomb J, Weinstein MC, Torrance GW. United States public health service panel on cost-effectiveness in health and medicine. Time preference. In: Gold M, Siegel J, Russell LB, et al., editors. Cost-effectiveness in health and medicine. New York: Oxford; 1996;214-238
- Genentech [Internet]. FDA grants priority review for Genentech’s OCREVUS™ (Ocrelizumab) biologics license application. 2016. https://www.gene.com/media/press-releases/14631/2016-06-27/fda-grants-priority-review-for-genentech. Accessed October 2016
- O’Day K, Meyer K, Miller RM, et al. Cost-effectiveness of natalizumab versus fingolimod for the treatment of relapsing multiple sclerosis. J Med Econ 2011;14:617-27
- Su W, Kansal A, Vicente C, et al. The cost-effectiveness of delayed-release dimethyl fumarate for the treatment of relapsing-remitting multiple sclerosis in Canada. J Med Econ 2016;19:718-27
- Chiao E, Meyer K. Cost effectiveness and budget impact of natalizumab in patients with relapsing multiple sclerosis. Curr Med Res Opin 2009;25:1445-54
- Bell C, Graham J, Earnshaw S, et al. Cost-effectiveness of four immunomodulatory therapies for relapsing-remitting multiple sclerosis: a Markov model based on long-term clinical data. J Manag Care Pharm 2007;13:245-61
- Parise H, Laliberte F, Lefebvre P, et al. Direct and indirect cost burden associated with multiple sclerosis relapses: excess costs of persons with MS and their spouse caregivers. J Neurol Sci 2013;330:71-7
Appendix
Table A1. Model inputs: transition probabilities.
Table A2. Model inputs: mortality.