
Abstract
Aim: Disease-modifying therapies (DMTs) impact the natural history of relapsing forms of multiple sclerosis (RRMS) by reducing annual relapse rates and slowing disability progression. The effect of DMTs on indirect costs has not been consistently explored in cost-effectiveness studies thus far. The value to patients of an emerging DMT, ocrelizumab, was quantified in comparison to subcutaneous interferon beta-1a (IFNβSC) for the prevalent RRMS population with mild-to-moderate disability in the US, based on two Phase 3 trials, OPERA I and OPERA II, of ocrelizumab vs IFNβSC in RRMS.
Materials and methods: A Markov model was developed to compare disability progression as measured by Expanded Disability Status Scale (EDSS) and relapse outcomes over a 30-year horizon for ocrelizumab vs IFNβSC. Direct, indirect, and informal costs (2016 US dollars) and utilities for EDSS health states were obtained from the literature. Hazard ratios for disability progression and relapse rates were estimated from clinical trials. Value was assessed by calculating the net monetary benefit (NMB), defined as the monetary value of discounted quality-adjusted life years (QALYs) minus total costs, where the value of a QALY was $150,000. One-way sensitivity analyses were conducted.
Results: Ocrelizumab was associated with an incremental gain of 0.84 QALYs and cost savings of $287,713 relative to IFNβSC, resulting in an incremental NMB (INMB) of $413,611 per person over 30 years. The INMB increased by $151,763 for those initiating ocrelizumab at EDSS level 1 vs level 4. Influential parameters were QALY value, treatment costs, and disability progression; however, all sensitivity analyses indicated that the INMB for ocrelizumab relative to IFNβSC was ≥$300,000 per person.
Conclusions: Ocrelizumab provides greater value to RRMS patients compared with IFNβSC. Initiating ocrelizumab at lower EDSS levels leads to a greater cumulative value due to slower disability progression, which extends years with higher quality-of-life.
Introduction
Multiple sclerosis (MS) currently affects over 570,000 individuals in the US, and is the leading cause of non-traumatic neurological disability among young adultsCitation1. Those with MS experience a lifetime of progressive disability, due to an immune-mediated chronic inflammatory and neurodegenerative process primarily affecting the central nervous systemCitation2,Citation3. Over 80% of newly-diagnosed patients have either relapsing-remitting MS (RRMS) or secondary progressive MS, characterized by distinct periods of increased disease activity with partial or full recoveryCitation4,Citation5. The remainder of incident cases are classified as primary progressive MS, a gradual worsening of disease without a relapse-recovery patternCitation6. MS patients experience diminished social and physical functioning and a lowered quality-of-life, due to debilitating symptoms, including fatigue, pain, and mobility and sensory problemsCitation7–9. The majority of non-medical care received by MS patients is provided by informal or unpaid caregivers, who are typically family membersCitation10. Thus, patients and their caregivers incur extremely high direct and indirect costs related to MS, with most of the financial burden related to diminished earnings for the patient and caregiverCitation1,Citation7,Citation11,Citation12.
Disease-modifying therapy (DMT) impacts the natural history of MS by reducing annual relapse rates, decelerating disease progression, and maintaining quality-of-life in MS patientsCitation13–15. The number of available treatments for RRMS has doubled in recent years, and randomized controlled trials (RCTs) are ongoing for several new therapiesCitation16. As a result, many patients are receiving treatment, of which the majority are utilizing injectable DMTsCitation17. Evaluation of cost-effectiveness from the payer perspective for several injectable DMTs was conducted by Goldberg et al.Citation18. In a head-to-head comparison of injectable DMTs, interferon β-1a SC was superior to the alternative interferons (β-1a intramuscular (IM), β-1b) and glatiramer acetate over a 2-year time horizon. In addition, other studies have demonstrated that interferon β-1a SC is the most cost effective DMTCitation18–20. However, studies have not consistently explored the impact of treatments on indirect costsCitation21, which is critical to consider in the context of disability progression, since clinical efficacy may lead to productivity gains and reduced informal care over the longer termCitation19,Citation22.
RCTs evaluating an emerging DMT, ocrelizumab, have shown a statistically significant reduction in annualized relapse rates and reduced risk for disability progression compared with interferon β-1a SC over 96 weeks in patients with RRMSCitation23. Given the clinical efficacy demonstrated by ocrelizumab over interferon β-1a SC in the OPERA trials, an analysis of the relative value provided by ocrelizumab is warranted. The objective of this study was to conduct an economic analysis that quantifies the value of ocrelizumab compared with interferon β-1a SC for the prevalent population of patients with RRMS with mild-to-moderate disability in the US.
Methods
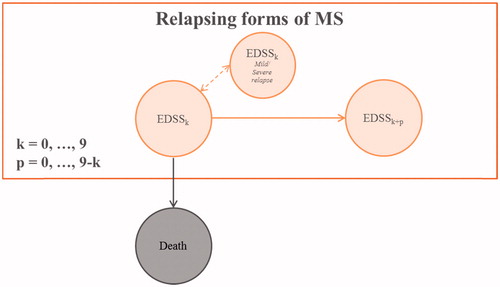
A Markov cohort model was developed to quantify components of value over a 30-year time horizon utilizing treatment efficacies from the OPERA trialsCitation23 and costs and utilities inputs from the literature. A 30-year time horizon was selected to reflect the chronicity of RRMS and the expectation of long-term treatment. The longer time horizon is similar to previous studies evaluating the cost-effectiveness of DMTs from the societal perspectiveCitation19,Citation22. The course of the disease was modeled over 10 total health states and death, based on the Kurtzke Expanded Disability Status Scale (EDSS), an assessment of disability in MS that rates patients on a scale of 0 (no disability) to 9 (bedridden)Citation24. Clinical course was measured as confirmed disability progression (CDP) over a 12-week period, defined as an increase of at least one point in EDSS for patients with baseline EDSS ≤5.5 and an increase of a half-point or more for patients with baseline EDSS >5.5Citation23. The cohort transitions in yearly cycles, in which patients can remain in the same EDSS health state, experience mild/moderate or severe relapse, and remain in the same EDSS health state, progress to a worse health state (higher EDSS), or die. A simplified structure of the Markov model is depicted in .
Figure 1. Simplified schematic of Markov model.
Transition probabilities
The annual probabilities for disability progression without treatment were obtained from a study using natural history data, based on observed EDSS levels in the British Columbia Multiple Sclerosis (BCMS) database from 1980–1995Citation25. It is of note that the BCMS data were used, rather than the commonly used cohort of MS patients from London, Ontario (Canada). The primary reason for not using the London, Ontario dataset is that it retrospectively smoothes EDSS values, which reduces the rate of disability progression and under-estimates observed treatment effects. Additional limitations of the London, Ontario data are that it covers an older time period and contains a smaller cohortCitation25,Citation26. Natural history relapse rates were estimated by combining data from the UK MS SurveyCitation27,Citation28 with a model from a long-term longitudinal study correlating time since diagnosis and relapse ratesCitation29. Probability of death was modeled by updating annual mortality probabilities during each cycle. Baseline age and gender mortality rates were taken from US Life TablesCitation30 and adjusted by EDSS levels using the mortality rates derived in Cutter et al.Citation31. We did not allow patients to improve in their disability status. While there exists some evidence that patients have demonstrated improvements in disability in the short-term outcomes, there is less evidence that such improvements occur in long-term data. For this reason, we follow prior models that exclude the ability to improve disease stateCitation19,Citation21,Citation32.
Treatment response
Two treatment scenarios were compared: interferon β-1a SC and ocrelizumab. We assumed that patients do not switch therapies over the time horizon, that both therapies have an equal safety profile, and that treatment commences at cycle 1 and continues for the duration of the model. Treatment response parameters for relapse rates and disability progression were obtained from clinical trials dataCitation23,Citation33. In order to simulate the effects of treatment on disease progression and relapse rates, we adjusted transition probabilities from the natural history cohort using clinical trial data. For interferon β-1a SC, the treatment response was calculated based on a pivotal trial for interferon β-1a SC vs placeboCitation33 and the natural history cohort. Specifically, the annualized relapse rates (ARR) for interferon β-1a SC vs placebo were applied to the natural history relapse rates, and the hazard ratio (HR) for CDP was applied to the natural history disability progression probability matrix. To estimate the treatment response for ocrelizumab, we utilized the comparative efficacy for ocrelizumab vs interferon β-1a SC as observed in the OPERA trials. The reductions in ARRs observed in the OPERA trials were applied to the relapse probabilities that were previously calculated for interferon β-1a SC treatment. Likewise, to estimate disability progression with ocrelizumab treatment, the disability progression matrix reflecting interferon β-1a SC treatment was adjusted with the HR for CDP resulting from ocrelizumab treatment in the OPERA trialsCitation23. The treatment effects on disease progression and relapse probabilities for interferon β-1a SC vs placebo and ocrelizumab vs interferon β-1a SC are listed in .
Table 1. Parameters used in the base case model and ranges for the sensitivity analysis.
Cohort characteristics
The characteristics of the cohort reflect the prevalent MS population in the US with mild or moderate disability (defined as EDSS 0–6). The prevalent population was estimated by using the age- and sex-specific prevalence rates in a large representative administrative claims database in the US between 2008–2012Citation34, multiplied by the distribution of age and sex from the US Census BureauCitation35. The starting distribution of EDSS level for the population was adapted from the North American Research Committee on Multiple Sclerosis (NARCOMS) cohort using the observed proportions of Patient Determined Disease Steps (PDDS) scores across age groupsCitation36. The PDDS and EDSS are highly correlated at ρ = 0.78 (95% CI = 0.69–0.85)Citation37; thus, we assumed the same distribution for the initial EDSS health states in the cohort. The population in the model was truncated above EDSS 6, since the objective was to utilize the range of EDSS scores observed at baseline in the OPERA trials. The estimated total number of patients with mild-to-moderate disability in the US was 311,659, with an average age of 42 years, and 76% female. The initial distribution of EDSS in the cohort was 17.6%, 6.3%, 6.3%, 10.2%, 18.9%, 16.8%, and 23.8%, for EDSS 0–6, respectively.
Cost and utility parameters
Each EDSS state was associated with a cost and utility, whilst relapses were associated with a cost and disutility, depending on severity (mild/moderate or severe). Measurement of direct costs, indirect costs, informal costs, and utilities by groups of EDSS level were obtained from a cross-sectional study of MS patients in the US, as described in Kobelt et al.Citation22. Briefly, direct costs included inpatient and outpatient admissions, office visits to physicians and other health professionals, examinations, medications (non-DMT prescription drugs, over-the-counter medicines), medical devices, and alterations to the house and servicesCitation22. Productivity losses were based on MS-related short-term absences at work, changes in working situation leading to reduction in income, and early retirement due to MSCitation22. Indirect costs were calculated by using the national average hourly salary, plus an average rate of 30% for employer’s costs. Informal care costs were estimated to be 65% of the average net incomeCitation22. Finally, utilities were measured using the EuroQol five dimensions, three levels questionnaire (EQ-5D-3L). Direct, indirect, informal care costs, and disutilities by categories of relapse severity were obtained from the literatureCitation38–40. Treatment cost for interferon β-1a SC was obtained from the annual wholesale acquisition cost published in Red Book, 2016 editionCitation41. The annual cost of treatment with ocrelizumab was obtained from the manufacturer (Genentech). All costs were inflated to 2016 US$values using the consumer price indexCitation42. A complete listing of the input parameters utilized in the model is presented in .
Analysis
Model outcomes were total costs and quality-adjusted life years (QALYs). Model outcomes across all model cycles were summed across age–gender cohorts for each modeled scenario (i.e. interferon β-1a SC or ocrelizumab). Both QALYs and costs were discounted at a 3% annual rate. We quantified the value of ocrelizumab by calculating the incremental net monetary benefit (INMB), defined as the monetary value of QALY gains minus the aggregate direct, indirect, informal, and treatment costs relative to interferon β-1a SC. A life-year was valued at $150,000, which is consistent with other studies in the literatureCitation43–50. Sensitivity analysis included evaluating the INMB at various time horizons (e.g. 5-year increments) and by starting EDSS level. One-way sensitivity analyses were conducted to evaluate the parameters that had the largest impact on the results. Ranges for the parameters used in the one-way sensitivity analysis are given in .
Results
Using our base case assumptions, treatment with interferon β-1a SC was associated with 10.46 discounted QALYs per person, and total costs were $1,874,266 over the 30-year period (). Over the 30-year period, ocrelizumab treatment was associated with a reduced number of relapses and slower disability progression, which translated into a 0.84 QALY gain and total cost-savings of $287,713 per person over the 30-year period compared to interferon β-1a SC (). Cost-savings were distributed across all cost categories; the reductions in cost relative to interferon β-1a SC were 23.7% for informal care, 22.9% for direct costs, 17.2% for treatment costs, and 1% for indirect costs. Overall, the proportions of total cost savings attributed to ocrelizumab were treatment costs (73.4%), direct costs (15.4%), informal care costs (9.9%), and indirect costs (1.3%). The INMB of ocrelizumab was $413,611 per person over 30 years (). The INMB increased with the number of model cycles, and was over $100,000 at 5 years and over $200,000 at 10 years (Supplementary Figure 1). Because ocrelizumab costs less than interferon β-1a SC, use of ocrelizumab instead of interferon β-1a SC reduces the total revenue going to manufacturers by $211,099 per person over the 30-year period. The aggregate value to patients of ocrelizumab treatment relative to interferon β-1a SC over the RRMS population with mild-to-moderate disability in the US was $128.91 billion over 30 years.
displays the components of value due to ocrelizumab treatment as they accumulate over time. Cumulative cost savings from ocrelizumab exceeded $100,000 per patient by 5 years, while monetized QALYs accumulated steadily over the duration of the model.
Figure 2. Cumulative value of ocrelizumab relative to interferon β-1a subcutaneous.
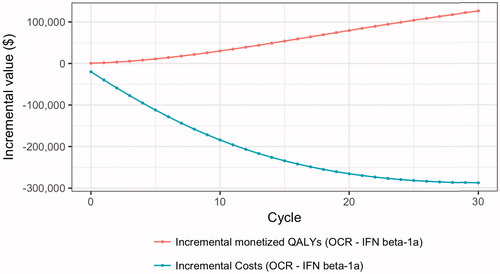
Table 2. Discounted health benefits and cost per person over 30-year horizon.
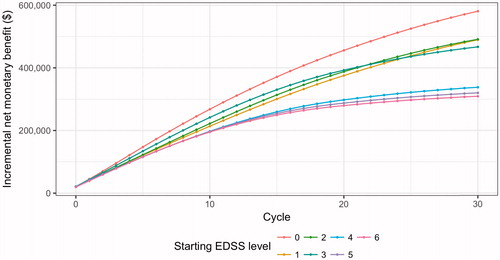
The INMB of ocrelizumab relative to interferon β-1a SC varied by the EDSS level at which ocrelizumab treatment was initiated (). For patients beginning treatment with no-to-mild disability (EDSS 1–3), ocrelizumab generated a value ranging from $466,976–$491,150 per person relative to interferon β-1a SC. The INMB for those who initiated treatment when their disability was more severe (EDSS 4–6) was smaller ($309,024–$337,821), but still economically significant. Relative to those who initiated treatment at EDSS level 4, those who initiated treatment at EDSS level 1 obtained a per-person additional value of $151,763 over the 30-year period.
Figure 3. Cumulative incremental net monetary benefit (INMB) of ocrelizumab relative to interferon β-1a subcutaneous, by starting EDSS level.
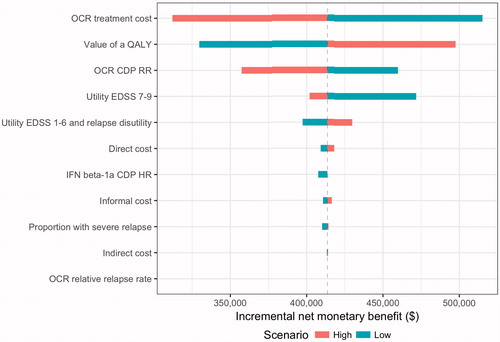
The results of the one-way sensitivity analyses are provided in . Influential parameters on model results included the value of a QALY, treatment costs, and disability progression in patients treated with ocrelizumab. Decreasing the value of a QALY to the lowest value, $50,000, still resulted in over $300,000 of value associated with ocrelizumab relative to interferon β-1a SC. Ocrelizumab continued to provide value relative to interferon β-1a SC when priced up to $91,481—a 40% increase above the baseline treatment cost. The INMB declined as differences in disease progression between ocrelizumab compared to placebo decreased (i.e. HR closer to 1.0); however, ocrelizumab treatment was still associated with positive value relative to interferon β-1a SC in a one-way sensitivity analysis using the upper bounds of the 95% CI from the clinical trials (reported in ). Given that the input parameter for utilities for EDSS 7–9 was measured in a small populationCitation22, we explored a wide range of values in the one-way sensitivity analysis for this parameter. Reducing the utility for EDSS 7–9 to 0.20 resulted in a higher INMB, which is explained by the greater proportion of patients reaching EDSS 7 and above under the interferon β-1a SC scenario compared to treatment with ocrelizumab (Supplementary Figure 2). Varying the inputs for direct costs, indirect costs, informal care costs, or proportion that experienced a severe relapse did not affect the base case results significantly. Overall, the results were robust to changes in the values of the parameters, and sensitivity analyses indicated that INMB of ocrelizumab relative to interferon β-1a SC was ≥$300,000 per person.
Figure 4. Tornado diagram of one-way sensitivity analysis.
Discussion
The OPERA trials, consisting of two phase 3 investigational studies, demonstrated the clinical benefits of ocrelizumab vs interferon β-1a SC, including reductions in the frequency of relapses and the risk of disability progression over 96 weeksCitation23. These clinical benefits translate into meaningful impacts on quality-of-life and reduction of costs, such that treatment with ocrelizumab was associated with a QALY increase of 8.0% and total cost-savings of 15.4% relative to interferon β-1a SC. Our analysis revealed that the value to patients generated by treatment with ocrelizumab for 30 years relative to treatment with interferon β-1a SC was over $128 billion. Sensitivity analyses of key input parameters support results from our base case model.
The cost-effectiveness of injectable DMTs, including interferon β-1a SC, has been studied in a number of head-to-head studiesCitation18–20,Citation51. Noyes et al.Citation20 found similar improvements on QALYs with all interferons vs basic supportive treatment over a 10-year period, with similar cost-effectiveness across all interferons. Recently, an alternate formulation, peginterferon β-1a, has been compared against interferon β-1a SC and glatiramer acetate in a 10-year economic study from the payer prospectiveCitation51. The QALY gain associated with peginterferon β-1a was modest compared to interferon β-1a SC and glatiramer acetate (0.06 and 0.07 QALYS, respectively)Citation51. A cost savings of ∼ $20,000 was observed with peginterferon β-1a vs the other treatments; however, this was driven primarily by differences in treatment acquisition costs. Evidence demonstrating similar QALY benefits and cost-effectiveness across the individual injectablesCitation18–20,Citation51 suggest that the results of this model may extend to other injectable DMTs similar to interferon β-1a SC.
A major strength of our study is that we take a societal perspective, which is necessary for decision-makers concerned about allocating societal resources. Indeed, the 2nd Panel on Cost-Effectiveness in Health and Medicine recently recommended that reference case analyses should take a societal perspective. Yet, it also noted that less than a third of all cost-effectiveness analyses since the 1st panel’s recommendations in 1996 have done soCitation52. The importance of taking a societal perspective is particularly salient in MS, since a large component of controlling MS-related costs is avoiding high indirect costs due to disability. Slowing disability progression, therefore, provides additional cost-savings often not considered in traditional evaluations. For example, in this study, we demonstrate that slowing disability progression, especially progression to EDSS 7 and above, where informal care costs increase dramatically due to disability, results in reduced informal care costs. In fact, the impact of ocrelizumab on informal care cost-savings relative to interferon β-1a (23.7%) savings was similar in magnitude to the cost-savings attributed to direct costs (22.9%).
A novel aspect of this study is that it is the first analysis to evaluate the variation in value by EDSS level at the time of treatment initiation. Indeed, our analysis revealed that the INMB was considerably higher in cohorts starting initial treatment at the lowest EDSS levels. These findings are consistent with the clinical evidence that reducing relapse rates within the first 10 years since disease onset was associated with reduced risk of disease progression, an effect not seen in patients further along in the disease courseCitation53.
Limitations
It is important that we highlight a number of limitations. First, this economic evaluation was conducted by combining data from multiple sources to identify inputs for clinical efficacy, costs, and utilities. Non-clinical inputs were not obtained from a population with identical distribution of EDSS as the OPERA trials, but costs and utilities were measured in a cohort study representative of the US population of MS patients (NARCOMS). In addition, treatment response was calculated over ∼2 years in the trials, and we assumed that treatment efficacy is carried over the time horizon of 30 years. Thus, our results may over-estimate the value of either therapy if treatment effects decline over time. However, if the percentage reduction in efficacy is similar across both therapies, ocrelizumab would still provide greater value over interferon β-1a SC.
Second, the model assumes that patients do not discontinue treatment during the time horizon. Persistence is critical to optimize clinical benefit, and may be negatively affected by increased disability, perceived lack of efficacy, and adverse events in MS patientsCitation54. While failing to account for discontinuation of therapy is a limitation of our analysis, adequate data of treatment persistence for individual DMTs are not reported in the literature. However, we do not believe this omission is a major concern. For example, a cohort study that followed patients for 18 years observed that the median time to treatment discontinuation with interferon β-1a or interferon β-1b, was 10.4 years, and the risk of discontinuing treatment increased with greater baseline EDSS levelCitation55. In our model, the INMB was still over $200,000 per person 10 years after treatment initiation. In addition, the patients least likely to discontinue treatment—those with mild disability and lower EDSS levels— accumulated the greatest value from ocrelizumab. Conversely, the patients who are most likely to discontinue treatment (i.e. greater initial EDSS level) gained the least value from treatment. Some studies have even suggested that discontinuation rules may improve the cost-effectiveness of DMTsCitation56. While discontinuation may improve the cost-effectiveness of both ocrelizumab and interferon β-1a SC, it is less likely to impact the INMB of ocrelizumab at shorter time periods such as 5 years, where the cumulative INMB of ocrelizumab exceeds $100,000 per person.
Third, this analysis did not incorporate the impacts of patent expirations. Patent expiry opens up the potential for biosimilar competition, which will likely reduce the price of therapy. This omission likely leads to bias in our estimations. However, the size and importance of bias due to patent expiry is uncertain, since pricing will be affected by a number of factors, including patent expiries of other DMTs not considered here. If the relative prices between the two drugs remain constant, our qualitative results continue to hold.
Fourth, we did not conduct probabilistic sensitivity analysis or structural uncertainty analysis. As a result, we did not produce confidence bounds on our estimates of the INMB arising from the joint impact of parameter uncertainty or estimate the value of collecting additional information on the parameters. Moreover, different model structures could result in different outcomes.
Fifth, we assumed that patients used ocrelizumab and interferon β-1a SC as first-line therapy. However, we include patients in our starting cohort with up to EDSS 6 disability levels, who may have failed previous treatments. If treatment efficacy declines after a previous treatment failure, then our model may under-estimate disease progression. However, the impact of this limitation on the NMB is uncertain because it impacts both ocrelizumab and interferon β-1a SC. Furthermore, we stratified our analysis by starting EDSS, which shows that the value of treatment is largest for those at the lowest EDSS levels (i.e. those most likely to be using first-line treatments).
Further, we do not include treatment switching in our analysis. In the context of real-world therapy use, patients are likely to switch treatments if they experience side-effects or do not respond to treatment. Thus, incorporating treatment switching is likely to improve the NMB of any given therapy over the long run, since those who perform poorly will switch to a different treatment. However, lack of treatment switching data for ocrelizumab precludes our ability to incorporate treatment switching.
Finally, our study assumed constant treatment efficacy over time. In practice, treatment efficacy may decline over time, thereby altering the INMB of ocrelizumab. Because treatment efficacy may decline for both ocrelizumab and interferon beta-1, it remains unclear how incorporation of declining treatment efficacy would impact our results, especially since declining treatment efficacy may lead to switching or treatment discontinuation. Again, this consideration has less impact on our results at shorter time periods such as 5 years, when the INMB of ocrelizumab remains high.
Conclusions
This economic evaluation compares an emerging DMT, ocrelizumab, with interferon β-1a SC from the societal perspective. Treatment efficacies were based on RCT data, and non-clinical inputs were obtained from the literature. Assuming that treatment efficacies are constant for 30 years, this analysis shows that long-term treatment with ocrelizumab has a number of clinical benefits—including slower disability progression and fewer relapses—which amounted to a 0.84 QALY gain compared with interferon β-1a SC treatment. Ocrelizumab also provided cost savings for all components (treatment, informal care, direct, and indirect costs) relative to interferon β-1a SC. These clinical and economic outcomes were used to calculate the INMB, where a monetized QALY was valued at $150,000, which implied that ocrelizumab would provide a value of $413,611 per patient in the US.
Transparency
Declaration of funding
This research was sponsored by Genentech, Inc., manufacturer of ocrelizumab (Ocrevus). Genentech had no role in the study design, analysis, or interpretation.
Declaration of financial/other relationships
MAF, TS, DI, and ODE are employees of Precision Health Economics, which provides consulting and other research services to pharmaceutical and other organizations. DKV was employed by Precision Health Economics at the time the study was conducted. NT is an employee of Genentech. Peer reviewers on this manuscript have received an honorarium from JME for their review work, but have no other relevant financial relationships to disclose.
Acknowledgments
Third-party writing support for this manuscript was provided by Health Interactions and Articulate Science and funded by Genentech, Inc.
References
- Campbell JD, Ghushchyan V, McQueen RB, et al. Burden of multiple sclerosis on direct, indirect costs and quality of life: National US estimates. Mult Scler Relat Disord 2014;3:227-36
- Lublin FD, Reingold SC. Defining the clinical course of multiple sclerosis results of an international survey. Neurology 1996;46:907-11
- Vollmer T. The natural history of relapses in multiple sclerosis. J Neurol Sci 2007;256:S5-S13
- Olsson T. The new era of multiple sclerosis therapy. J Intern Med 2014;275:382-6
- Weinshenker BG, Bass B, Rice GPA, et al. The natural history of multiple sclerosis: a geographically based study. Brain 1989;112:133-46
- Thompson A, Polman C, Miller D, et al. Primary progressive multiple sclerosis. Brain 1997;120:1085-96
- Naci H, Fleurence R, Birt J, et al. Economic burden of multiple sclerosis. Pharmacoeconomics 2010;28:363-79
- Weinshenker BG, Bass B, Rice G, et al. The natural history of multiple sclerosis: a geographically based study. Brain 1989;112:133-46
- Mitchell AJ, Benito-León J, González J-MM, et al. Quality of life and its assessment in multiple sclerosis: integrating physical and psychological components of wellbeing. Lancet Neurol 2005;4:556-66
- Buchanan R, Radin D, Chakravorty BJ, et al. Perceptions of informal care givers: health and support services provided to people with multiple sclerosis. Disabil Rehab 2010;32:500-10
- Goldman DP, Joyce GF, Lawless G, et al. Benefit design and specialty drug use. Health Affairs 2006;25:1319-31
- Wingerchuk DM, Lucchinetti CF, Noseworthy JH. Multiple sclerosis: current pathophysiological concepts. Lab Invest 2001;81:263-81
- Miller RM, Happe LE, Meyer KL, et al. Approaches to the management of agents used for the treatment of multiple sclerosis: consensus statements from a panel of US managed care pharmacists and physicians. J Manag Care Pharm 2012;18:54-62
- Goodin D, Frohman E, Garmany G, et al. Disease modifying therapies in multiple sclerosis: Subcommittee of the American Academy of Neurology and the MS Council for Clinical Practice Guidelines. Neurology 2002;58:169-78
- McNamara O, Brunton L, Lazo J, et al. The pharmacological basis of therapeutics. Goodman and Gilman’s Mc Graw-Hill; 2005
- English C, Aloi JJ. New FDA-approved disease-modifying therapies for multiple sclerosis. Clin Ther 2015;37:691-715
- Salter AR, Marrie RA, Agashivala N, et al. Patient perspectives on switching disease-modifying therapies in the NARCOMS registry. Patient Pref Adher 2014;8:971
- Goldberg L, Edwards NC, Fincher C, et al. Comparing the cost-effectiveness of disease-modifying drugs for the first-line treatment of relapsing-remitting multiple sclerosis. J Manag Care Pharm 2009;15:543-55
- Bell C, Graham J, Earnshaw S, et al. Cost-effectiveness of four immunomodulatory therapies for relapsing-remitting multiple sclerosis: a Markov model based on long-term clinical data. J Manag Care Pharm 2007;13:245-61
- Noyes K, Bajorska A, Chappel A, et al. Cost-effectiveness of disease-modifying therapy for multiple sclerosis A population-based study. Neurology 2011;77:355-63
- Guo S, Pelligra C, Thibault CS-L, et al. Cost-effectiveness analyses in multiple sclerosis: a review of modelling approaches. PharmacoEconomics 2014;32:559-72
- Kobelt G, Berg J, Atherly D, et al. Costs and quality of life in multiple sclerosis A cross-sectional study in the United States. Neurology 2006;66:1696-702
- Hauser SL, Bar-Or A, Comi G, et al. Ocrelizumab versus Interferon Beta-1a in relapsing multiple sclerosis. N Engl J Med 2017;376:221-234
- Kurtzke JF. Rating neurologic impairment in multiple sclerosis an expanded disability status scale (EDSS). Neurology 1983;33:1444
- Palace J, Bregenzer T, Tremlett H, et al. UK multiple sclerosis risk-sharing scheme: a new natural history dataset and an improved Markov model. BMJ Open 2014;4:e004073
- Palace J, Duddy M, Bregenzer T, et al. Effectiveness and cost-effectiveness of interferon beta and glatiramer acetate in the UK Multiple Sclerosis Risk Sharing Scheme at 6 years: a clinical cohort study with natural history comparator. Lancet Neurol 2015;14:497-505
- Orme M, Kerrigan J, Tyas D, et al. The effect of disease, functional status, and relapses on the utility of people with multiple sclerosis in the UK. Value Health 2007;10:54-60
- Tyas D, Kerrigan J, Russell N, et al. The distribution of the cost of multiple sclerosis in the UK: how do costs vary by illness severity? Value Health 2007;10:386-9
- Patzold U, Pocklington PR. Course of multiple sclerosis. Acta Neurol Scand 1982;65:248-66
- Arias E. United States life tables, 2010. National vital statistics reports. Hyattsville, MD: National Center for Health Statistics. 2014;63:7
- Cutter GR, Zimmerman J, Salter AR, et al. Causes of death among persons with multiple sclerosis. Mult Scler Relat Disord 2015;4:484-90
- Tappenden P, Chilcott J, O’Hagan T, et al. Cost effectiveness of beta interferons and glatiramer acetate in the management of multiple sclerosis. Final Report to the National Institute for Clinical Excellence. Centre for Bayesian Statistics in Health Economics. University of Sheffield; July 2001
- Ebers GC. Randomised double-blind placebo-controlled study of interferon β-1a in relapsing/remitting multiple sclerosis. Lancet 1998;352:1498-504
- Dilokthornsakul P, Valuck RJ, Nair KV, et al. Multiple sclerosis prevalence in the United States commercially insured population. Neurology 2016;86:1014-21
- U.S. Census Bureau. Current Population Survey, Annual Social and Economic Supplement. U.S. Census Bureau; 2013. Cited August 18, 2016. Available at https://www2.census.gov/programs-surveys/demo/tables/foreign-born/2013/cps2013/2013-asec-tables-nativity.pdf
- Fox RJ, Bacon TE, Chamot E, et al. Prevalence of multiple sclerosis symptoms across lifespan: data from the NARCOMS Registry. Neurodegen Dis Manag 2015;5:3-10
- Learmonth YC, Motl RW, Sandroff BM, et al. Validation of patient determined disease steps (PDDS) scale scores in persons with multiple sclerosis. BMC Neurol 2013;13:1
- Parisé H, Laliberté F, Lefebvre P, et al. Direct and indirect cost burden associated with multiple sclerosis relapses: excess costs of persons with MS and their spouse caregivers. J Neurol Sci 2013;330:71-7
- Oleen-Burkey M, Castelli-Haley J, Lage MJ, et al. Burden of a multiple sclerosis relapse. Patient–Patient-Centered Outcomes Res 2012;5:57-69
- Lee S, Baxter DC, Limone B, et al. Cost-effectiveness of fingolimod versus interferon beta-1a for relapsing remitting multiple sclerosis in the United States. J Med Econ 2012;15:1088-96
- Truven Health Analytics Micromedex Solutions. RedBook Online. Greenwood Village, CO: Truven Health Analytics. 2016
- Federal Reserve Bank of St. Louis. Consumer Price Index for All Urban Consumers: Medical Care. Federal Reserve Bank of St. Louis, 2016 [cited April 26 2017]. Available from https://research.stlouisfed.org/fred2/series/CPIMEDSL
- Viscusi WK, Aldy JE. The value of a statistical life: a critical review of market estimates throughout the world J Risk Uncert 2003;27:5-76
- Braithwaite RS, Meltzer DO, King Jr JT, et al. What does the value of modern medicine say about the $50,000 per quality-adjusted life-year decision rule? Med Care 2008;46:349-56
- Weinstein MC. How much are Americans willing to pay for a quality-adjusted life year? Med Care 2008;46:343-5
- Neumann PJ, Cohen JT, Weinstein MC. Updating cost-effectiveness—the curious resilience of the $50,000-per-QALY threshold. N Engl J Med 2014;371:796-7
- Sachs J. Report of the Commission on Macroeconomics and Health. Macroeconomics and health: investing in health for economic development. Geneva: World Health Organization; 2001
- Grabowski DC, Lakdawalla DN, Goldman DP, et al. The large social value resulting from use of statins warrants steps to improve adherence and broaden treatment. Health Affairs 2012;31:2276-85
- Jena A, Blumenthal D, Stevens W, et al. Value of improved lipid control in patients at high risk for adverse cardiac events. Am J Manag Care 2016;22:e199
- Philipson T, Eber M, Lakdawalla DN, et al. An analysis of whether higher health care spending in the United States versus Europe is ‘worth it’ in the case of cancer. Health Affairs 2012;31:667-75
- Hernandez L, Guo S, Kinter E, et al. Cost-effectiveness analysis of peginterferon beta-1a compared with interferon beta-1a and glatiramer acetate in the treatment of relapsing-remitting multiple sclerosis in the United States. J Med Econ 2016;19:684-95
- Sanders GD, Neumann PJ, Basu A, et al. Recommendations for conduct, methodological practices, and reporting of cost-effectiveness analyses: second panel on cost-effectiveness in health and medicine. JAMA 2016;316:1093
- Tremlett H, Yousefi M, Devonshire V, et al. Impact of multiple sclerosis relapses on progression diminishes with time. Neurology 2009;73:1616-23
- Bruce JM, Hancock LM, Arnett P, et al. Treatment adherence in multiple sclerosis: association with emotional status, personality, and cognition. J Behav Med 2010;33:219-27
- Zhornitsky S, Greenfield J, Koch MW, et al. Long-term persistence with injectable therapy in relapsing-remitting multiple sclerosis: an 18-year observational cohort study. PLoS One 2015;10:e0123824
- Tappenden P, McCabe C, Chilcott J, et al. Cost‐effectiveness of disease‐modifying therapies in the management of multiple sclerosis for the Medicare population. Value Health 2009;12:657-65