
Abstract
Aims: Real-world evidence on the safety profile and costs associated with immune thrombocytopenic purpura (ITP) treatment in adults is lacking. This study quantifies and compares adverse event (AE) crude rates and costs associated with ITP treatments as found in claims data.
Materials and methods: A retrospective claims-based analysis was conducted using IMS Pharmetrics Plus database. Included patients were ≥18 years old, with a diagnosis of ITP (2007–2012); an ITP-related claim for anti-D, intravenous immunoglobulin (IVIG), rituximab, romiplostim, or eltrombopag; and 1-year continuous enrollment (3-years for rituximab) during follow-up. AEs and event costs were identified during active treatment, defined from the first claim of each drug to a pre-defined treatment gap or end of study period. Descriptive statistics were reported with Wilcoxon rank-sum significance tests.
Results: A total of 2,518 patients were identified (mean age = 50.8 (±16.3 years); 55.8% male). Of all patients, 22.8% experienced any AE. Significantly fewer anti-D patients had any AE (13.8% vs IVIG: 21.1%, rituximab: 29.4%, romiplostim: 28.1%, eltrombopag: 22.4%). Nausea/vomiting and arthralgia/musculoskeletal pain were most common across treatments, and hemolytic events did not differ significantly across treatments. Most costly AEs were urinary tract infection, aseptic meningitis, and fever ($5000+/case); headache, nasal congestion, and hemolytic event were $4,000–5,000/case. Cost per AE did not differ by treatment.
Limitations and conclusions: Although lower than trial-based AE rates, claims for ITP treatment-related AEs are common, with higher numbers for rituximab and lower numbers for anti-D. This disparity suggests a possible differential cost burden overall that future analysis should explore.
Introduction
Immune (idiopathic) thrombocytopenic purpura (ITP) is an autoimmune disorder characterized by immunologic destruction of normal platelets, as well as relatively decreased rate of platelet productionCitation1,Citation2. ITP is classified by duration into newly-diagnosed (within 3 months of diagnosis), persistent (3–12 months from diagnosis), and chronic (>12 months from diagnosis)Citation3 disease status. The prevalence of chronic adult ITP in the US occurs in the range of 9.5–23.6 per 100,000 personsCitation4,Citation5. A gender differential may also exist. Although the prevalence has been found to be higher among females than males, with an overall prevalence rate ratio of 1.9 for females to malesCitation5, additional evidence suggests that ITP may predominate in men aged up to 30 years, after which women are more often affected, with the difference subsiding around the 70-years markCitation6.
Even though ITP is a rare disease, it is associated with substantial economic burden. Retrospective database studies have reported that the average ITP-attributable hospitalization cost per year in the US ranges from $4,986–$16,476Citation7–9. Furthermore, ITP-associated medical resource utilization and the corresponding expenditures remain substantive and constant over time, due to the chronic nature of the conditionCitation7. In addition to direct cost burden, indirect cost burden for ITP has also been reportedCitation10. A large survey-based study reported that ITP is associated with a higher number of physician visits, sick leave from work, more missed time from chores, and worse scores on productivity when compared to patients without ITPCitation10.
The treatment paradigm for ITP has been constantly shifting. Initial treatment for ITP often includes corticosteroids, and intravenous immunoglobulin (IVIG) and anti-D are also indicated for initial therapyCitation11. These may be followed by other options such as rituximab (off-label), thrombopoietin (TPO) receptor agonists romiplostim and eltrombopag, and splenectomyCitation11. While each of the treatments is associated with significant adverse events (AEs) reported in clinical studiesCitation11–15, real-world evidence on the safety outcomes as well as associated costs is lacking in the published literature. However, patient-reported treatment burden of ITP therapies, and particularly AEs, has been reported to be bothersome, leading to discontinuation or switching of treatmentsCitation16. While decision-makers must consider treatment efficacy, it will also be valuable to understand the burden of AEs associated with ITP therapies when making therapeutic decisions. The intent of the current study is to quantify and compare pharmaceutical treatment-related AE-related costs and rates relative to anti-D, as found in real-world claims data among patients with ITP.
Methods
Data source
Data was derived from the IMS PharMetrics PlusTM claims database, which contains adjudicated medical and pharmacy claims for more than 87 million health plan members in ∼55 health plans across the US from 2006 onwards. The data are longitudinal, with ∼22 million patients having 4 or more years of continuous enrollment in their health plan at the time of this study. The database is representative of the US commercially insured population, including patients from each three-digit zip code area of the US, and data from 90% of US hospitals and 80% of all US doctors. Within the database, inpatient and outpatient diagnoses were recorded as International Classification of Diseases, Ninth Revision, Clinical Modification (ICD-9-CM) codes. Other data recorded included inpatient and outpatient procedures, dates of service, retail and mail-order prescription claims, and detailed information on pharmacy and medical benefit (co-payment/coinsurance amount, deductible, and in-network vs out-of-network), inpatient stay and provider details (specialty, zip code and attending, referring, rendering, prescribing and primary care provider). Amounts charged by providers, and amounts allowed and paid by health plans, were available for all services rendered, as were the dates of service for all claims. Other data elements included demographic variables (e.g. patient age, gender, and geographical region), product type (e.g. health maintenance and preferred provider organizations), payer type (e.g. commercial and self-pay), and start and stop dates of health plan enrollment.
Patient selection
This study was a retrospective cohort analysis. Initially, all patients with a diagnosis of ITP (ICD-9-CM: 287.31) during the study period from January 1, 2007 through December 31, 2012 were selected. Patients with a claim for anti-D, IVIG, rituximab, romiplostim, or eltrombopag on or after the diagnosis of ITP between January 1, 2007 and December 31, 2012 were retained; the first such claim was defined as the index date. Note that corticosteroids were omitted from this analysis, due to difficulty confirming usage for ITP management in claims data; additionally, due to well-established inclusion of corticosteroids in the course of ITP therapyCitation11, the decision problem facing ITP management may focus on other therapeutic options. Patients were excluded from the study if they had a claim for ITP diagnosis in the 3-month period prior to the first ITP diagnosis; a claim for any of the index drugs in the 3-month pre-index period; who had a continuous enrollment of <3 months in the pre-index period and <12 months in the post-index period; or had incomplete records of age, gender, and enrollment. Since a longer follow-up time is required to observe a rituximab treatment episode and any subsequent episodes, continuous enrollment of 36 months in the post-index period was used to identify rituximab treatment episodesCitation17. To retain the focus of primary ITP, patients with a diagnosis of other platelet defects, non-thrombocytopenic purpuras, or thrombocytopenia due to other disorders (i.e. ICD-9 codes 287.1 [qualitative platelet defects], 287.2 [other nonthrombocytopenic purpuras], 287.4 [secondary thrombocytopenia], 279.12 [Wiskott-Aldrich syndrome], 279.11 [DiGeorge’s syndrome], 286.4 [von Willebrand’s disease], and 288.2 [genetic anomalies of leukocytes]) were excluded from the study. Finally, the adult patient population (≥18 years) was retained for the primary analysis.
Identification of treatment episodes
To assess AEs during active treatment, treatment episode was used as the unit of observation. Treatment episodes were defined by the dates of first and last administration of a given study drug. The start of the first treatment episode was defined by the first claim of the study drug. This first treatment episode was terminated and a subsequent treatment episode created if a pre-defined gap between two administrations of study drugs was observed, or if the end of continuous enrollment or the study period was reached. Episode-ending gaps were identified based upon one of two factors: (1) drug dosing schedules (TPOs)Citation18,Citation19 or (2) a minimal extension of average duration of response obtained from published studiesCitation12,Citation17: anti-D: 3 months, IVIG: 2 months, rituximab: 1 year and 2 months, romiplostim: 2 weeks, and eltrombopag: 60 days. Up to three treatment episodes were considered per patient, to increase available sample size while remaining tractable for data analysis. As the purpose was to increase sample size, episodes were not stratified by line of therapy.
Identification of AEs and costs
Treatment-related AEs () were selected based on events reported in package insertsCitation18–22. AEs were identified by medical claims with diagnosis codes (see Supplemental Appendix for coding details) within treatment episodes. Hemolytic anemia event was included in the study as a proxy for intravascular hemolysis, for which anti-D has a black box warning, since the latter event does not have a designated diagnosis code. To attribute events to treatments, AEs were identified within a pre-defined period of 3 days or 1 week of each dose during a treatment episode, depending on type of event (). The period from each dose was based on clinical opinion. Disease-specific costs (allowed amount) per event were estimated for each of the drug cohorts during the period of AE identification (3 days or 1 week). Disease-specific costs include those identified from claims which had an associated AE diagnosis claim in primary or secondary position.
Table 1. AEs of interest.
Measures and analyses
Patients’ baseline characteristics such as age, gender, types of health plans and payers, geographic region, Charlson Comorbidity Index (CCI) scores, comorbidities, and all-cause pre-index healthcare costs were summarized descriptively. The CCI is a widely-used numeric index that predicts mortality for patients with a range of comorbid conditions; each comorbidity is assigned a score associated with risk of dying, and the series of comorbidity-specific scores are summed to provide a mortality-predictive total scoreCitation23–25. The AE rate per treatment episode and AE cost per event were compared across the drugs, with anti-D as the reference drug. Descriptive statistics such as frequency and percentage were reported for categorical variables, with Chi-square tests. Means, standard deviations (SD), and medians were reported for numeric variables, with Wilcoxon rank-sum tests. Multivariable analysis was performed to account for baseline differences between the cohorts of interest. A generalized estimating equation (GEE) model was run to assess AE rates, while controlling for key demographic and clinical characteristics; this type of model is a semi-parametric approach to testing for group or treatment differences, and is particularly useful for multivariate analyses with potentially correlated outcomes and an unknown covariance structureCitation26. A p-value of <.05 was considered to be statistically significant.
All statistical analyses were conducted using SAS version 9.2 (SAS Institute, Cary, NC). Results are presented in 2014 US dollars.
Results
Demographic and clinical characteristics
A total of 2,518 patients met all the inclusion and exclusion criteria. shows the attrition of patient selection using the inclusion and exclusion criteria. Overall, the mean (SD) age of patients was 50.8 (16.3) years, and 55.8% were male (). The majority of patients were from the Midwest (33.5%) and South (30.1%). Most patients were covered by commercial insurance (61.6%) or were self-insured (33.2%). Overall, the mean (SD) number of treatment episodes was 1.4 (0.6) ().
Figure 1. Patient attrition.
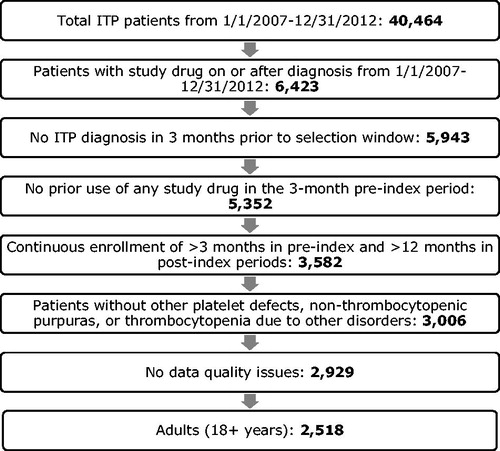
Table 2. Patient demographic characteristics.
Table 3. Patient clinical characteristics.
AE rates
Across all patients, a total of 2,698 treatment episodes were reported. Overall, 22.8% of these episodes were with an AE (). Nausea/vomiting (5.3%) and arthralgia/musculoskeletal pain (5.3%) were the most common AEs across treatments, followed by headache (3.8%) and upper respiratory infection (3.7%). Anti-D episodes had a significantly lower overall AE rate than that among other drugs (p < .05). When examining differences in unadjusted rates aligning with reimbursed claims, TPO episodes were associated with higher rates of pain-related AEs, including arthralgia/musculoskeletal pain (anti-D: 2.4% vs romiplostim: 9.4%, eltrombopag: 7.2%; p < .05 for both comparisons) and back pain (anti-D: 1.5% vs romiplostim: 3.1%, eltrombopag: 2.6%; p > .05 for both comparisons) as well as upper respiratory tract infection (anti-D: 1.3% vs romiplostim: 6.4%, eltrombopag: 7.2%; p < .05 for both comparisons) as compared to anti-D episodes. The occurrence of headache events was statistically significantly higher among IVIG episodes than that among anti-D episodes (5.5% vs 2.6%; p < .05). Hemolytic anemia rates were similar across treatments.
Table 4. AE rates by drug episodes.
Controlling for demographic and clinical characteristics, results from the GEE model suggested that anti-D episodes had a significantly lower overall AE rate than that among other drugs (p < .05) (). Anti-D episodes had significantly lower occurrences of arthralgia/musculoskeletal pain and upper respiratory tract infection as compared to other drugs (p < .05; except IVIG for arthralgia/musculoskeletal pain, where p > .05; data not shown) and significantly lower occurrences of asthenia/fatigue as compared to rituximab and romiplostim episodes (p < .05; data not shown). Similar to the univariate results, the occurrence of headache events was significantly higher among IVIG episodes than that among anti-D episodes in the multivariate model (p < .05; data not shown). Hemolytic anemia rates were similar across all treatments.
Table 5. GEE model results for overall AE rates.
AE costs
Overall, costs associated with the majority of the AEs are in the range of $2,000–$7,000 per case (). Urinary tract infection ($7,200) is associated with the highest cost per case, followed by aseptic meningitis ($5,802) and fever ($5,080). These high cost items had more inpatient care-related costs. The majority of the costs per AE did not significantly differ by treatment (). Mean back pain and headache costs associated with rituximab episodes were significantly lower than those with anti-D ($1,052 (SD = $3,224) vs $5,788 ($5,053); p = .008, and $505 ($959) vs $3,668 ($5,502); p = .027).
Figure 2. Overall mean AE costs per case.
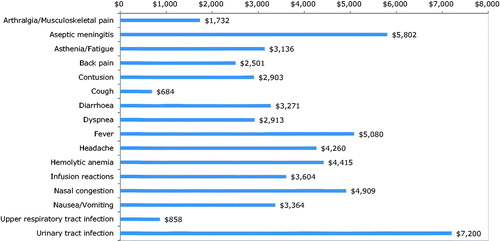
Table 6. AE costs per event by drug.
Discussion
This study presents real-world evidence on comparative treatment-related AE costs associated with ITP therapies among adults. Based on crude or adjusted AE rates, anti-D episodes were associated with the lowest overall AE rate compared with that among other comparators. Nausea/vomiting and arthralgia/musculoskeletal pain were the most commonly found AEs across treatments, followed by headache and upper respiratory infection. Hemolytic anemia events did not differ significantly across treatments.
Overall, the majority of the rates across treatments reported in this study are lower than the clinical trial-based ratesCitation12–15. The differences may be attributable to differences between clinical prospective study and retrospective observational study design. Clinical studies are conducted in controlled environments, while claims databases lack clinical information. Nonetheless, these reported AE rates suggest and confirm that claims for ITP treatment-related AEs are common in real-world experience. Across treatments, urinary infection, aseptic meningitis, and fever were associated with the highest costs per event. Cost to manage each AE did not differ by treatment. Due to gaps in the literature estimating AE costs among ITP patients, results could not be compared to the published literature. These cost estimates and rates provide insight into the real-world economic burden of AEs among patients with ITP, and can also be used in economic modeling studies for ITP treatments.
Results of this study should be interpreted in light of certain limitations, however. Data reflect a largely commercially- or self-insured population, and is, therefore, not generalizable to a Medicare or Medicaid population. As with all administrative claims databases, it should be noted that claims are collected for reimbursement rather than research purposes, and, thus, the analysis is constrained by the diagnosis codes, which may include incomplete or incorrect diagnosis on medical records. The study assumed all information required for case classification was present across the cohorts of interest. The causal relationship among study drugs, AEs, and AE costs cannot be fully explained by the data source. In the absence of clinical data, as is true in claims data, it may not be feasible to determine if the observed AEs were directly related to the treatment, ITP condition severity, AE severity, or pre-existing conditions exacerbated by current treatments, or residual effects from prior treatments. Interpretation of results should be done with recognition that such clinical markers were not addressed. However, this analysis attempted to address this by limiting the observation period of AEs of within 3 days or 1 week of a treatment dose. GEE modeling also controlled for CCI in an attempt to adjust for underlying health differences between patients when estimating rates, and no significant difference in AE costs was found by treatment, as expected given a hypothesis that AE costs relate to the AE itself and not the background therapy.
Additionally, due to small sample sizes in the data for this rare condition, multiple treatment episodes were identified to increase the sample size; it was not feasible, therefore, to stratify the analysis and identify any differential burden by line of therapy in the current analysis. Similarly, due to a lack of stratification by line, it was not possible to account for timing of any splenectomies that occurred in analyses. However, GEE modeling was performed only on overall AE rates because of this sample size consideration. Also, generalizability of results should be carefully considered in light of the limited sample size. As additional data become available over time, additional analysis by line of therapy could be valuable to understand whether therapeutic sequence impacts AE burden.
The data are also limited to direct costs and do not report AE severity. As some AEs may be associated with indirect costs, the total AE costs in the current study may under-estimate the overall burden of treatment-related AEs associated with ITP therapies. Moreover, without a severity indicator, it is unclear whether high AE costs are due to the AE severity, or to uncoded concomitant diagnoses; however, because we anticipate that coding will follow the item with the highest reimbursement, we assume that the costs can be largely attributed to the specified code. Furthermore, AEs in this study reflect only those identified via FDA prescribing information, and, therefore, some AEs may be omitted from consideration; however, this implies that the burden of AEs as represented in the current evaluation may be a low estimate, and should be interpreted accordingly.
Lastly, since both the TPO agents were approved in the US in the second half of 2008 (with a mandatory Risk and Evaluation Mitigation strategy program until December 2011Citation27,Citation28), sample sizes for both romiplostim and eltrombopag are lower than that for other drugs, because of the availability of data at the time when the analysis was conducted. Subsequent analysis with more recent data may enable larger sample sizes for these drugs, and more robust comparisons.
Although lower than trial-based AE rates, this claims analysis provides novel real-world evidence that AEs related to ITP treatment, whether on- or off-label, are common, and associated costs may become burdensome, especially for patients receiving chronic therapy. This is also important to consider in the context of the primary ITP drug costs. Although absolute values vary based on publication methodology, studies suggest that therapy costs may range from $2,000–$3,000 per dose for anti-D, and somewhat higher values for IVIGCitation29,Citation30, to as much as $10,000–$50,000 for a course of rituximabCitation31. Taken together, the overall burden related to ITP treatment and AE management may be substantial, and decision-makers may need to consider all components when choosing therapies. This study indicates that future analyses would be of value, including validation of the high AE burden in other US and ex-US databases, exploring whether differential burden exists by line of therapy, and calculating whether the overall cost burden differs across available treatment options.
Transparency
Declaration of funding
Funding for this study was provided by Emergent BioSolutions.
Declaration of financial/other relationships
TB and GL are employed by Emergent BioSolutions. The other authors have no relationships to be declared. JME peer reviewers on this manuscript have no relevant financial or other relationships to disclose.
Previous presentation
Aspects of this study were presented at the International Society on Thrombosis and Haemostasis (ISTH) 2015 Congress, Toronto, June 20–25, 2015.
Appendix - Table 1
Download MS Word (30.5 KB)Acknowledgments
No assistance in the preparation of this article is to be declared.
Related Research Data
References
- Neunert C, Lim W, Crowther M, et al. The American Society of Hematology 2011 evidence-based practice guideline for immune thrombocytopenia. Blood 2011;117:4190-207
- Bromberg ME. Immune thrombocytopenic purpura–the changing therapeutic landscape. N Engl J Med 2006;355:1643-5
- Rodeghiero F, Stasi R, Gernsheimer T, et al. Standardization of terminology, definitions and outcome criteria in immune thrombocytopenic purpura of adults and children: report from an international working group. Blood 2009;113:2386-93
- Feudjo-Tepie MA, Robinson NJ, Bennett D. Prevalence of diagnosed chronic immune thrombocytopenic purpura in the US: analysis of a large US claim database: a rebuttal. J Thromb Haemost 2008;6:711-12
- Segal JB, Power NR. Prevalence of immune thrombocytopenia: analyses of administrative data. J Thromb Haemost 2006;4:2377-83
- Gernsheimer T. Epidemiology and pathophysiology of immune thrombocytopenic purpura. Eur J Haematol Suppl 2008;69:3-8
- Saleh MN, Fisher M, Grotzinger KM. Analysis of the impact and burden of illness of adult chronic ITP in the US. Curr Med Res Opin 2009;25:2961-9
- Aledort LM, Lyons RM, Okano G, et al. The clinical and direct medical cost burden of splenectomy among managed care patients with chronic Immune Thrombocytopenic Purpura (ITP). Blood 2006;108:5536
- Danese MD, Lindquist K, Gleeson M, et al. Cost and mortality associated with hospitalizations in patients with immune thrombocytopenic purpura. Am J Hematol 2009;84:631-5
- Tarantino M, Mathias SD, Snyder CF, et al. Impact of ITP on physician visits and workplace productivity. Curr Med Res Opin 2010;26:319-28
- Neunert CE. Current management of immune thrombocytopenia. Hematol Am Soc Hematol Educ Program 2013;2013:276-82
- Bussel J, Tarantino M, Nalysnyk L, et al. Intravenous rhesus immune globulin and intravenous immunoglobulin in immune thrombocytopenic purpura. US Hematology 2007;1:28-34
- Arnold DM, Heddle NM, Carruthers J, et al. A pilot randomized trial of adjuvant rituximab or placebo for nonsplenectomized patients with immune thrombocytopenia. Blood 2012;119:1356-62
- Kuter DJ, Bussel JB, Newland A, et al. Long-term treatment with romiplostim in patients with chronic immune thrombocytopenia: safety and efficacy. Br J Haematol 2013;161:411-23
- Saleh MN, Bussel JB, Cheng G, et al. Safety and efficacy of eltrombopag for treatment of chronic immune thrombocytopenia: results of the long-term, open-label EXTEND study. Blood 2013;121:537-45
- Brown TM, Horblyuk RV, Grotzinger KM, et al. Patient-reported treatment burden of chronic immune thrombocytopenia therapies. BMC Blood Disord 2012;12:2
- Auger S, Duny Y, Rossi JF, et al. Rituximab before splenectomy in adults with primary idiopathic thrombocytopenic purpura: a meta-analysis. Br J Haematol 2012;158:386-98
- Romiplostim package insert. Thousand Oaks, CA, USA: Amgen Inc. Nplate® Package Insert. 2014. http://pi.amgen.com/united_states/nplate/nplate_pi_hcp_english.pdf
- Eltrombopag package insert. Research Triangle Park, NC, USA: GlaxoSmithKline. Promacta Package Insert. 2014. https://www.gsksource.com/gskprm/htdocs/documents/PROMACTA.PDF
- Anti-D package insert. Winnipeg, Manitoba, Canada: Emergent BioSolutions Inc. WinRho® SDF Package Insert. 2014. http://www.winrho.com/pdfs/WinRho_PI.pdf
- IVIG package insert. Bern, Switzerland: CSL Behring. PrivigenTM Package Insert. 2014. http://labeling.cslbehring.com/PI/US/Privigen/EN/Privigen-Prescribing-Information.pdf
- Rituximab package insert. South San Francisco, CA, USA: Genentech, Inc. Rituxan® Package Insert. 2014. http://www.gene.com/download/pdf/rituxan_prescribing.pdf
- Quan H, Li B, Couris CM, et al. Updating and validating the Charlson Comorbidity Index and score for risk adjustment in hospital discharge abstracts using data from 6 countries. Am J Epidemiol 2011;173:676-82
- Deyo RA, Cherkin DC, Ciol MA. Adapting a clinical comorbidity index for use with ICD-9-CM administrative databases. J Clin Epidemiol 1992;45:613-19
- Charlson ME, Pompei P, Ales KL, et al. A new method of classifying prognostic comorbidity in longitudinal studies: development and validation. J Chronic Dis 1987;40:373-83
- Hanley JA, Negassa A, Edwardes MD, et al. Statistical analysis of correlated data using generalized estimating equations: an orientation. Am J Epidemiol 2003;157:364-75
- Food and Drug Administration. Risk Evaluation and Mitigation Strategy (REMS) BL 125268 Nplate® (romiplostim). August 2008. Thousand Oaks, CA, USA: Amgen Inc. http://www.fda.gov/downloads/drugs/drugsafety/postmarketdrugsafetyinformationforpatientsandproviders/ucm129516.pdf
- Food and Drug Administration. Risk Evaluation and Mitigation Strategy (REMS) NDA 22-291 PROMACTA® (eltrombopag). November 2008. Collegeville, PA, USA: GlaxoSmithKline. http://www.fda.gov/downloads/drugs/drugsafety/postmarketdrugsafetyinformationforpatientsandproviders/ucm144246.pdf
- Sandler SG, Novak SC, Roland B. Cost of treating immune thrombocytopenic purupra using intravenous Rh immune globulin versus intravenous immune globulin. Am J Hematol 2000;63:156-8
- Bennett CL. Comparison of the efficacy, safety, and cost of agents used to treat idiopathic thrombocytopenic purpura in adults and children. Pharm Pract News. 2007. New York, NY, USAhttp://www.pharmacypracticenews.com/download/sr07046wm.pdf
- Ghanima W, Godeau B, Cines DB, et al. How I treat immune thrombocytopenia (ITP): the choice between splenectomy or a medical therapy as a second-line treatment. Blood 2012;120:960-9