
Abstract
Aims: To develop a health economic model to evaluate the long-term costs and outcomes over the healthcare treatment pathway for patients with low back pain (LBP).
Materials and methods: A health economic model, consisting of a decision tree structure with a Markov microsimulation model at the end of each branch, was created. Patients were followed from first observed clinical presentation with LBP until the age of 100 years or death. The underlying data to populate the model were based on Swedish national and regional registry data on healthcare resource use and sickness insurance in patients presenting with LBP in the Swedish region Västra Götaland during 2008–2012. Costs (outpatient healthcare visits, inpatient bed days, pharmaceuticals, productivity loss), EUR 2016, and quality-of-life based on EQ-5D data from the registries and published estimates were summarized over the lifetime of the patients with 3% annual discount. A lost quality-adjusted life year (QALY) was valued at €70,000.
Results: Mean lifetime total cost was estimated at €47,452/patient, of which indirect costs were 57%. Total lifetime economic burden for all patients coming to clinical presentation in Sweden per year was €8.8bn. The average LBP patient was estimated to face a loss of 2.7 QALYs over their lifetime compared with the general population. For all patients in Sweden coming to clinical presentation in 1 year this gives 505,407 QALYs lost, valued at €35.3bn. Adding the economic burden, the total societal burden amounts to €44.1bn.
Conclusion: This pathway model shows that most patients with LBP receive conservative care, and a minority consume high-cost healthcare interventions like surgery. The model could be used to see broad economic effects of different patterns of healthcare provision in sub-groups with LBP and to estimate where it is possible to influence these pathways to increase utility for patients and for society.
Introduction
Pain and symptoms of the back and neck are currently the biggest burden of Western societies in terms of years lived with disability, according to WHO’s studiesCitation1. Low back pain (LBP) specifically has been estimated to affect 80–85% of the world’s population at some point during a lifetimeCitation2. Although having its cause in the low back, the term LBP is also used to refer to pain and problems in the lower extremities when these are caused by, for example, lumbar spinal stenosis—a narrowing of the spinal canal. Given the wide range of etiologies, the treatments for LBP are many. For some patients, symptoms resolve within 3 months, for example after physical therapy and other non-surgical regimens. For a proportion of patients, the condition becomes chronic (defined as pain limiting usual activities for at least 3 months), and the prevalence of chronic LBP is risingCitation3,Citation4. If symptoms persist, patients may be referred to orthopedic or neurosurgical specialists, evaluating whether surgery is indicatedCitation5,Citation6. Surgical treatments have increased dramatically, especially in the US, where the number of spinal fusions per year has increased by 55% during the last decadeCitation7. Although surgery may still be rather unlikely for a given patient with LBP, the large number of patients with LBP makes the number of surgeries high, as well as the corresponding rising economic burden on society. Notwithstanding the direct costs due to medical treatments, previous studies have concluded that indirect costs—chiefly work loss—constitute 70–90% of the total economic cost related to LBPCitation8,Citation9.
Numerous studies have investigated the economic burden of LBP, which appears to be very large and growingCitation10. No studies have, as far as we know, investigated the long-term treatment pathway, life-time health consequences, and the associated burden in patients with LBP. A model that could simulate the whole disease progress and treatment pathway could provide better understanding of the treatment pathway. Ultimately, such a model could inform whether there are potential improvements in management of LBP that could be made, and whether making such changes could improve the outcomes for the patient population and reduce the economic and health-related burden. The objective of this study was to develop a health economic model based on data from six Swedish national registries that could simulate the treatment pathway and its impact on the burden of LBP over the lifetime of patients.
Materials and methods
The study took a societal perspective, i.e. included both healthcare resource use (e.g. visits to physican and inpatient care) and indirect costs in terms of productivity loss). Health effects were measured using quality adjusted life years (QALYs) and life years. Costs and effects were discounted annually with 3% in accordance with Swedish guidelinesCitation11.
Model design
The aim of the model is to simulate how patients move both between different health states and between different parts of the healthcare system and capture costs and quality-of-life along the way. The model structure is shown in . A patient starts the model at the time of first clinical presentation, the “index-point”, of the LBP condition (i.e. visit to primary care physician). After the index-point, a patient moves through a “decision tree” for a maximum of 12 months (four cycles). During this period, the patient has a chance of receiving conservative care (defined as all outpatient non-surgical care such as physiotherapy), being referred to an orthopedic or neurosurgical specialist, having spine surgery, or being hospitalized due to the LBP-condition without having surgery. The clinical pathways included in this model were based on the opinion of Swedish experts, physicians, and also by tracking and analyzing the observed resource use in the registry data. In the model, patients are followed until the age of 100 years, or until death.
Figure 1. Model structure. Patient enters the model at the top, to start in a pathway tree of max four cycles, where patient can go between visit to specialist, conservative care, and inpatient care. If patient enters surgery, he goes into Markov post-surgical care (MPSC). Otherwise, patient enters Markov non-surgical care (MNSC) or dies at any stage in the model.
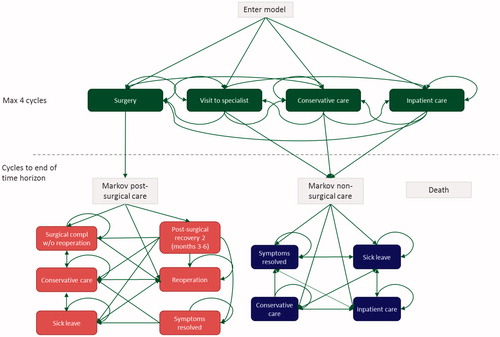
If no surgery has been performed during the first 12 months after the index-point (i.e. the time frame of the decision tree), the patient moves into the Markov Non-Surgical Care (MNSC). Patients can enter MNSC in any of the following four states; symptoms resolved, sick leave, conservative care, and inpatient care. Inpatient care includes surgical treatments not captured within 12 months after the index-point.
Lumbar spine surgery was the only orthopedic treatment included in this analysis. Patients who have undergone surgery within the first 12 months move into the Markov Post-Surgical Care (MPSC) model. In MPSC, patients have probabilities to go to re-operation, surgical complication, or post-surgical recovery, and later into conservative care, sick leave, and symptoms resolved. If a patient dies while in MNSC or MPSC, he/she moves into the absorbing death state. A separate Markov model for death (MD) was included for completeness to capture all deaths within the decision tree. The MD model includes only a death state.
The model is run using first-order Monte Carlo simulation (individual state transition model). One reason for choosing an individual level simulation technique instead of Markov cohort simulation was due to the large number of states required to accurately depict the treatment pathway. Another reason is the heterogeneity in the case mix profiles affecting transition probabilities, costs, and quality-of-lifeCitation12. The cycle length is set at 3 months, which was chosen in accordance with a proposed follow-up interval for non-operatively treated patients by Clement et al.Citation13.
Data used for the model
The underlying data used to populate the model were mainly derived from a LBP research database and complemented with information available in the literature and in the public domain. The research database consisted of data from six Swedish national population based registers; the administrative database from the Western Swedish region Västra Götaland “VEGA”, the National Patient Register (PAR), the Population and Activity Register (LISA), Social Insurance Agency, the Prescribed Drug Register, and Swespine (the Swedish quality-of-care register for spine surgery). The research database included patients presenting with LBP symptoms identified using ICD-10 codes in the county-council database “VEGA”, along with patients who underwent spine surgery as registered in Swespine.
Linkage between data sources was conducted by Statistics Sweden using social security numbers and delivered de-identified. The study was approved by the Stockholm research ethics committee, decision 2013/2225-31/5. All use of data was in accordance with the Swedish law on personal data, Personuppgiftslagen, 1998:204. Data sources and details on data availability and quality are described in Supplementary Appendix 1.
Definition of states
The resources used and observed in the research database were translated into a set of discrete states and cycles. Rulebooks were written for how to assign a patient to a given state in the decision tree, MPSC and MNSC, respectively. The rulebooks had a strict hierarchy so that if a patient fulfils conditions for two states in the same cycle, the patient was assigned the state with the higher hierarchical status. The process was repeated for each 3-month cycle and for each patient. All rulebooks have death with the highest importance, i.e. if death occurs within the cycle, it takes precedence over other states. provides short definitions of the included states. See Supplementary Appendix 2 for a more detailed description of the rulebooks.
Table 1. Definitions of states in the model. States lower in the table take precedence, so that, for patients fulfilling conditions for two or more states simultaneously, the state lower in the table is chosen.
The final diagnosis observed within the decision tree (first 12 months after index-point) was assigned from the start and throughout the model simulation. As such, if patients had a different diagnosis in the beginning of the decision tree than later in the decision tree, the last diagnosis was used for the entirety of the model simulation.
Transition probabilities
The probabilities of moving between health states in each cycle were mainly derived from the research database. The transition probabilities were fitted using parametric survival regression using the Weibull distribution. The Weibull distribution is commonly used to sample time-to-event data, when the hazard of an event occurring is decreasing or increasing over timeCitation14. In the state symptoms resolved, mortality was assumed equal to that of the age- and gender-matched general population, based on publicly available data from Statistics SwedenCitation15.
Quality-of-life
Quality-of-life (QoL) estimates for all various health states in the model were not available in the research database, except for patients having surgery. QoL for patients having surgery was defined using EQ-5D -3L data, which are collected in the Swespine register. EQ-5D is a generic measure of utility that generates an index-based summary score based on societal preference weights. It includes measures of health status across five dimensions: mobility, self-care, usual activities, pain/discomfort, and anxiety/depression, from which a utility index score is computed that can range from less than 0 (worse than dead) to 1 (perfect health). QoL data for non-operated patients was derived from Burström et al.Citation16, who estimated EQ-5D index values in the general Swedish population and by certain diseases. In this article, EQ-5D data were based on a questionnaire in Stockholm county. The UK EQ-5D index tariff, using the time-trade-off (TTO) method, was used to elicit mean TTO values for different health states. Respondents reporting LBP twice a week or more frequently during the last 6 months were classified as having this condition. EQ-5D, with three levels of responses (EQ-5D-3L), was used in all cases. For all estimations of QoL used in the model, see Supplementary Appendix 3.
Costs
Costs were calculated by multiplying the number of each resource with its corresponding unit cost. Resource use was derived from the data available in the research database at individual level. Resources were summed over each cycle per patient, and averaged by type of resource, health state, and patient characteristics. Unit costs for outpatient visits and inpatient hospitalizations were collected from the regional price list used in the county of Västra GötalandCitation17. This price list is highly detailed and publicly available, and cost variation across Sweden is deemed small. Costs of spine surgery at private hospitals were derived from the reimbursement system of spine surgery in the Stockholm county councilCitation18, and using DRG weights as registered in the National Patient Register and unit costs for public hospitalsCitation17. For drug prescriptions, the total cost, including fees paid by the patient and by the county council, was used.
Indirect costs were included in terms of losses to paid production (sick leave and early retirement in working population, age 19–64) as registered in the Social Security Agency register. In Sweden, insured individuals are eligible for early retirement if in the age 19–64 and are anticipated to have reduced work capacity for at least 1 year. Short-term sick leave benefits can be granted for individuals who are employed and have at least 25% reduced work capacity. Productivity loss was valued according to the human capital approach, which entails that the value to the society of productivity loss is measured as the present value of lost time according to the market wageCitation19. Thus, in this study, the indirect cost of each day of sick leave or early retirement equals the average daily wage in Sweden, which was collected from Statistics SwedenCitation20, and 31.42% of taxes were added (derived at €147 per day). Costs are presented in EUR (€) at 2016 prices. Unit prices are presented in Supplementary Appendix 3.
Patient simulation sample
The study population consisted of a cohort of patients presenting with LBP symptoms in primary care during the years 2008–2012. The aim was to follow patients from first presentation of symptoms. Therefore, patients were only included if the initial visit was in primary care, and if it was the first visit for LBP in 2 years preceding the index-point. These patients were identified using ICD-10 codes using an administrative database “VEGA” and the quality of care register Swespine. ICD-10 codes included were M40* (kyphosis and lordosis), M41.0–2 (scoliosis), M41.4–9 (scoliosis), M43* (other deforming dorsopathies), M46* (other inflammatory spondylopathies), M47.2–8 (spondylosis), M47.9K (spondylosis), M47.9X (spondylosis), M48.0K (spinal stenosis), M48.1–3, M48.4K, M48.5, M48.8K, M48.8W, M48.9, M51.0K, M51.1K, M51.2–9, M53.2-9, M54.3–5, M54.8–9, M99.0, M99.1K, M99.2–9, Q76.3 (other spondylopathies). Patients included were living in the region Västra Götaland at the index-point. Patients with acute symptoms, fractures, infections, or cancer were excluded.
To analyse the impact of the patient’s characteristics, 11 categorical covariates were used: female (yes/no), age, comorbidity, diagnosis group (disc herniation, spondylolisthesis, degenerative disc disease, spinal stenosis, lumbar pain, other), income, born in Sweden (yes/no), and education level (1–7, where 7 is the highest level). Comorbidity was estimated by calculating the Elixhauser comorbidity indexCitation21.
In the simulation, age was time-dependent, while the other covariates were defined at the end of the decision tree and beginning of Markov microsimulation. For the estimation of transition probabilities, effects of covariates were taken into account by adjusting the scale parameter using the coefficients estimated in the Weibull regression. For costs and QoL, ordinary least square regressions were used.
Control group
To control for costs that would have been present even if a patient would not have LBP, the model included control groups on costs based on literature. For outpatient visits and inpatient care a control group was derived from aggregated data available in the literatureCitation22. These aggregated data were indexed to 2016 price level using the latest published consumer price index from Statistics SwedenCitation23. The control group for the use of pharmaceuticals was derived from a publicly available report of the National Board of Health and WelfareCitation24. For indirect costs, a control group was derived from the general population using official data on sick leave and early retirement from the Social Security AgencyCitation25,Citation26. The control group for indirect costs were extracted for the same years in which we followed the LBP population. The average control costs were deducted for each cycle and patient in the model simulation and was assumed to be the same for all cycles. Productivity control cost was deducted for as long as the patient was of working age.
QALYs lost due to LBP was calculated as the difference in QALYs, assuming that QoL is equal to the age- and gender-matched population of the estimated QALYs using the QoL data described above. Estimates of QoL in the Swedish general population were collected from Burström et al.Citation16.
Calculation of societal burden
The model estimates the societal burden by employing an incidence-based approach, i.e. containing the number of patients who have an index-point during 1 year in Sweden multiplied by the corresponding disease-related consequences. The societal burden was calculated as the sum of direct costs related to healthcare visits, inpatient bed days, pharmaceuticals, and spine surgery, and indirect costs of productivity loss, and the intangible costs related to lost QALYs. Intangible costs are sometimes considered in studies in the field of health economics, in the context of quantifying the health benefit of certain medical treatment or the strain a disease causes on the quality-of-life of those affected. Several approaches exist to calculate the intangible cost of lost QALYs, including valuing a QALY lost compared with the general population using an assumed willingness-to-pay threshold (WTP)Citation27. Calculating the intangible cost of a lost QALY, thus, requires an assumption on the value of life, as no standardized value exists for the monetary value of a QALY. The WTP for a QALY differs among other things on disease severity, where the society is willing to pay more for patients facing serious conditions. The WTP issued by the Swedish Dental and Pharmaceutical Benefits Agency for outpatient drugs was in the interval €79,100–€135,600 during 2005–2011Citation28. The lower figure in the interval is similar to the EU standards of the European Chemicals Agency, stating the reference value of an average of €55,800 (∼ €63,500 in 2016 prices)Citation29. For the base case calculations, an estimate of €70,000 was used as the valuation of a QALY, while other values, both lower and higher, were used in sensitivity analysis. The total societal burden was calculated as the sum of direct costs (outpatient visits, inpatient care, and pharmaceuticals), indirect costs (productivity loss), and the intangible value of lost QALYs.
Our data included all visits to primary and secondary care in the Västra Götaland county, ∼1.6 million inhabitants (17% of Sweden’s 9.6 million inhabitants). When calculating the burden on the whole Swedish population, the case-mix and demographics were assumed to be the same in Västra Götaland as in the rest of Sweden.
Sub-group analyses
Sub-group analyses were conducted to identify potential variation of health effects and costs across patient groups. This included analyses of sex, age groups, diagnosis groups, type of surgical procedures, socioeconomic variables (income and education level, country of birth).
Data management
Data management was conducted using a MySQL server, statistical analyses using the software package Stata 14, and the model was programmed in Microsoft Excel with Visual Basic for Applications.
Results
Patient characteristics
In total, 154,209 patients were identified in the registry data and included for analysis. shows characteristics of the study population. Most patients (57%) were women, born in Sweden (74%), and the mean age at clinical presentation was 50 years. Lumbar pain was by far the most common diagnosis (79%). The mean number of comorbidities according to Elixhauser index was 0.7.
Table 2. Patient characteristics.
Treatment pathway
Most patients are in the conservative care state in the first cycle, whereof most symptoms resolve already at 3 months. Within 3 months after clinical presentation, 93% consume conservative care. An additional 6% visit specialists, potentially for surgical evaluation. Twelve months after clinical presentation, 90.2% have seen their symptoms resolved, 8.8% have received conservative care, 0.5% have undergone surgery or received post-surgical care, and 0.3% have died. After 10 years, 85% of patients are in the state “symptoms resolved”, 7% receive conservative care, and 8% were dead. Other health states have a low proportion of patients.
Costs
Mean lifetime costs are, on average, €47,452, as presented . Pharmaceuticals are the smallest single cost category, with 9% of the total costs; inpatient visits constitute 20% of the costs, outpatient visits 14%, and indirect costs 57%.
Table 3. Average cost and accrued quality adjusted life years (QALYs) and life years, averaged over the whole patient population. QALYs lost are calculated as difference from normal population. All values are discounted.
Quality-of-life
Mean QALYs per patient accrued from the point of clinical presentation were estimated at 14.0, and the number of life years at 18.0 per patient (). The burden of LBP in terms of lost QALYs over the lifetime of the patient as compared with the age and gender matched Swedish population was estimated at 2.7 per patient.
Total societal burden in Sweden
The total lifetime cost of all patients coming to clinical presentation in 1 year in Sweden was estimated at €8.8bn. QALYs lost in the same population were estimated at 505,407. Valuing this at €70,000 per QALY yields a burden of lost QALYs of €35.3bn. The total lifetime costs added together with the intangible cost of lost QALYs yields a total societal burden in Sweden of €44.1bn in patients coming to clinical presentation in 1 year.
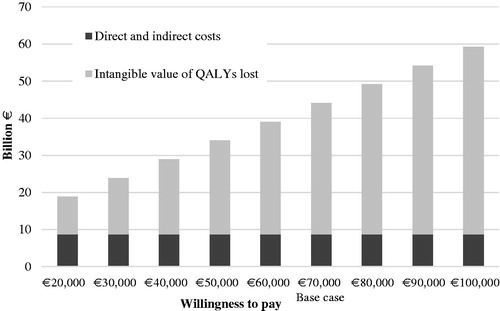
presents the total societal burden in Sweden, including the base case assumption of the value of a QALY and sensitivity analysis of this value. The indirect and direct costs are the same for each of the bars, while the intangible cost varies when using different levels of WTP for the valuation of a QALY.
Figure 2. Sensitivity analysis of total societal burden by level of willingness-to-pay (WTP) used for the valuation of QALYs. Base case WTP is set at €70,000.
Sub-group analysis
The results of sub-group analysis are shown in . Patients who were older when they came to clinical attention accrued fewer QALYs. Results indicate that women had higher total costs compared with men. Also, patients born outside Sweden had, on average, higher costs compared to those born in Sweden. Patients with disc herniation were, on average, the most expensive, followed by patients with other diagnoses than those we specified, and patients with spinal stenosis. This can at least in part be ascribed to differences in age at onset of symptoms for different diagnoses. Patients born outside of Sweden were, on average, more expensive, despite being, on average, younger than Swedish-born patients at the index-point. Lastly, in general, less education was associated with higher costs.
Table 4. Results of sub-group analyses, discounted values. Total costs include direct (outpatient/inpatient visits, pharmaceuticals, surgery) and indirect costs (productivity cost due to work absence), but exclude intangible costs in terms of monetary value of lost QALYs.
Discussion
Summary of findings
The objective of this study was to assess the treatment pathway, quality-of-life, and lifetime costs (both direct costs related to outpatient and inpatient healthcare visits, pharmaceuticals, spine surgery, indirect cost related to productivity loss, and intangible costs related to the loss of QALYs) of patients presenting with low back pain identified from real world data. In the treatment pathway, most patients undergo conservative care without surgical treatment, and their symptoms resolve already within 3 months after clinical presentation. The vast majority of LBP patients do not undergo surgery. The main findings of this study are the heavy economic burden to society, as well as the health-related burden of LBP. The economic cost of LBP per patient was estimated at €47,452, which on a national level amounts to €8.8bn per year. The total societal burden, i.e. the sum of direct and indirect costs and the intangible value of lost QALYs, was estimated as €44.1 billion using a WTP of 70,000 per QALY, with lost QALYs representing more than half of the total societal burden.
Previous studies
Most studies on the cost of LBP use a prevalence-based methodology, examining costs incurred during a given time period such as 1 year, regardless of the timing of onset of diseaseCitation10. In our study, we assessed the lifetime costs in patients from first symptoms, which makes it less accurate to compare our estimated costs with other studies. In 2002, Ekman et al.Citation30 estimated the annual cost of LBP per patient at €20,700 in 2002. On a national level in Sweden, the total cost has previously been estimated at €1,860mn in 2001Citation8 and €3,346mn in persons who were sick-listed for LBP in 1994–1995Citation31. In Australia, Walker et al.Citation9 estimated the total cost at $9.2 billion AUD (Australian dollar) in year 2001. A study in Switzerland in 2005 estimated the direct costs of LBP at €2.5bn and productivity loss at €4.1bn using the human capital approach. In the US, the indirect costs for LBP on a national level has been estimated at $19,800mnCitation32 and $7,400mnCitation33 in 2002 and 2004, respectively. According to our knowledge, no previous studies have assessed the intangible costs related to quality-of-life loss. The health-related burden of LBP has, however, previously been estimated in terms of the disability adjusted life years (DALYs), which is an alternative to QALYs for the measurement of mortality and morbidity, calculated by combining life years lost due to premature mortality and years lived with disability. The Global Burden of Disease estimated the global number of lost DALYs in 2010 to 83 millionCitation34. The methodology included cost components, and definition of LBP varies considerably between studies which may contribute to variation in cost estimates. In line with our estimates, previous studies have indicated that the majority of economic burden of LBP is due to indirect costs. For example, in 2002, Ekman et al.Citation30 estimated that 85% of the annual cost of LBP were indirect costs. Walker et al.Citation9 estimated that 89% of the total costs were indirect costs. The lower share of indirect costs in our study might be due to the fact that we used a control group of people on sick leave and early retirement from the general population, which we consider more accurate. Previous studies have mainly relied on, for example, questionnaires where patients recall for how long they have been on sick leaveCitation10.
To date, no previous studies have investigated the long-term treatment patterns, costs, and quality-of-life of LBP. The estimation of expected costs and health effects of interventions at specific time point within a broader care pathway is perhaps the most commonly applied economic evaluation to directly inform policy decisions. However, “whole disease modeling” with the aim of assessing the lifetime consequences and/or interventions across the entire disease pathway has recently gained more attention. Tappenden et al.Citation35 have developed a methodological framework for “whole disease modeling”. Whilst most economic analyses are piecewise, i.e. involve estimation of costs and health effects in specific points in a broader treatment pathway, our framework allows multiple evaluations of changes in healthcare services. As changes to a specific part of the care treatment pathway may have downstream effects, it is important to ensure that all possible costs and benefits are incorporated in the analysis. Ultimately, such models could inform on how to improve the outcomes and reduce the burden on a population level. A particular challenge with this type of modeling is to represent a complex system of treatment pathways within a single mathematical framework.
Future studies
The model can be populated with data from different regions in Sweden, or from different countries, making it potentially a valuable tool for decision-making in structuring healthcare in regions or countries. Data from other systems need not be in exactly the same format, and can be supplemented with the existing Swedish data or data from published sources where needed, and still provide valuable insights into the burden and its different aspects in various countries.
A potential expansion of the model is also to populate it with data from randomized controlled trials on the efficacy of different interventions. Another potential expansion is to see whether the timing of surgery influences costs and outcomes. For example, using Swespine data, it has been reported that the timing of surgery for lumbar disc herniation is influencing the patient reported QoL, in that patients operated on earlier during the index episode have a higher chance of reporting better QoL at 1-year FUCitation36.
Limitations
This study is not without limitations. Modeling requires an assumption of the cycle length which should be decided using the timing of events in the progress of the disease in question, study question, and available data, among other things. Fixed cycle length affects what type of data needs to be collected and forces existing data into perhaps unrealistic cycles. However, patients in a given cycle do face costs in each of the different cost categories, such that, for instance, patients in inpatient care can also be associated with sick leave cost.
The transition probabilities in the model were based on the analysis of Swedish register data which provide high-quality data on healthcare resource use. One possible limitation with data is that we cannot observe if the LBP symptoms truly had disappeared. Since a patient was assumed to be in the state “symptoms resolved” cycle based on that he or she did not visit healthcare or was on sick leave due to LBP symptoms, the proportion of patients who have their LBP symptoms resolved may to some extent been over-estimated. Another limitation with the register is that some resources were not available in the data. This includes indirect costs related to informal caregiver (e.g. family member), short term sick leave (< 14 days), reduced work capacity at work, and over the counter medicines.
Measuring intangible costs requires an assumption of the value of life, which makes this a particularly challenging cost to measure. This value differs between countries and disease severity among other things. Thus, there exists a number of different standards of the value of QALY. In this study, we used a WTP threshold of €70,000, which corresponds to the lowest interval of the Swedish Dental and Pharmaceutical Benefits Agency WTP for outpatient drugs. In reality, the WTP may be much lower for low back pain treatments. We performed a sensitivity analysis using WTP thresholds ranging from €20,000–€100,000, showing that the total societal burden varies substantially depending on the WTP threshold used, although intangible costs account for more than half of the total societal burden disregarding which threshold is used. The WTP in the model could also easily be altered, depending on different assumptions in different countries.
Conclusion
Using six registries, we present a novel economic model of lifetime treatment pathway based on both societal costs and quality-of-life in patients suffering from LBP. The large size of the underlying dataset, and the sophistication of the model, makes it, according to our knowledge, unique. The model could be used to see broad economic effects of different patterns of healthcare provision, and also to estimate where it is possible to influence these pathways in order to increase utility, both for patients and for the society.
Transparency
Declaration of funding
This study was sponsored by Medtronic.
Declaration of financial/other relationships
GO, EJ, and FB disclose that they received an unrestricted grant from Medtronic for their involvement in this study. The physicians, PF and OH, were not reimbursed.
Research ethics committee
Stockholm ethics vetting committee decision 2013/2225-31/5.
Supplemental material
Download Zip (230.4 KB)Acknowledgement
The authors have no acknowledgements to declare.
Related Research Data
References
- Murray CJ, Lopez AD. Measuring the global burden of disease. N Engl J Med 2013;369:448-57
- Hoy D, Brooks P, Blyth F. et al. Measuring the global burden of low back pain. Best Pract Res Clin Rheumatol 2010;24:155-65
- Freburger JK, Holmes GM, Agans RP. et al. The rising prevalence of chronic low back pain. Arch Intern Med 2009;169:251-8
- Meucci RD, Fassa AG, Paniz VM. et al. Increase of chronic low back pain prevalence in a medium-sized city of southern Brazil. BMC Musculoskelet Disord 2013;14:155
- Stockholm Spine Center. Vårdprogram För Ländryggssmärta [Care Guideline for Low Back Pain]. Stockholm, Sweden: Stockholm Spine Center; 2008
- Bhangle SD, Sapru S, Panush RS. Back pain made simple: an approach based on principles and evidence. Cleve Clin J Med 2009;76:393-9
- Jancuska JM, Hutzler L, Protopsaltis TS. et al. Utilization of lumbar spinal fusion in New York State: trends and disparities. Spine (Phila Pa 1976) 2016;41:1508-14
- Ekman M, Johnell O, Lidgren L. The economic cost of low back pain in Sweden in 2001. Acta Orthop 2005;76:275-84
- Walker BF, Muller R, Grant WD. Low back pain in Australian adults: the economic burden. Asia Pac J Public Health 2003;15:79-87
- Dagenais S, Caro J, Haldeman S. A systematic review of low back pain cost of illness studies in the United States and internationally. Spine J 2008;8:8-20
- Läkemedelsförmånsnämnden [The Dental and Pharmaceutical Benefits Agency]. Läkemedelsförmånsnämndens allmänna råd [The Dental and Pharmaceutical Benefits Agency guidelines]. Stockholm, Sweden: Läkemedelsförmånsnämnden; 2003
- Davis S, Stevenson M, Tappenden P. et al. NICE DSU Technical Support Document 15: Cost-effectiveness modelling using patient-level simulation, R.b.t.D.S. Unit, Editor. Sheffield, UK: Decision Support Unit, ScHARR, University of Sheffield; 2014
- Clement RC, Welander A, Stowell C. et al. A proposed set of metrics for standardized outcome reporting in the management of low back pain. Acta Orthop 2015;86:523-33
- Briggs A, Campbell H, Clarke P. et al. Parametric survival models and decision models: relating continuous hazards to discrete-time transition probabilities 2004. Paper presented to the Health Economists’ Study Group Conference. Glasgow, June 30–July 2, 2004
- Statistics Sweden. Statistikdatabasen - One-year mortality table (per thousand), by age, gender and year. Stockholm, Sweden: Statistics Sweden; 2015. Available at: http://www.statistikdatabasen.scb.se/pxweb/sv/ssd/START__BE__BE0101__BE0101I/LivslangdEttariga/table/tableView-Layout1/?rxid =59d98647-3805-4ea7-ba6a-51c3f6bf44ec
- Burstrom K, Johannesson M, Diderichsen F. Health-related quality of life by disease and socio-economic group in the general population in Sweden. Health Policy 2001;55:51-69
- Västra Sjukvårdsregionen Samverkansnämnden. Utomlänspriser 2016 För vårdtjänster enligt samverkansavtal om hälso- och sjukvård inom Västra sjukvårdsregionen som gäller från 2016-01-01. Göteborg, Sweden: Västra Sjukvårdsregionen Samverkansnämnden; 2016
- Stockholm County Council Healthcare. Förfrågningsunderlag enligt lov vårdval: Ryggkirurgi. Stockholm: Stockholm County Council Healthcare; 2013
- Zhang W, Bansback N, Anis AH. Measuring and valuing productivity loss due to poor health: a critical review. Soc Sci Med 2011;72:185-92
- Statistics Sweden. Average monthly wage. Stockholm, Sweden: Statistics Sweden; 2014. Available at: http://www.statistikdatabasen.scb.se/
- Elixhauser A, Steiner C, Harris DR. et al. Comorbidity measures for use with administrative data. Med Care 1998;36:8-27
- Ekman M. Modelling and data analysis of costs and survival. Stockholm: Stockholm School of Economics; 2002
- Statistics Sweden. Consumer price index. Stockholm, Sweden: Statistics Sweden; 2016. Available at: http://www.scb.se/hitta-statistik/statistik-efter-amne/priser-och-konsumtion/konsumentprisindex/konsumentprisindex-kpi/
- National Board of Health and Welfare. Hälso- och sjukvård Jämförelser mellan landsting [Comparisons between county councils]. Stockholm, Sweden: National Board of Health and Welfare; 2014
- Social Insurance Agency (Försäkringskassan). Antal brutto- och nettodagar sjp rullande 1997–2008. Stockholm, Sweden: Försäkringskassan
- Social Insurance Agency (Försäkringskassan). Sjukersättning och aktivitetsersättning efter beloppstyp. Stockholm, Sweden: Försäkringskassan; 2016. Available at: https://www.forsakringskassan.se/statistik/statistik_och_analys2/Sjuk/sjuk_aktivitetsersattning
- Kobelt G. Health economics: an introduction to economic evaluation. Third edition. London, United Kingdom: Office of Health Economics; 2013
- Svensson M, Nilsson FO, Arnberg K. Reimbursement decisions for pharmaceuticals in Sweden: the impact of disease severity and cost effectiveness. Pharmacoeconomics 2015;33:1229-36
- European Chemicals Agency (ECHA). Guidance on the preparation of socio-economic analysis as part of an application for authorisaton. Helsinki, Finland: ECHA; 2011. Available at: http://echa.europa.eu
- Ekman M, Jonhagen S, Hunsche E. et al. Burden of illness of chronic low back pain in Sweden: a cross-sectional, retrospective study in primary care setting. Spine (Phila Pa 1976) 2005;30:1777-85
- Hansson EK, Hansson TH. The costs for persons sick-listed more than one month because of low back or neck problems. A two-year prospective study of Swedish patients. Eur Spine J 2005;14:337-45
- Stewart WF, Ricci JA, Chee E. et al. Lost productive time and cost due to common pain conditions in the US workforce. JAMA 2003;290:2443-54
- Ricci JA, Stewart WF, Chee E. et al. Back pain exacerbations and lost productive time costs in United States workers. Spine (Phila Pa 1976) 2006;31:3052-60
- Hoy D, March L, Brooks P. et al. The global burden of low back pain: estimates from the Global Burden of Disease 2010 study. Ann Rheum Dis 2014;73:968-74
- Tappenden P, Chilcott J, Brennan A. et al. Whole disease modeling to inform resource allocation decisions in cancer: a methodological framework. Value Health 2012;15:1127-36
- Fritzell P, Hägg O, Jonsson D. et al., Recurrent versus primary lumbar disc herniation surgery: patient-reported outcomes in the Swedish spine register swespine. Clin Orthop Relat Res, 2015. 473(6):1978-84