
Abstract
Aims: To compare healthcare resource utilization and costs between patients aged 18–64 years with osteoarthritis (OA) and matched controls without OA in a privately insured population.
Methods: Patients with OA were selected from de-identified US-based employer claims (Q1:1999–Q3:2011). The index date was defined as the first OA diagnosis indicated by ICD-9-CM codes. One year before and after the index date were defined as the baseline and study periods, respectively. A second OA diagnosis during the study period was also required. Patients with OA were matched one-to-one on age, gender, index date, and minimum length of follow-up to controls without OA. Baseline characteristics and study period resource utilization and costs (2016 USD) were compared between cohorts.
Results: This study identified 199,539 patients with OA (knee: 87,271, hip: 19,953, hand: 15,670, spine: 12,496). The average age was 54 years, and 58% were female. OA patients had higher healthcare resource utilization than matched controls in inpatient, emergency room, and outpatient settings (p < .001 for all). Further, patients with OA had 4-times the excess total medical costs of their matched controls ($14,521 vs $3,629; p < .001). Patients with hip OA had the highest medical costs among all joint locations. Outpatient and pharmacy costs were similar among patients with knee, hip, and hand OA, but higher in patients with spine OA. In sub-group analyses, older patients (45–64 years old) had higher costs.
Limitations: This sample, obtained using claims data, only includes patients who were actively seeking care for OA and were likely symptomatic. Asymptomatic patients would likely not be captured in this analysis.
Conclusions: Patients with OA incur greater healthcare resource utilization and costs than patients without OA, with substantial variation by joint location.
Introduction
Osteoarthritis (OA) is the most common form of arthritis, and affects over 27 million adults in the US, with the median onset of disease at 55 yearsCitation1,Citation2. As a progressive joint disease that can affect any cartilaginous or synovial joint in the body, OA is characterized by degeneration of cartilage and the underlying bone. Symptoms of OA include pain, tenderness, swelling, stiffness, and loss of flexibility. OA is one of the leading causes of disability among US adults, and can diminish a person’s quality-of-life substantiallyCitation3–5. Treatment options for OA, especially non-surgical options, are limited to treatment of pain with non-steroidal anti-inflammatory drugs, other oral analgesics, corticosteroids, hyaluronic acid derivatives, and other pain management drugs; or non-pharmacologic options such as physical therapy, weight loss, bracing, and orthoticsCitation6,Citation7. Joint surgeries, such as primary joint arthroplasty, are typically performed in patients with end-stage OA, especially patients with knee or hip OACitation8.
Patients with OA utilize more healthcare resources and incur higher costs than patients without OA due to the high level of physical impairment associated with this diseaseCitation9–12. Prior studiesCitation13 have shown that healthcare costs of patients with OA are 2.5–3.5-times greater than those of patients without OA, with annual costs ranging between $7,889 (2001 USD) and $18,435 (2008 USD) for patients with OA9–12. While these studies characterized the overall burden of OA, previous research has shown that progression, impact on daily activities, and the quality-of-life of patients with OA can vary by jointCitation14. Additionally, the prevalence of pain, even with similar radiographic scores, differs between patients with hip and knee OACitation15. Hawker et al.Citation16 report differences in Western Ontario and McMaster Universities Arthritis Index (WOMAC) and Short Form 36 (SF-36) general scores among patients with hip and knee OA undergoing total joint arthroplasty (WOMAC: 48.2 vs 45.6; SF-36: 54.0 vs 42.4). Additionally, Perruccio et al.Citation14 have found varying levels in patient reported outcomes (PROs), such as fatigue, anxiety, depression, pain, and physical function across patients with OA affected at different joints in the body. This could be attributed to a variety of factors, including joint size or whether the joint is weight-bearing. Given this varying disease progression and physical activity impairment, it is likely that the economic burden of OA also varies across joint locations. In addition, variance by age is possible, as older patients may have more severe OA and, therefore, incur more surgery-related costs.
To date, there are few studies investigating the burden of OA by age and joint locationCitation17,Citation18. This study examines the two most prevalent joint locations, hip and knee, as well as two of the more challenging to treat, hand and spine. The objective of this study was to address this gap in the literature by characterizing the economic burden of OA from a private payer’s perspective. This study used an administrative claims database of privately insured beneficiaries to descriptively compare the overall annual burden of OA with patients without OA, with the burden of OA stratified by age and joint location—in particular, OA among patients aged 18–44 years and 45–64 years, as well as patients with OA in the knee, hip, hand, and spine.
Methods
Data source
The study sample was selected from a de-identified administrative claims database (OptumHealth Care Solutions, Inc., Eden Prairie, MN) covering ∼15.5 million privately insured employees and their dependents from 60 large companies in the US. The companies have operations nationwide in a broad array of job classifications and industries (e.g. financial services, manufacturing, telecommunications, energy, food, and beverage). The analysis used health services provided from the beginning of 1999 to the third quarter of 2011. The 18–64 years old population in the database that is not covered by Medicare for whom there are complete medical and pharmacy claims includes ∼10 million beneficiaries. The data include demographic and enrollment information, medical claims (including diagnosis and procedure codes), pharmacy claims, and payment amounts for all of the companies’ beneficiaries (i.e. employees, spouses, dependents, and retirees) nationwide.
Sample selection
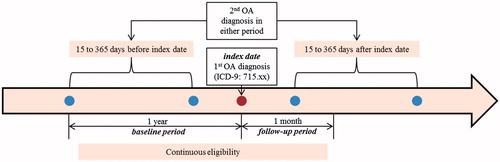
Patients with OA (i.e. OA cohort) were identified using the International Classification of Diseases, 9th Revision, Clinical Modification (ICD-9-CM) code 715.xx and were required to have at least two OA diagnosis codes on different dates. This approach is consistent with that of previous studiesCitation9,Citation19. Other factors, such as laboratory data or imaging, were not considered to identify a diagnosis of OA, due to either their unavailability or the possibility of a rule-out diagnosisCitation11. The index date was defined as the first OA diagnosis with 1 year of continuous insurance coverage prior to (baseline period) and at least 1 year following the OA diagnosis (follow-up period). To confirm that patients had OA, a second OA diagnosis 15 days to 1 year before/after the index diagnosis was requiredCitation11 (). The comparison group was selected from patients without OA (the non-OA cohort) who were required to have no OA diagnosis codes in their medical histories. Their index date was selected as a random medical claim with similar insurance eligibility requirements as the OA cohort. Patients in the OA cohort were matched 1:1 to patients in the non-OA cohort based on index date (±3 months), age at index date (±1 year), gender, and equivalent insurance coverage following the index date.
Figure 1. Sample selection for OA cohort. OA cohort patients were required to have at least two OA diagnoses codes (the ICD-9-CM code 715.xx) on different dates. Patients must have an OA diagnosis, defined as the index date, with 1 year of continuous eligibility prior to and 1 month after the OA diagnosis. One year prior to OA diagnosis was defined as baseline period and 1 year following the OA diagnosis as follow-up period. Further, patients require a second OA diagnosis within 1 year of the index date, but not within 15 days of the index diagnosis. OA, osteoarthritis; ICD-9-CM, International Classification of Diseases, Ninth Revision, Clinical Modification.
The overall OA population was assessed as well as OA sub-populations defined according to age and joint location. This study focused on a working age population (age 18–64); the age sub-groups examined in this paper were 18–44 and 45–64 years old. Joint location sub-populations for the knee, hip, spine, and hand were defined using the ICD-9-CM diagnosis codes specified in Supplementary Table 1. Claims associated with the joint location could occur on the index date or during the baseline period. Because patients could have claims for multiple joint locations, patients in these sub-analyses could be categorized into more than one joint location sub-group.
Baseline characteristics and outcomes
Baseline characteristics included age, gender, health plan, index date, length of follow-up, Charlson Comorbidity IndexCitation20, and other selected comorbidities, such as hypertension and depression, which were identified using ICD-9-CM codes (see Supplementary Table 2).
Healthcare resource utilization was evaluated during the follow-up period and included inpatient, emergency room (ER), outpatient, and other visits. Inpatient stays included claims with place of service specified as hospital inpatient, rehabilitation center, psychiatric facility, or residential treatment center. OA-related surgery stays, which included primary and revision arthroplasty, arthrodesis, osteotomy, arthrotomy, and arthroscopy, were captured using ICD-9-CM procedure and CPT codes (see Supplementary Table 3). ER visits were identified as claims with the place of service indicated as an emergency treatment center or hospital emergency room, or had an emergency room-related CPT code. Outpatient and other visits were further broken down into primary care visits, rheumatologist visits, orthopedist visits, physical or occupational therapy visits, chiropractor visits, steroid injections, lubricant injections (hyaluronic acid injections), and OA-related surgery (arthrodesis, primary joint arthroplasty, revision joint arthroplasty, arthroscopy, osteotomy, and arthrotomy), and other medical services. Pharmacy drug use was reported overall and for OA-related (Cox-II inhibitors, other NSAIDs, or opioids) prescriptions based on NDC codes. Total healthcare costs, which included medical and pharmacy costs, were defined as the payments to providers by third-party reimbursement, and copayments were not included in the estimation of costs. All costs were inflated to 2016 US dollars using the consumer price index medical component.
Statistical analysis
Baseline characteristics were compared between the OA cohort and the matched controls from the non-OA cohort using Wilcoxon signed-rank tests for continuous variables and McNemar’s tests for categorical variables. Medical and pharmacy resource utilization and costs during the follow-up period, specifically the proportion of patients with at least one visit in each place of service, the mean number of visits, and mean healthcare costs, were descriptively compared between the OA cohort and matched controls using Wilcoxon signed-rank tests for continuous variables and McNemar’s tests for categorical variables. Descriptive comparisons of the total medical and pharmacy resource utilization and costs were performed for the overall OA population and OA sub-population. All statistical analyses were performed using SAS 9.3 (SAS Institute, Inc., Cary, NC).
Results
Sample selection
From January 1, 1999 through September 30, 2011 there were 1,020,981 patients with at least two OA diagnoses. Among those eligible, 199,539 patients from the OA cohort were matched to patients in the non-OA cohort.
Baseline characteristics
The mean age was 53.9 years, and females comprised 58% of both the OA and non-OA cohort (). The mean length of follow-up was greater among those without OA compared to those with OA (5.0 vs 4.1 years, p < .001). The OA cohort had a higher Charlson Comorbidity Index score (0.6 vs 0.3, p < .001) and higher rates of comorbidities such as hypertension (37% vs 22%, p < .001), diabetes (10% vs 6%, p < .001), depression (9% vs 4%, p < .001), and rheumatologic disease (5% vs 1%, p < .001). Patients with OA experienced the symptoms in multiple locations, with the knee being the most common site of OA (44%), followed by hip (10%), shoulder (9%), hand (8%), ankle/foot (7%), and spine (6%).
Table 1. Baseline characteristics among 18–64 year olds.
Study period healthcare resource utilization and costs
Annual medical resource utilization was significantly greater in the OA cohort compared to the non-OA cohort (p < .001 for all comparisons, ). Among patients with OA, 25% had at least one inpatient stay in the first year following the index date (vs 6% in the non-OA cohort, p < .001). During the study period, 82% of patients with OA had at least one primary care visit (vs 58%, p < .001), 11% had at least one rheumatologist visit (vs 1%, p < .001), 63% had at least one orthopedist visit (vs 5%, p < .001), and 38% had at least one physical therapy or occupational therapy visit (vs 7%, p < .001). Eighty-eight per cent of patients with OA used at least one prescription drug during the study period, compared to 68% of their matched controls (p < .001). The number of visits across various settings was also significantly higher among the patients with OA as compared to their matched controls, with outpatient visits being the most frequent setting (23.7 vs 7.8 visits annually, p < .001).
Table 2. One-year healthcare resource utilization among 18–64 year olds with or without OA.Table Footnotea
The OA cohort incurred significant excess medical and pharmacy costs than the non-OA cohort during the study period (p < .001 for all comparisons; ). The total per-patient annual medical cost in the OA-cohort was 4-times in excess the total per-patient annual medical cost in the non-OA cohort ($14,521 vs $3,629, p < .001). Inpatient costs contributed 41% of the total medical cost ($5,940) among those with OA, while outpatient costs accounted for 57% of the total medical cost ($8,264) and ER visit costs accounted for 2% of the total medical cost ($317). The mean total prescription drug cost during the study period was $2,543 among patients with OA. However, only 13% of this cost was attributed to OA-related prescription drug use ($335).
Table 3. One-year healthcare costs among 18–64 year olds with or without OA.Table Footnotea
Burden by joint location
The burden of OA in the four OA joint locations considered in this study has been presented in and Supplementary Tables 4–7. Total medical costs during the study period among those with hip OA were $23,272, for spine OA were $19,551, for knee OA were $15,599, and for hand OA were $10,112. This was largely attributed to high inpatient medical costs of $14,542, $7,889, $6,922, and $2,167 for hip, spine, knee, and hand OA, respectively. Costs for inpatient OA-surgery related inpatient stays were also high for all joints, namely hip ($11,209), spine ($4,485), knee ($4,518), and hand ($713).
Figure 2. Total 1-year medical, inpatient, outpatient, and pharmacy costs by joint location (knee [n = 87,271], hip [n = 19,953], hand [n = 15,670], and spine [n = 12,496]) among OA patients. All costs were inflated to 2016 USD using annual medical care consumer price index (CPI) data from the Bureau of Labor Statistics. Total medical costs are equal to the sum of inpatient, outpatient, and emergency department costs. OA, osteoarthritis.
![Figure 2. Total 1-year medical, inpatient, outpatient, and pharmacy costs by joint location (knee [n = 87,271], hip [n = 19,953], hand [n = 15,670], and spine [n = 12,496]) among OA patients. All costs were inflated to 2016 USD using annual medical care consumer price index (CPI) data from the Bureau of Labor Statistics. Total medical costs are equal to the sum of inpatient, outpatient, and emergency department costs. OA, osteoarthritis.](/cms/asset/c24703fb-6442-4ef8-9b1a-3bdf746a6b14/ijme_a_1377717_f0002_c.jpg)
Outpatient medical costs were also high in patients with hip, knee, and hand OA, at $8,396, $8,356, and $7,651, respectively. Pharmacy costs for these joint locations were $2,438, $2,466, and $2,612, respectively. Patients with spine OA also had high outpatient ($11,141) and pharmacy ($3,747) costs. Costs also varied by specific sub-category of outpatient costs. Cost for outpatient services varied by type of service: for orthopedist visits ($553, $713, $923, and $590), physical or occupational therapy visits ($562, $649, $495, and $349), primary care visits ($481, $634, $465, and $468), and rheumatologist visits ($67, $137, $85, and $171) in patients with hip, spine, knee, and hand OA, respectively.
The total prescription costs were high across all four joint locations, with ∼12–18% of the costs attributable to the OA-related drugs ($332, $680, $314, and $303 for patients with hip, spine, knee, and hand OA, respectively).
Burden by age group
Total medical costs were $14,827 in patients with OA aged 45–64 (n = 172,417) and $12,577 in patients with OA aged 18–44 years (n = 27,122) ( and Supplementary Tables 8 and 9). These high costs could be attributed to higher inpatient OA-related surgery costs of $3,801 in those aged 45–64 years, and $1,919 among those aged 18–44 years. Outpatient costs in OA patients aged 18–44 years were $8,191, with high costs for orthopedist ($851), physical or occupational therapy visits ($510), primary care visits ($445), and rheumatologist visits ($113). Similar costs were observed in patients aged 45–64 years ($715, $458, $483, and $96, respectively). In patients aged 18–44, the total pharmacy costs were $2,079, with ∼16% attributed to OA-related drugs. Similarly, for patients aged 45–64 years, ∼ 13% of the total pharmacy costs ($2,616) were attributed to OA-related drugs.
Figure 3. Total 1-year medical, inpatient, outpatient, and pharmacy costs by age group (18–44 years old [n = 27,122] and 45–64 years old [n = 172,417]) among OA patients. All costs were inflated to 2016 USD using annual medical consumer price index (CPI) data from the Bureau of Labor Statistics. Total medical costs are equal to the sum of inpatient, outpatient, and emergency department costs. OA, osteoarthritis.
![Figure 3. Total 1-year medical, inpatient, outpatient, and pharmacy costs by age group (18–44 years old [n = 27,122] and 45–64 years old [n = 172,417]) among OA patients. All costs were inflated to 2016 USD using annual medical consumer price index (CPI) data from the Bureau of Labor Statistics. Total medical costs are equal to the sum of inpatient, outpatient, and emergency department costs. OA, osteoarthritis.](/cms/asset/97b16e54-ebd2-4421-8f7f-751a822a8ec6/ijme_a_1377717_f0003_c.jpg)
Discussion
This study characterized the annual economic burden of OA in terms of healthcare costs and resource utilization, and established that the economic burden among patients with OA is substantial when compared to patients without OA. Patients with OA included in this study had 4-times greater total annual per-patient medical cost during the study period compared to patients without OA, amounting to an excess cost burden of $10,892 per year (p < .001). Using a prevalence estimate of 27 million patients with OA in the US, this difference results in over $294 billion US dollars annually attributed to the burden of OACitation1. This increased burden was observed in inpatient and outpatient medical settings and for pharmacy costs as well.
There was substantial economic burden of OA in all joint locations. Because patients had OA in multiple joints, the joint-specific sub-group results better represent total costs and resource utilization associated with patients who have OA in each joint, rather than the costs and resource utilization attributable to OA in a particular joint. High total medical costs were largely due to high OA-related inpatient costs (particularly surgery). The high surgery costs for hip and knee OA patients is consistent with higher incidence of surgery for knee, hip, and hand OA patients seen in the literatureCitation21. Outpatient costs across all joint locations were driven by specific components such as specialist visits (orthopedist, rheumatologist) or patients seeking physical or occupational therapy for OA in their joints. The OA-related drug costs were also high and contributed more than 12% of the total drug costs across all four joints. In addition, sub-group analysis by age group demonstrated increasing total medical costs for OA patients with age. The primary cost driver in both the groups, particularly in older patients, were high inpatient/surgery costs, which may be due to older patients having more severe disease that is likely to result in surgery.
The assessment of the economic burden of OA in this sample is similar to previous studies that also examined the burden of OA from a private payers perspective using an administrative claims databaseCitation9–11,Citation22. Our estimated inpatient cost of $5,940 during the study period was lower than the estimates of $8,493 and $10,192 provided by Le et al.Citation11 and Berger et al.Citation10, respectively, but higher than the estimates of $5,142 and $4,580 provided by Gore et al.Citation9 and White et al.Citation22, respectively (all costs inflated to 2016 USD). Differences could be due to several factors, such as the time period included in the study and differences in sample selection. For example, the study by Berger et al.Citation10 identified patients with OA during the calendar year of 2007, while we selected the first OA diagnosis with 1-year of continuous eligibility prior to the diagnosis, possibly representing patients with less severe OA. Our estimated outpatient cost of $8,264 was similar to the estimate provided by Berger et al.Citation10 ($9,414), and in general the distribution of inpatient, outpatient, and prescription drug costs from our study is similar to previous studies. In line with these results, in a recent systematic literature review, annual medical direct costs per patient in North America were $9,333 (converted to 2016 USD) for OA (all types) and $13,930 (converted to 2016 USD) for hip and knee OACitation13. Additionally, the burden of OA, as estimated in this study, is similar to the burden of other types of arthritis, such as rheumatoid arthritis. Studies have reported annual per-patient annual costs for rheumatoid arthritis patients ranging from $4,693–$23,373, with the mean reported as $11,622, which is similar to the results obtained in this studyCitation23.
One of the unique aspects of this study is that it estimated the economic burden of OA by specific sub-populations, including joint location and age. To our knowledge no study has estimated the inpatient, outpatient, and prescription drug costs among patients with OA for all four joint locations (knee, hip, hand, and spine) using the same data source. A study by Wright et al.Citation24 examined the impact of knee OA on healthcare resource utilization using Medicare data, but no cost estimates were provided. Another study by Dunn and PillCitation25 examined the healthcare charges by joint location and the presence of surgery during that year. However, the charges by joint location were not attributed to specific categories such as inpatient, outpatient, or emergency department. Also, because the paper by Dunn and PillCitation25 reported charges, rather than costs, it is difficult to compare overall estimates by joint location.
Despite its strengths, this study does have some limitations. First, although we matched the OA cohort and non-OA cohort on demographic characteristics, there may be unobserved differences (e.g. health behaviors not captured in insurance claims data or use of OTC medications) that may affect results. Second, due to the nature of administrative claims databases, the sample only includes patients who are seeking care for OA and are likely symptomatic. Asymptomatic patients would likely not be captured in this analysis. Also, because the data relate to privately insured employees, the results may not be generalizable to other segments of the US population, such as Medicaid or Medicare beneficiaries. Lastly, it should be noted that the data used in this study are from 1999–2011. However, since no novel treatments have been approved for OA after 2011, the management of OA is unlikely to have undergone significant changes since thenCitation26. For this reason, the results presented here are expected to be relevant to the current OA patient population in the US.
Conclusions
This study found that patients with OA have a higher economic burden than those without OA, with average per-patient annual differences of $10,892 and overall annual costs of OA across the US of over $294 billion. The cost of OA is high across all joint locations and largely attributable to utilizing more OA-related inpatient services. Further studies investigating the burden of OA in terms of indirect costs (e.g. costs associated with loss of productivity and caregiver costs), burden for patients over the age of 65 using Medicare databases, as well as factors contributing to variation of costs across joint locations could contribute significantly to the literature.
Transparency
Declaration of funding
This study was funded by AbbVie, Inc. However, no restrictions were placed by AbbVie on the design of the study, data collection, interpretation of results, writing of the manuscript, and the decision to submit this manuscript for publication.
Declaration of financial/other relationships
ARB, JKM, and AXG are employees of AbbVie, Inc. SXW was an employee of AbbVie, Inc. at the time of this research. DSM and WMR are employees of Analysis Group, Inc., which received a consultancy fee from AbbVie, Inc. to conduct this study. JME peer reviewers on this manuscript have no relevant financial or other relationships to disclose.
Supplementary_Material
Download MS Word (39.2 KB)Acknowledgments
No assistance in the preparation of this manuscript is to be declared.
Related Research Data
References
- Lawrence RC, Felson DT, Helmick CG, et al. Estimates of the prevalence of arthritis and other rheumatic conditions in the United States. Part II. Arthritis Rheum 2008;58:26-35
- Losina E, Weinstein AM, Reichmann WM, et al. Lifetime risk and age of diagnosis of symptomatic knee osteoarthritis in the US. Arthritis Care Res (Hoboken) 2012;65:703-11
- Breedveld FC. Osteoarthritis—the impact of a serious disease. Rheumatology (Oxford) 2004;43(Suppl1):i4-8
- Guccione AA, Felson DT, Anderson JJ, et al. The effects of specific medical conditions on the functional limitations of elders in the Framingham Study. Am J Public Health 1994;84:351-8
- Reginster JY. The prevalence and burden of arthritis. Rheumatology (Oxford) 2002;41(Supp1):3-6
- Mushtaq S, Choudhary R, Scanzello CR. Non-surgical treatment of osteoarthritis-related pain in the elderly. Curr Rev Musculoskelet Med 2011;4:113-22
- Brandt K. Non-surgical treatment of osteoarthritis: a half century of “advances”. Ann Rheum Dis 2004;63:117-22
- Kahn TL, Soheili A, Schwarzkopf R. Outcomes of total knee arthroplasty in relation to preoperative patient-reported and radiographic measures: data from the osteoarthritis initiative. Geriatr Orthop Surg Rehabil 2013;4:117-26
- Gore M, Tai KS, Sadosky A, et al. Clinical comorbidities, treatment patterns, and direct medical costs of patients with osteoarthritis in usual care: a retrospective claims database analysis. J Med Econ 2011;14:497-507
- Berger A, Hartrick C, Edelsberg J, et al. Direct and indirect economic costs among private-sector employees with osteoarthritis. J Occup Environ Med 2011;53:1228-35
- Le TK, Montejano LB, Cao Z, et al. Health care costs in US patients with and without a diagnosis of osteoarthritis. J Pain Res 2012;5:23-30.
- Mapel DW, Shainline M, Paez K, et al. Hospital, pharmacy, and outpatient costs for osteoarthritis and chronic back pain. J Rheumatol 2004;31:573-83
- Salmon JH, Rat AC, Sellam J, et al. Economic impact of lower-limb osteoarthritis worldwide: a systematic review of cost-of-illness studies. Osteoarthritis Cartilage 2016;24:1500-8
- Perruccio AV, Power JD, Evans HM, et al. Multiple joint involvement in total knee replacement for osteoarthritis: effects on patient-reported outcomes. Arthritis Care Res (Hoboken) 2012;64:838-46
- Arden N, Nevitt MC. Osteoarthritis: epidemiology. Best Pract Res Clin Rheumatol 2006;20:3-25
- Hawker GA, Badley EM, Borkhoff CM, et al. Which patients are most likely to benefit from total joint arthroplasty? Arthrit Rheum 2013;65:1243-52
- Litwic A, Edwards M, Dennison E, et al. Epidemiology and burden of osteoarthritis. Br Med Bull 2013;105:185-99
- Cross M, Smith E, Hoy D, et al. The global burden of hip and knee osteoarthritis: estimates from the global burden of disease 2010 study. Ann Rheum Dis 2014;73:1323-30
- Peng X, Wu N, Chen SY, et al. Utilization of duloxetine and celecoxib in osteoarthritis patients. Curr Med Res Opin 2013;29:1161-9
- Romano PS, Roos LL, Jollis JG. Adapting a clinical comorbidity index for use with ICD-9-CM administrative data: differing perspectives. J Clin Epidemiol 1993;46:1075-9; discussion 81–90
- Kurtz S, Ong K, Lau E, et al. Projections of primary and revision hip and knee arthroplasty in the United States from 2005 to 2030. J Bone Joint Surg Am 2007;89:780-5
- White AG, Birnbaum HG, Janagap C, et al. Direct and indirect costs of pain therapy for osteoarthritis in an insured population in the United States. J Occup Environ Med 2008;50:998-1005
- Cooper NJ. Economic burden of rheumatoid arthritis: a systematic review. Rheumatology 2000;39:28-33
- Wright EA, Katz JN, Cisternas MG, et al. Impact of knee osteoarthritis on health care resource utilization in a US population-based national sample. Med Care 2010;48:785-91.
- Dunn JD, Pill MW. A claims-based view of health care charges and utilization for commercially insured patients with osteoarthritis. Manag Care 2009;18:44-50
- Zhang W, Ouyang H, Dass CR, et al. Current research on pharmacologic and regenerative therapies for osteoarthritis. Bone Res 2016;4:15040