
Abstract
Background: The increase in hospital acquisition of community oncology clinics in the US has led to a shift in the site-of-care (SOC) for infusion therapy from the physician office (PO) to the hospital outpatient (HO) setting.
Objective: To investigate differences by SOC in treatment patterns, quality, and cost among patients with cancer undergoing first-line infusion therapy.
Research design and methods: This retrospective analysis identified adult patients from Humana medical claims who initiated infusion therapy from 2008–2012 for five common cancer types in which infusion therapy is likely, including early stage breast cancer; metastatic breast, lung, and colorectal cancers; and non-Hodgkin’s lymphoma or chronic lymphocytic leukemia. Differences by SOC in first-line treatment patterns and quality of care at end-of-life, defined as infusions or hospitalizations 30 days prior to death, were evaluated using Wilcoxon-Rank Sum and Chi-square tests where appropriate. Differences in cost by SOC were evaluated using risk-adjusted generalized linear models.
Main outcome measures: Treatment patterns, quality of care at end of life, healthcare costs.
Results: There were differences in duration of therapy and number of infusions for some therapy regimens by SOC, in which patients in the HO had shorter duration of therapy and fewer infusions. There were no differences in quality of care at end-of-life by SOC. Total healthcare costs were 15% higher among patients in HO ($55,965) compared with PO ($48,439), p < .0001.
Limitations: Analyses was restricted to a claims-based population of cancer patients within a health plan.
Conclusion: This study, in an older, predominantly Medicare Advantage oncology cohort, found differences by SOC in treatment patterns and cost, but not quality. Where differences were found, patients receiving care in the HO had shorter duration of therapy and fewer infusions for specific treatment regimens, but higher healthcare costs than those treated in a PO.
Introduction
The increase in hospital acquisition of community oncology clinics in the US has led to a shift in the site-of-care for oncology infusion therapy from the physician office to hospital outpatient settingsCitation1. According to the Community Oncology Alliance 2011 report, 40.6% of 1,042 community practices had been acquired by hospitals or merged/acquired by another organization, resulting in an increase in hospital owned oncology practicesCitation2. This evolving environment influences both the treatment patterns and the cost of oncology infusion therapyCitation3. Patients receiving infusions in the hospital outpatient setting were found to have fewer infusions compared to patients in the physician outpatient settingCitation4,Citation5; however, the cost of these infusions was higher in the hospital outpatient setting. In the US, chemotherapy costs were 24% higher in a hospital-based outpatient setting than in an independent oncology physician officeCitation1. This difference in cost persists even after accounting for treatment duration. Previous studies have highlighted this site-of-care (SOC) cost difference in commercially insured oncology populations, or they focused on specific cancer typesCitation4–8. In this study, we investigated whether differences in cost and treatment duration by SOC were evident in a predominantly Medicare Advantage population. We also delved into cancer treatment patterns for multiple cancer types by SOC. This analysis extends the generalizability of previous studies by enhancing our ability to determine if differences in treatment and cost by SOC are unique to a specific cancer type, or if the findings are consistent across cancer types. This study also provides a unique perspective on quality of care at end-of-life by site-of-care for oncology infusion therapy.
Methods
Design and data source
This was a retrospective, observational cohort study of patients with cancer undergoing chemotherapy or biologic oncology infusion therapy, and was conducted using the Humana Research Database. Humana is a health and well-being company serving millions of people across the country through Medicare Advantage, stand-alone Prescription Drug, and commercial plan offerings. The study was approved by an independent institutional review board. Differences by SOC were described in the following four areas: (1) baseline demographic, clinical and disease characteristics; (2) cancer treatment patterns; (3) hospitalizations and treatment at end-of-life; and (4) all-cause health services utilization and costs. Five common cancer types, where infusion therapy is likely, were included: early stage breast cancer (eBC), metastatic breast cancer (mBC), metastatic lung cancer (mLC), metastatic colorectal cancer (mCRC), and Non-Hodgkin’s Lymphoma or Chronic Lymphocytic Leukemia (NHL/CLL).
Patient data from January 1, 2007 through December 31, 2013 for patients with Medicare Advantage or commercial health plan coverage with a pharmacy benefit were used. Patients were eligible for study inclusion if they had ≥2 of any type of medical claim for inpatient, outpatient, or professional services with Healthcare Common Procedure Coding System or Current Procedural Terminology codes, indicating receipt of National Comprehensive Cancer Network (NCCN) guideline recommended chemotherapy and biologic therapy infusions between January 1, 2008 and December 31, 2012. The date of the first infusion during this identification period was considered the index infusion date. Patients were required to have a diagnosis of one of the five cancers of interest. Patients with a metastatic cancer diagnosis were identified by at least two metastatic ICD-9-CM codes (196.0x–196.1x, 196.3x–196.5x, 196.8x, 197.0x–197.3x, 197.xx, 198.xx) occurring at most 60 days apart any time between 180 days prior to and up to 120 days after their index infusion date. Primary cancers associated with the metastatic codes were identified by two or more primary cancer ICD-9-CM codes [breast (174.xx), colorectal (153.xx, 154.xx), lung (162.2x–162.9x, 163.xx)] occurring at least 30 days apart within a 5 year period prior to or within 90 days following the first metastatic code occurrence. Patients diagnosed with eBC or NHL/CLL (the two non-metastatic cancers under study) were identified by ≥2 medical claims with diagnosis of breast cancer, NHL or CLL (International Classification of Diseases, Ninth Revision, Clinical Modification (ICD-9-CM) diagnosis code [breast cancer (174.xx), NHL (200.xx, 202.xx), CLL (204.10, 204.12)] occurring at least 30 days apart, between 180 days prior to and up to 120 days after the patient’s respective index infusion date.
The pre-index (baseline) period was defined as a minimum of 6 months prior to the patient’s index infusion date. The post-index (follow-up) period was defined as the latter of death during the follow-up period, disenrollment date, therapy end date, or study end date. There was no statistical difference in follow-up time by SOC for all cancers except eBC and mCRC (). Patients in the physician office setting had slightly more follow-up months than those in the hospital outpatient setting. However, with median follow-up time of >1 year, the difference in follow-up likely impacted the outcome measures marginally. The guideline recommended first-line therapy for a majority of non-biologic therapies is typically completed within 2–4 months, and within 12 months for biologic therapiesCitation9.
Table 1. Follow-up month comparisons by site-of-care, all cancers.
All patients were aged 18–89 at index infusion date in all states except Alabama, Nebraska, and Delaware, where patients aged <20 years were excluded in accordance with state age of majority. Patients were continuously enrolled in the health plan for 6-months prior to their index infusion date and at least 6 months following their index infusion date. Patients with less than 6 months of follow-up time due to death in the post-index period were included in the study.
Patients were excluded from the study if they switched from commercial insurance to a Medicare Advantage plan during the study period; they did not receive ≥90% infusion therapy at a single SOC type; they were males with breast cancer; they met criteria for inclusion in multiple cancer study cohorts for mLC, mCRC, mBC, or NHL/CLL during the identification period, except those meeting criteria for both eBC and mBC; or they had evidence of neoplasms other than the primary cancers of interest (within the post-index period with the exception of benign tumors, carcinoma in situ, non-melanoma skin cancer, and other metastatic codes).
Measures
Patient designation to hospital outpatient or physician office settings was based on place of treatment codes associated with medical claims for cancer-related infusion therapy. Infusions for hydration, emesis control, or transfusion that occurred only in the hospital outpatient or physician office setting were considered in the designation of a patient to a SOC cohort, since the goal was to capture where a patient received most of their cancer- related infusions. A threshold of ≥90% of qualifying claims in either setting was required to designate the SOC. Demographic characteristics considered were patient age at time of index infusion, sex and geographic region based on the patient’s state of residence at index. Race/ethnicity was available only for patients with a Medicare Advantage plan. States were classified in regions based on census classifications.
Low-income subsidy status and Medicare dual-eligibility for Medicaid were assessed using information obtained from the Center for Medicare and Medicaid Services (CMS). The low-income subsidy indicator pertains to patients with Medicare only and indicates receipt of a Medicare Part D subsidy for the patient’s portion of the premium. Dual-eligibility for Medicaid and Medicare is indicative of disability and is a proxy for low-income status. Comorbidity status was defined using the Deyo-Charlson Comorbidity Index, which uses 17 categories of comorbidities based on ICD-9 diagnosis and procedure codes to estimate cumulative likelihood of 12-month mortality. A higher score indicates greater comorbidityCitation10.
First-line therapy regimens were defined as the class of chemotherapeutic or biologic agents administered on the index infusion date (+7 days) for mBC, mLC, mCRC, NHL/CLL, and index infusion date (+120 days) for eBC to allow for trastuzumab therapy initiation. If patients met inclusion in multiple classes of therapy, the patient was placed in categories by hierarchy of treatment. The hierarchy of inclusion is indicated in . Patients meeting inclusion criteria in a preceding group were not considered for inclusion in subsequent groups (e.g. for eBC patients the order of inclusion was Biologic only, Biologic and cytoxic, Anthracycline and taxane, Anthracycline and no taxane, Taxane and no anthracycline, Other).
Table 2. Site-of-care comparisons of first-line therapy drug classes by cancer type.
Table 3. Site-of-care comparisons of duration of first-line therapy in days among cancer types.
Table 4. Site-of-care comparisons of number of infusions during first-line therapy among cancer types.
Descriptors of treatment characteristics including duration of first-line therapy and number of infusions were evaluated by SOC. Duration of first-line therapy was computed in days as [(first-line therapy end date) – (first-line therapy start date) + 1]. First-line therapy start date (infusion index date) was defined as the date of the first eligible drug administration occurring in the study period, while first-line therapy end date was defined as the 30 days after a patient’s last eligible drug administration occurring prior to a gap in eligible drug therapy of ≥90 days during the study period for all cancers except the NHL/CLL cohort. For the NHL/CLL cohort, the gap in eligible drug therapy allowed was ≥210 days instead of ≥90 days, to accommodate for the maintenance phase period of rituximab therapy. Given the considerable variation in guideline recommendations on the number of infusions and length of therapy for various treatment regimens, present results separately by regimen for each cancer type.
Table 5. Baseline comparisons by site-of-care, all cancers.
Quality of care at the end of life was evaluated for patients with a Medicare Advantage health plan, since date of death was not available for commercially insured patients. The quality of care measures included: all-cause hospitalizations and cancer therapy infusions within the last 30 days of life for patients who died during the follow-up period.
Measures of all-cause medical utilization included hospital inpatient visits, physician office visits, outpatient visits (excluding physician office visits) and emergency room (ER) visits. Utilization measures were assessed in the 6-month pre-index and post-index periods. All-cause total healthcare cost was computed as the sum of all medical and pharmacy costs occurring in the 6 month post-index period. Total oncology-related healthcare cost includes costs accrued at all places of service for oncology related care including surgical procedures, infusions and infusion administration, radiation, diagnostics, imaging and inpatient confinements, as identified by CPT and ICD-9 codes, and was defined as the sum of all medical and pharmacy costs related to oncology treatment in the 6 month post-index period. All cost measures included costs incurred by both the patient and the health plan.
Statistical analysis
Differences between SOC cohorts were evaluated by Chi-square tests (categorical measures), t-tests, and Wilcoxon-Rank Sum tests (continuous measures) where appropriate. Measures of mean with standard deviation and median with interquartile ranges are provided by SOC within tables presenting duration of therapy and number of infusions by line of therapy. Generalized linear models (GLM) with log link and gamma variance functions were used to control for the impact of patient severity differences by SOC on healthcare costs. Factors found to differ in bivariate analysis by cancer type were covariates in the model and included: age, sex, Deyo Charlson Comorbidity Index, geographic region, first-line therapy drug class, and total healthcare costs in the 6 month pre-index period.
Results
Baseline information
A total of 10,586 patients met the study inclusion criteria. Among these patients were 2,784 (26.3%) with eBC, 1,602 (15.1%) with mBC, 3,199 (30.2%) with mLC, 1,142 (10.8%) with mCRC, and 1,859 (17.6%) with NHL/CLL ().
Figure 1. Patient selection and attrition table. Abbreviations. eBC, Early stage breast cancer; NHL/CLL, Non-Hodgkin’s Lymphoma or Chronic Lymphocytic Leukemia; MAPD, Medicare advantage with prescription drug coverage; AL, Alabama; NE, New England; DE, Delaware; NCCN, National Comprehensive Cancer Network; mBC, Metastatic breast cancer; mLC, Metastatic lung cancer; mCRC, metastatic colorectal cancer.
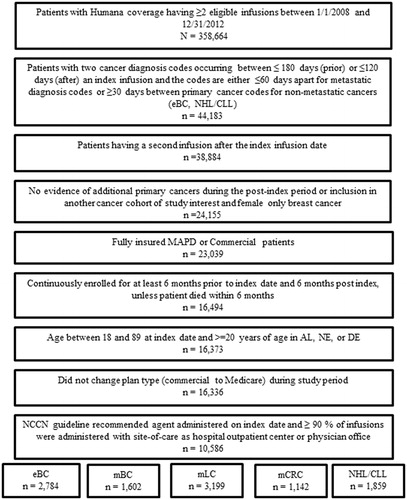
Overall, the majority of patients received infusion therapy in the physician office setting (68.6%), the proportion of patients treated in the physician office setting ranged from 63.7–73.5% within each cancer type (computation not shown). The mean age of patients in this study was 67.2 years ±10.8 years (SD), and 67% of the patients were female. Differences in demographic and health plan characteristics by SOC are described in . Patients in the physician office setting were more likely to be females and residents of the Southern and Western regions of the US than patients in the hospital outpatient setting. Patients receiving infusions as a hospital outpatient had a higher average Deyo Charlson Comorbidity Index, and were more likely to have Medicare insurance and reside in the Northeast and Midwest regions of the US compared to those in the physician office setting.
First-line therapy
First-line therapy regimen was categorized by therapy class for each cancer type. Proportions of patients receiving each therapy class, duration of therapy, and number of infusions by therapy classes were compared by SOC ().
Early stage breast cancer
Among patients with eBC, a statistically significant difference by SOC was found in the proportion of patients receiving each first-line therapy class (p = .0005). In the hospital outpatient setting, patients with eBC were more likely to receive a combination of biologic and chemotherapy drugs compared to those in the physician office (22.6% vs 18.6%). A smaller proportion of hospital outpatients received classes of therapy that were not biologic, taxane, or anthracycline based (i.e. “other class” category; 4.7% vs 9.7%). There was a noted difference in the duration of therapy and infusion frequency experienced among patients with eBC in the hospital outpatient setting compared to those in the physician office ( and ). Patients with eBC experienced shorter durations of therapy if they received anthracycline based, taxane based, or “other class” treatments in the hospital outpatient setting. Hospital outpatients experienced fewer infusions if they received therapy classes containing a taxane based therapy or both biologic and chemotherapy when compared to patients who received these treatment classes in the physician office. The number of taxane based infusions by SOC were hospital outpatient [mean (SD) = 4.6 (2.0); median (IQR) = 4.0 (4.0–4.0)], infusions vs physician office [mean (SD) = 5.4 (3.9); median (IQR) = 4.0 (3.0–4.0) infusions, p = .0005], and the number of biologic and chemotherapy infusions by SOC was hospital outpatient [mean (SD) = 21.1 (10.7); median (IQR) = 18.0 (6.0–25.0)] vs physician office [mean (SD) = 23.0 (11,0); median (IQR) = 20.5 (17.0–29.0) infusions, p = .0382].
Metastatic breast cancer
For patients with mBC, there were no statistically significant differences by SOC in the proportion of each class of first-line therapy received (p = .1904). In this cohort, no statistically significant difference in duration of first-line therapy was noted by SOC. Infusion patients in the hospital outpatient setting who received taxane-based therapy obtained fewer infusions than those who received taxane-based therapy in the physician office setting [hospital outpatient, mean (SD) = 7.5 (7.2); median (IQR) = 5.5 (4.0–9.0); infusions vs physician office, mean (SD) = 9.3 (9.2), median (IQR) = 6.0 (4.0–12.0) infusions, p = .0225].
Metastatic lung cancer
For patients with mLC, no statistical differences were observed by SOC for each class of first-line therapy (p = .5630). Hospital outpatients receiving first-line therapy consisting only of biologic drugs experienced a shorter duration of therapy [hospital outpatient, mean (SD) = 61.9 (78.3) days; median (IQR) = 47.5 (8.0–74.5) days vs physician office, mean (SD) = 189.9 (182.4) days; median (IQR) = 113.0 (56.0–309.0) days, p = .0169] and fewer infusions than those receiving biologic drugs only in the physician office [hospital outpatient, mean (SD) = 3.8 (3.4) infusions; median (IQR) = 3.0 (1.5–4.5) infusions vs physician office, mean (SD) = 10.6 (9.8) infusions; median (IQR) = 6.0 (3.0–21.0) infusions, p = .0285]. Hospital outpatient infusion patients who received platinum based combination therapy also received fewer infusions [mean (SD) = 7.6 (5.4) infusions; median (IQR) = 6.0 (4.0–11.0) infusions vs physician office, mean (SD) = 8.2 (6.0) infusions; median (IQR) = 6.0 (4.0–12.0) infusions, p = 0.0392], although there was no statistical difference in duration of therapy for this class by SOC.
Metastatic colorectal cancer
Among patients with mCRC, no statistical difference by SOC was observed in the proportion of patients receiving each class of first-line therapy (p = .0873). However, hospital outpatients receiving oxaliplatin without bevacizumab received a lower number of infusions than those receiving this class of therapy in the physician office setting [hospital outpatient, mean (SD) = 10.5 (6.6); median (IQR) = 10.0 (6.0–12.0) vs physician office, mean (SD) = 12.5 (8.8); median (IQR) = 12.0 (6.0–15.0), p = .0304].
NHL/CLL
For patients with NHL/CLL, statistically significant differences were observed in the distribution of first-line therapy classes in the hospital outpatient vs physician office settings (p < .0001). Hospital outpatients were less likely to receive treatments containing chemotherapy and rituximab (63.3% vs 72.7%) or chemotherapy only regimens (12.1% vs 13.0%) than physician office patients with NHL/CLL. In the hospital outpatient setting, rituximab monotherapy was more commonly administered (24.5% vs 14.1%).
Duration of therapy and number of infusions were significantly shorter and fewer for hospital outpatients with first-line therapy consisting of chemotherapy drugs only, [duration of therapy, hospital outpatient, mean (SD) = 77.3 (63.8) days; median (IQR) = 78.5 (22.5–111.0), days vs physician office, mean (SD) = 147.6 (180.3) days; median (IQR) = 112.0 (59.0–162.5) days, p = .0002; number of infusions, hospital outpatient, mean (SD) = 7.1 (4.9) infusions; median (IQR) = 6.0 (3.0–10.0), infusions vs physician office, mean (SD) = 11.6 (13.9) infusions; median (IQR) = 7.5 (5.0–12.0) infusions, p = .0056]. Furthermore, hospital outpatients received fewer infusions than physician office patients if their treatments contained chemotherapy plus rituximab [hospital outpatient, mean (SD) = 8.3 (5.7) infusions; median (IQR) = 6.0 (5.0–10.0), infusions vs physician office, mean (SD) = 9.5 (7.8) infusions; median (IQR) = 7.0 (5.0–12.0) infusions, p = .0125].
Quality of care at end-of-life
For measures representing quality of care at end-of-life, there were no statistically significant differences by SOC for any of the cancer cohorts (). Overall, among people with Medicare insurance who died in the post-index period (n = 4,120), a similar percentage of patients in both settings experienced a hospitalization (55.2% vs 55.1%, p = .9587) or infusions (22.3% vs 23.9%, p = .2721), within the 30-day period prior to death.
Table 6. Site-of-care comparisons of quality of care at end of life among cancer types for Medicare patients.
All-cause total healthcare utilization and cost
The proportion of patients experiencing inpatient hospitalizations during the 6 month post-index period was generally similar among infusion patients in the hospital outpatient and physician office settings with a few exceptions (data not shown). The percentage of patients with at least one hospital inpatient visit during the 6 month post-index period was similar by SOC for all cancers except NHL/CLL. Patients with NHL/CLL treated in the hospital outpatient setting were more likely to be hospitalized during the post-index period than those treated in the physician office setting (38.0% vs 32.0%, p = .0106). Overall (all cancer types combined), the percentage of patients with at least one ER visit during the 6 month post-index period was significantly higher among hospital outpatients compared to the percentage of patients in the physician office setting (45.3% vs 42.1%, p = .0017). By cancer type, a statistical difference in the likelihood of experiencing an ER visit was found among patients with NHL/CLL. Patients with NHL/CLL in the hospital outpatient setting were more likely to have an ER visit than those in the physician office setting (41.4% vs 35.1%, p = .0090). Statistically significant differences were not found by SOC among the other cancer cohorts.
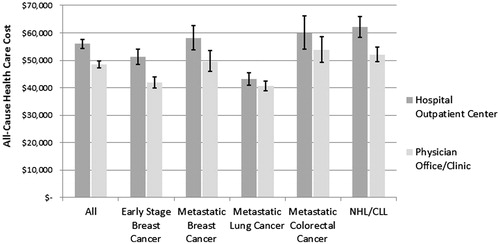
Average all-cause total 6-month healthcare costs were 16% higher for patients in the hospital outpatient setting [mean (95% CI) = $55,965 ($54,298–$57,682)] compared to patients in the physician office setting [$48,439 ($47,170–$49,741), p < .0001, ] after controlling for the impact of age, sex, comorbidity index, region of residence, pre-index healthcare costs, and cancer type. This pattern of higher all-cause total healthcare cost among patients in the hospital outpatient setting was reflected among each of the cancer cohorts ().
Figure 2. Site-of-care comparisons of adjusteda all-cause total healthcare costs by cancer type 6 months post-index.aGeneralized linear model estimations of mean total healthcare cost (sum of medical and pharmacy costs) (distribution = gamma, link function = log) with covariate adjustments for age, sex, Deyo Charlson Comorbidity Index, site-of-care, geographic region, and total medical costs in 6 month pre-index period.
Discussion
This study is among the first to explore the impact of SOC on infusion therapy for patients with cancer in an older, predominantly Medicare Advantage population with multiple cancer types on all NCCN-approved regimens. Differences were found by SOC in treatment patterns, ER visits, and total healthcare cost, but not in quality of care as defined by treatment or hospitalization near the end-of-life. In unadjusted analyses, for classes of first-line therapy where statistical differences did exist, duration of therapy was shorter and there were fewer numbers of infusions among patients in the hospital outpatient setting. The endemic population differences between the SOC cohorts may influence some of these findings and highlight the observed cancer care received among populations treated with infusion therapy in hospital outpatient compared to physician office settings. Multivariate adjusted analyses showed that hospital outpatients had higher total healthcare costs than those receiving infusions in the physician office.
Our findings indicate that patients with cancer receiving infusion therapy in the hospital outpatient setting vs physician office settings differed by demographic and clinical factors. Patients in the physician office were more likely to have eBC and mCRC, be female, have commercial health insurance, and reside in Southern and Western regions of the US when compared to hospital outpatients. Differences in patient baseline health status were also apparent in this study. In general, hospital outpatients had a greater comorbidity burden than patients in the physician office. Other studies have also noted that oncology patients with severe and/or more comorbidities are more likely to be treated in the hospital outpatient settingCitation4,Citation7. These findings suggest that non-oncology based factors may influence selection of the clinical setting for infusion therapy.
Analysis of first-line therapy showed differences in treatment patterns by SOC. Hospital outpatients experienced shorter durations of therapy and a lower number of infusions compared to those receiving the same first-line class of therapy in the physician office. Hospital outpatients with breast cancer (eBC or mBC) receiving taxane based therapy, patients with mLC receiving biologic drug only therapies, and patients with NHL/CLL receiving chemotherapy only treatments each experienced shorter durations of therapy and fewer infusions than their counterparts in the physician office. Numbers of infusions were lower for hospital outpatients with mLC receiving any platinum based combination therapy, patients with mCRC receiving oxaliplatin without bevacizumab, and patients with NHL/CLL receiving chemotherapy with rituximab or chemotherapy only treatments when compared to those in the physician office. Prior studies of other insured populations corroborate these findings of shorter durations of therapy and fewer infusion counts among patients in the hospital outpatient settingCitation4,Citation5. In a study of patients with eBC receiving trastuzumab, hospital outpatients had shorter durations of therapy, and fewer infusions than those in the physician officeCitation5. In another study, researchers assessing treatment pattern differences by site of service for patients with NHL or CLL receiving rituximab therapy reported a lower average number of infusions in the hospital outpatient setting compared to the physician officeCitation4.
Analyses showed some differences in healthcare utilization in the 6 month post-index period by SOC. Overall, patients receiving first-line therapy infusions in the hospital outpatient setting were more likely to have at least one ER visit during the post-index period than those receiving infusions in the physician office setting. Patients with NHL/CLL in the hospital outpatient setting also showed a higher likelihood of visiting the ER, as well as experiencing an inpatient hospitalization during the post-index period when compared to those in the physician office setting. This increased utilization among patients with NHL/CLL receiving infusion therapy in hospital outpatient settings is supported by previous researchCitation4. Higher rates of inpatient hospitalizations and ER visits among NHL or CLL patients receiving infusion therapy in the hospital outpatient setting compared to those in the physician office have been reported in a mostly commercially insured populationCitation4.
Measurements of quality of care at the end-of-life are meant to assess appropriate use of resources and quality of care for the patient. An analysis of these measures showed no differences in hospitalizations or infusions within 30 days of death for people with Medicare insurance. Similarly, previous research has also found no differences in quality of care, as measured by post-index pharmacy claims for neutropenia treatment, by SOCCitation7.
Differences in adjusted all-cause total healthcare costs were observed in the overall sample and in each cancer type. Costs were higher for patients receiving first-line therapy infusions in the hospital outpatient setting compared to those receiving infusions in the physician office setting. This cost differential by SOC has been reported in several previous studiesCitation3–5,Citation7,Citation8. For example, Byfield et al.Citation4 reported higher adjusted total healthcare costs among hospital outpatients with NHL/CLL compared to those in the physician office. Likewise, Parthan et al.Citation5 reported a 53.6% higher total monthly healthcare cost for patients with eBC receiving infusions in the hospital outpatient setting compared to the physician office. Fisher et al.Citation7 reported a more modest increase in total healthcare costs in the hospital outpatient setting from 6% in patients with mLC to 27% for patients with eBC.
This study found increased all-cause total healthcare costs among patients receiving first-line therapy infusions in the hospital outpatient setting as compared to the physician office setting, despite few differences in healthcare resource utilization by SOC. It is possible that other factors not considered in the current study also contributed to this cost differential, such as unit cost differences, which was noted in Fisher et al.Citation7.
Limitations associated with analysis of claims data should be noted. Claims data are administrative in purpose and serve as billing records concerning medical conditions and services received. Claims data may be incomplete or inaccurate, and may affect sample identification and results. However, large sample sizes and the evaluation of study measures at various time points mitigate the effects of these coding errors. The magnitude of the differences in site-of-care on cost may have differed with a follow-up period longer than 6 months. This study focused on infused biologic and chemotherapy; differences in oral chemotherapy were not considered. This study population was drawn from the membership of a national health plan. The majority of patients included in the study reside in the Southern and Midwest regions of the US. Generalizing the study findings to the US population should be approached with caution. Additionally, due to the observational nature and lack of randomization of this study, statistically significant associations can be established, but causal relationships cannot be determined. Factors associated with physicians’ choice of first-line therapy regimen and duration of therapy, such as patient performance status and disease progression, could not be evaluated in this study. Lastly, the clinical significance of findings should be taken into consideration when evaluating the results.
Conclusions
Treatment pattern differences by SOC were evident in this study for some classes of agents, and investigation of the effect of these differences on a broader range of patient outcomes is warranted. Given the shifts in oncology infusion therapy from the physician’s office to the hospital outpatient setting, future site-of-care research should examine cost differences as newer agents enter the market and also evaluate factors associated with site-specific patient oncology care experiences, such as travel distance for treatment, physician referral patterns, patient treatment preferences, and treatment tolerance.
Transparency
Declaration of funding
This research project was funded by Genentech, Inc. The research concept was approved and plans to publish results were made known prior to commencing the study.
Declaration of financial/other interests
SH, AC, SS, DDA, and ZT are all paid employees of Comprehensive Health Insights, Inc., a Humana subsidiary company that was contracted to conduct this study. AC and SS also own Humana stock. AH is a former paid employee of Comprehensive Health Insights, Inc. JP declares that he has no conflict of interest. AS is a former paid employee of Genentech, Inc. and owns stock in Genentech/Roche. AM is a paid employee of Genentech, Inc. and has stock options from Roche. JME peer reviewers on this manuscript have no relevant financial or other relationships to disclose.
Previous presentations
Parts of this manuscript have been presented as posters at the 2015 San Antonio Breast Cancer Conference and the 2015 American Society of Hematology Conference. An abstract was included in the publication of the 2015 American Society of Clinical Oncology (ASCO) Annual Meeting.
Acknowledgments
No assistance was received in the preparation of this article.
References
- Alavere Health I. Total cost of cancer care by site of service: physician office vs outpatient hospital; 2012. Washington DC. Available at: www.communityoncology.org/pdfs/avalere-cost-of-cancer-care-study.pdf
- Community oncology cancer care practice impact report: documented impact on community oncology practices. Updated March 31, 2011. Community Oncology Alliance, Washington DC. Available at: http://partnershiptoprotectmedicare.com/studies/COA_Impact_Report_3-31-11.pdf
- Fitch KI, Iwasaki K, Pyenson B. Comparing episode of cancer care costs in different settings: an actuarial analysis of patients receiving chemotherapy. In: Report MC, editor; 2013, Milliman, Seattle
- Byfield S, Small A, Becker L, et al. Differences in treatment patterns and health care costs among non-Hodgkin’s lymphoma and chronic lymphocytic leukemia patients receiving rituximab in the hospital outpatient setting versus the office/clinic setting. J Cancer Ther 2014;5:208-216
- Parthan A, Santos E, Becker L, et al. Health care utilization and costs by site of service for nonmetastatic breast cancer patients treated with trastuzumab. J Manag Care Spec Pharm 2014;20:485-93
- Fisher MD YY, Luthra R, Singer JR, et al. Effect of treatment setting on healthcare costs in five major cancer types from a large commercially insured population. Acad Manage Care Pharm 2014, The Annual Conference of the Academy of Managed Care Pharmacy Nexus; 2014 Oct 7 - 10; Boston, MA
- Fisher MD, Punekar R, Yim YM, et al. Differences in health care use and costs among patients with cancer receiving intravenous chemotherapy in physician offices versus in hospital outpatient settings. J Oncol Pract 2017;13:e37-e46
- Hayes J, Hoverman RJ, Brow ME, et al. Cost differential by site of service for cancer patients receiving chemotherapy. Am J Manage Care 2015;21:e189-e196
- National Comprehensive Cancer Network. NCCN guidelines for the treatment of cancer by site. National Comprehensive Cancer Network, Inc. 2014. Available at: https://www.nccn.org/professionals/physician_gls/f_guidelines.asp
- Deyo RA, Cherkin DC, Ciol MA. Adapting a clinical comorbidity index for use with ICD-9-CM administrative databases. J Clin Epidemiol 1992;45:613-19