
Abstract
Aims: To assess treatment adherence, healthcare resource utilization, and costs in gastrointestinal neuroendocrine tumor (GI NET) patients initiating pharmacologic treatments in the US.
Methods: In two US commercial claims databases, patients ≥18 years with ≥1 inpatient or ≥2 outpatient GI NET claims within 12 months were identified. The first claim for pharmacologic treatments (e.g. somatostatin analogs [SSAs], cytotoxic chemotherapy [CC], targeted therapy [TT]) following diagnosis, between July 1, 2009 – December 31, 2014, was defined as the index date. A 6-month pre-index NET treatment-free period, and ≥1-year post-index enrollment were required. Proportion of days covered (PDC) was calculated during the follow-up period. Outcomes were reported separately for patients with 1- and 2-years post-index enrollment. Descriptive statistics, including means, standard deviations, and frequencies and percentages for continuous and categorical data, respectively, were reported.
Results: Of 1,322 patients with 1-year follow-up, 847 initiated SSA, 397 CC, 35 TT, two interferon, and 41 various combinations. Mean (SD) PDC was 0.669 (0.331) for SSA, 0.466 (0.236) for CC, and 0.505 (0.328) for TT. Mean (SD) office visits and hospitalizations, respectively, were 20.5 (13.5) and 0.59 (1.03) for SSA, 30.5 (19.8) and 0.89 (1.45) for CC, and 17.7 (12.5) and 1.23 (1.93) for TT. Total annual cost for patients during year 1 was $99,691 (82,423) for SSA, $134,912 (116,078) for CC, and $158,397 (82,878) for TT. Among 685 patients with 2-years follow-up, annual mean costs in year 2 were $8,071, $58,944, and $36,248 lower than year 1 for SSA, CC, and TT, respectively.
Limitations: Findings may not be generalizable to the US population. Claims are designed for reimbursement, not research. The study may under-estimate costs not covered by insurance.
Conclusion: This study reports utilization and costs associated with different treatment therapies. Costs were higher in year 1 than year 2. This two-database study offers new information on the magnitude and trends in the cost of pharmacologically-treated GI NETs.
Introduction
Neuroendocrine tumors (NETs) are rare and often slow growing malignancies. They may arise from neuroendocrine cells anywhere in the body, although approximately two-thirds occur in the gastrointestinal (GI) tract, including the stomach, small intestine, appendix, colon, and rectumCitation1–3. A sub-set of NETs secrete peptides and neuroamines that cause distinct syndromes (e.g. carcinoid syndrome), in which case they are referred to as “functional” tumors. For largely unknown reasons, the incidence rate for GI NETs has been increasing, and was reported as 35.3 per million person-years (PMPY) for 2012 using data from the Surveillance, Epidemiology, and End Results Program (SEER)Citation3, and 58.2–79.1 PMPY in 2014 using commercial claimsCitation4.
Treatment may be influenced by stage, histology, clinical findings, and tumor markers. Surgery is the primary approach for treatment of locoregional disease, but delayed diagnosis is typical, and many patients require systemic treatment. The most recent National Comprehensive Cancer Network (NCCN) guidelines for unresectable and metastatic GI NETs recommend somatostatin analogs (SSA; i.e., octreotide and lanreotide) as first-line treatment for patients with clinically significant tumor burden or symptoms of hormone secretion, and as an option for asymptomatic patients with low tumor burden. To date, there are two Food and Drug Administration (FDA)-approved SSA in the US: octreotide, indicated for symptomatic treatment of metastatic carcinoid tumors; and lanreotide, indicated for unresectable, well- or moderately-differentiated, locally advanced or metastatic gastroenteropancreatic neuroendocrine tumors and carcinoid syndrome. The guidelines do not recommend a particular treatment sequence for the remaining therapiesCitation5. In a recent retrospective analysis, it appeared that more than half of pharmacologically treated patients began treatment with SSACitation6. The next most common initial treatment—about one third of patients—was with a variety of cytotoxic chemotherapies (CC; e.g. 5-FU, capecitabine, temozolomide). Other treatments included targeted therapies (TT) such as everolimus and sunitinib.
A 2013 comprehensive systematic review of multiple databases found quite limited information on resource use, cost of illness, and economic outcomes in general for NETsCitation7. A PubMed search covering the period after the review similarly found few studies of adherence to first-line therapy for NET and no real-world economic data. A 2013 chart review of US advanced NET patients found high overall healthcare utilization and recommended further research to be conducted in a larger patient populationCitation8. This study aimed to assess real-world first-line treatment adherence, healthcare resource utilization, and costs in patients with GI NETs who initiated pharmacologic treatments in the US.
Materials and methods
We conducted a longitudinal, retrospective cohort analysis of newly pharmacologically treated GI NET patients using data between January 1, 2009 and December 31, 2014 from two large US commercial claims databases—Truven Health Analytics MarketScan® database and the IMS PharMetrics™ database. Both databases are Health Insurance Portability and Accountability Act compliant administrative claims databases that contain de-identified adjudicated medical claims (e.g., inpatient and outpatient services) and pharmacy claims (e.g., outpatient prescriptions) submitted for payment by providers, healthcare facilities, and pharmacies. For both data sources, claims include information on each physician visit, medical procedure, hospitalization, drug dispensed, date of service, number of days of medication supplied, test performed, and complete payment information. Each medical claim has principal and secondary diagnosis codes associated with it. Available patient demographic information includes age, gender, and geographic region. Dates of enrollment and disenrollment are also recorded. As the data were fully de-identified, this study was considered exempt from approval by the Institutional Review Board.
Patients ≥18 years old were identified from each dataset if they had at least one inpatient or two outpatient claims within 12 months with an International Statistical Classification of Disease-9-Clinical Modification (ICD-9-CM) diagnosis for GI NETs (209.00–209.03, 209.10–209.17, 209.23, 209.25–209.27, 209.40–209.43, 209.50–209.57, 209.63, 209.65–209.67) between July 1, 2009 and December 31, 2014. Due to limited data availability, we excluded patients ≥65 years old from the analysis. We further excluded patients with pancreatic NET, as treatments for pancreatic NET are different from those for GI NETCitation5. Furthermore, baseline clinical characteristics would likely differ between NET patients with different tumor origins. The date of the first GI NET pharmacologic treatment claim on or after the appearance of the GI NETs diagnosis code was considered to be the index date. Patients were required to have continuous enrollment at least 6 months before (baseline) and at least 1 year after the index date. To ensure new treatment, patients with any evidence of pharmacologic treatment for NET during this baseline period were excluded. In order to not include the same patient twice, we searched for any patients with the same age, gender, region, and date of GI NET diagnosis who could be found in both databases, but we found none. Patients were followed for at least 1 year until the end of enrollment.
Patient demographic characteristics (i.e. age, gender, US census region) were derived from the enrollment files. Outcomes were reported organized by first observed pharmacologic therapy: SSA, TT, CC (whether given alone or in combination), interferon (IF), and combinations of these groups. SSA included octreotide and lanreotide; TT included everolimus and sunitinib; and CC included temozolomide, streptozotocin, doxorubicin, liposomal doxorubicin, fluorouracil, capecitabine, dacarbazine, oxaliplatin, and thalidomide. Lanreotide was not approved in the US for unresectable, well- or moderately-differentiated, locally advanced or metastatic gastroenteropancreatic neuroendocrine tumors until December 2014; however, US law allows for off-label use. Pharmacologic therapy was identified in claims using both the Healthcare Common Procedure Coding System (HCPCS) and National Drug Codes (NDC). First-line therapy was defined as the pharmacologic treatment regimen observed on, or within 3 months of, the index date. A 3-month period after the index date was used to identify pharmacologic therapy intended as first-line but not administered on the index date. This would include, for example, combination chemotherapy, where the second agent was given after some delay.
Two adherence measures were calculated: medication possession ratio (MPR) and proportion of days covered (PDC). MPR was calculated as the total days of supply for fills within the refill interval divided by days in the refill interval and capped at 100%. Patients with at least two fills of first-line therapy were included. The refill interval was defined as the period between the first fill and the last fill plus the days of supply of the last fill. PDC was calculated as the number of days with first-line therapy available (“covered”) divided by the number of days in the review period. PDC was calculated for the 1 year following treatment initiation date; thus, the number of days in the review period was 365.
All-cause healthcare utilization included inpatient hospitalizations, emergency department (ED) visits, non-ED outpatient service visits, and any pharmacy utilization. All-cause healthcare costs were calculated by adding up all medical costs, which include inpatient hospitalization costs, ED service costs, non-ED outpatient service costs, and pharmacy costs. Costs were for insurance-covered healthcare costs from fully adjudicated and paid claims, and included both patient and plan portions of each claim for all medical services utilized during the study period. Services provided “out-of-network” or not covered by insurance were not included. In addition, we identified cost related to cancer based on claims with a primary ICD-9-CM diagnosis code of 140.xx–239.xx, and reported both cancer-related and non-cancer related costs.
Descriptive statistics, including means, standard deviations, and relative frequencies and percentages for continuous and categorical data, respectively, were reported. All costs were adjusted to 2014 US dollars (the last available year of study data) using the medical care component of the Consumer Price Index. All data transformations and statistical analyses were performed using SAS® version 9.4 (SAS Institute, Cary, NC).
Results
There were 2,900 and 2,453 patients meeting the definition of GI NET who also had a claim for first-line pharmacologic treatment between July 1, 2009 and December 31, 2014 in the MarketScan and PharMetrics databases, respectively. After excluding patients who had treatment during a 6-month pre-index period (and, therefore, were considered to be continuing, rather than initiating, treatment); received treatment before receiving a diagnosis of GI NET; were <18 years old; or were not continuously enrolled in the 6-month pre-index period, there remained 2,258 newly treated GI NET patients who were included in the study (). Among these, there were 1,322 patients with at least 1-year and 685 with at least 2-years of follow-up since treatment initiation ().
Figure 1. Patient identification. There were 2,900 and 2,453 GI NET patients who also had a claim for pharmacologic treatment in the MarketScan and PharMetrics databases, respectively. After excluding patients who had treatment during a 6-month pre-index period (and, therefore, were considered to be continuing, rather than initiating, treatment); received treatment before receiving a diagnosis of GI NET; were <18 years old; or were not continuously enrolled in the 6-month pre-index period, there remained 2,258 newly-treated GI NET patients who were included in the study. aSomatostatin analogs (SSA), targeted therapy, cytotoxic chemotherapy, or interferon; b324 (34.8%) within 3 months, and 516 (55.4%) within 6 months; c249 (35.0%) within 3 months, and 380 (53.4%) within 6 months.
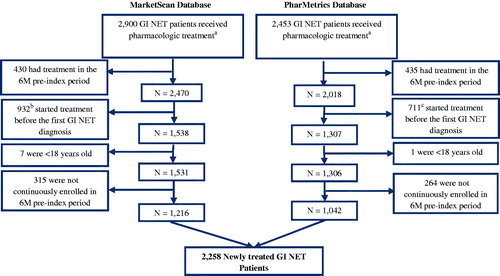
Table 1. First-line treatment in patients with 1 or 2 years post-index enrollment.
Among the 1,322 patients with 1-year follow-up, 847 initiated SSA, 397 CC, 35 TT, two IF, and 41 various combinations (). Demographic characteristics are shown in . With regard to adherence, the mean (SD) MPR was 0.817 (0.221) for SSA, 0.817 (0.242) for CC, and 0.760 (0.234) for TT. The mean (SD) PDC was 0.669 (0.331) for SSA, 0.466 (0.236) for CC, and 0.505 (0.328) for TT. With regard to resource use, SSA users had mean (SD) = 20.5 (13.5) outpatient visits and 0.59 (1.03) hospitalizations. CC users had 30.5 (19.8) and 0.89 (1.45) outpatient visits and hospitalizations, respectively. TT users had 17.7 (12.5) outpatient visits and 1.23 (1.93) hospitalizations ().
Table 2. Demographic characteristics in patients with 1-year post-index continuous enrollment.
Table 3. All-cause healthcare resource utilization in patients with 1-year post-index continuous enrollment.
Total mean (SD) annual cost for these 847 SSA users during the first year was $99,691 (82,423), including $58,301 (61,910) in cancer-related and $34,046 (44,730) in non-cancer related costs. For the 397 CC users, total annual cost was $134,912 (116,078), cancer-related costs were $73,454 (73,170), and non-cancer related costs were $51,812 (76,330). Among the 35 patients initiating TT, total, cancer-related, and non-cancer related costs were $158,397 (82,878), $38,232 (43,229), and $51,299 (71,032), respectively ().
Table 4. All-cause healthcare costs in patients with 1-year post-index continuous enrollment.
Among the 685 patients with 2 years of follow-up, 452 initiated treatment with SSA, 189 CC, 20 TT, one interferon, and 23 combinations (). Total mean (SD) annual costs for year 1 and year 2, respectively, were $95,999 (71,400) and $87,928 (85,028) for SSA, $117,670 (104,528) and $58,726 (94,490) for CC, and $147,169 (75,379) and $110,921 (77,672) for TT ().
Table 5. Annual healthcare resource utilization and cost in year 1 and 2 among patients with 2-years post-index continuous enrollment.
Discussion
This study used two very large, nationally representative claims databases in the US, together representing up to 100 million covered lives, to study medication adherence, utilization, and cost in pharmacologically treated patients with GI NETs. Several findings were of particular interest. First, with regard to treatment patterns, more than 60% of patients initiated treatment with SSA, about 30% CC, and under 3% TT. Patients appeared to be quite adherent to therapies based on MPR; less so when measured by PDC, as PDC is affected by lower persistence (e.g. complete discontinuation before the end of the study period), whereas MPR is not. Second, regardless of initial pharmacologic therapy, utilization and cost are high for this group of patients. The first-line SSA user group was associated with costs of $99,691 in the first year, CC $134,912, and TT $158,397. Most accessed the healthcare system at least one or two times per month, and the majority were hospitalized at least once over the course of a year. This utilization pattern drove high costs—as high as $150,000 in the year following treatment initiation. Third, in patients for whom 2 years of treatment data were available, the total annual costs were higher in the first year than in the second year, regardless of which therapy was initially used.
The finding that 60% of patients initiated pharmacologic therapy with SSA is consistent with the NCCN recommendation of these drugs for initial treatment of clinically significant and advanced NETsCitation5. However, that almost a third of GI NETs patients were treated with CC is somewhat surprising. CC is relatively ineffective in treating GI NETs, and, as a result, is recommended by major guidelines only if other options are not feasibleCitation5. We considered three possible explanations. First, it is possible that these patients were previously treated with other agents—we reviewed data for 6 months before the first pharmacologic treatment, but treatments more than 6 months in the past would have been missed. Second, patients may also have had a pathologic finding (e.g. high Ki-67, high mitotic index, advanced stage or grade, or high remission pressure) suggesting chemotherapy would be beneficial. Treatment recommendations vary based upon tumor gradeCitation5. The databases did not contain this level of clinical detail, and data limitations and privacy restrictions made such data not obtainable for our study sample. A high percentage of chemotherapy may indicate our study population included a large proportion of patients with poorly differentiated NETs. Finally, clinicians may be unfamiliar with NCCN recommendations, or may not choose to treat in accordance with NCCN guidelines, although, again, our study provides no direct support for this hypothesis.
The decrease in cost is consistent with literature that shows high initial cost of cancer in year of diagnosis, then lower cost in subsequent years, although the current study focused on the year following initial pharmacotherapy, not diagnosisCitation9. Decreasing cost over time has been shown in breast, lung, colorectal, and prostate cancerCitation10,Citation11. For example, analyses by Laudicella et al.Citation10 indicate that costs for colorectal, breast, prostate, and lung cancer patients peaked in the year of diagnosis and decreased in the 9-year follow-up periodCitation10. Although we did not examine diagnostic tests or surgeries specifically, it may be that not only are fewer pharmacologic therapies used over time, but also more tests and/or surgeries are performed initially, leading to higher costs earlier in the course of treatment. We identified one study that reported costs over time in NETCitation12. This study compared cost of care in Canada over time periods of different lengths (varying from 1 to more than 8 years) and divided them differently from most, but showed a roughly similar pattern, with costs dropping substantially after diagnosis.
This study had limitations. First, findings may not precisely reflect the US population, because commercially insured patients (the group studied) may differ from people without commercial insurance. The sample did not include older adults ≥65 years old. The vast majority of US patients over 65 are covered by Medicare, and their data were not available in this privately-insured sample. Second, the administrative claims used in this study were collected for reimbursement purposes, and the completeness and accuracy of medical coding is subject to data coding restrictions and data entry error. Furthermore, treating NETs is complex, and clinical decision-making is determined by location, tumor markers (i.e. Ki-67 and tumor pathology), extent of disease, and other factors. Our data did not include this level of detail. Specifically, while GI NETs can be identified by using a list of ICD-9-CM diagnosis codes, the presence of advanced disease must be inferred by observing the use of pharmacologic treatment. Similarly, there is no information on tumor markers, nor are pathology reports available. Third, the healthcare cost estimates may be under-estimated, as services not covered by insurance or rendered “out-of-network” would not have been included. For example, patients may have paid out of pocket or traveled outside of the US for some newer therapies, such as peptide receptor radionuclide therapy (PRRT). Additionally, medications provided as part of clinical trials would not be billed to insurance, and may have been missed (there is no way for us to estimate the magnitude of this). Cost estimates include direct healthcare costs only, and do not take into account important indirect costs associated with caregiver burden, loss of productivity, or reduced quality-of-life. Costs of treatments occurring prior to initiation of pharmacologic treatment, such as liver directed therapy, were also not included. Fourth, the study period did not allow us to capture the most up-to-date treatments, as lanreotide was approved in the US for GI NET in December 2014 and PRRT in 2018. We did not break down SSA utilization by drug in this study, but a previous study over a similar time period found <1% of patients using lanreotideCitation6. Fifth, this study presents descriptive results only, and is not intended to compare the therapies examined. A larger, more clinically detailed study would be required to make valid comparisons.
This study builds upon two other published GI NET studies conducted by our teamCitation4,Citation6. All three studies utilized the same large databases, which have been used by other researchers to study a multitude of disease conditionsCitation13,Citation14. One of these studies was an epidemiology study of GI NET incidence and prevalence, regardless of treatment status. The second was a treatment patterns study with a different patient population (not requiring continuous enrollment for ≥1-year post-index). Neither of the prior studies examined treatment adherence, resource utilization, or costs of GI NET.
Conclusion
In this descriptive study, despite the available and widely used first-line recommendations for SSA, nearly a third of US patients with GI NET initiated treatment with CC. Utilization and costs were higher in the first year after treatment initiation than in the second year, regardless of therapy initiated. Additional research with a larger sample size would be needed for adjustment of between-group differences.
Transparency
Declaration of funding
Funding for this study was provided by Novartis Pharmaceuticals Corporation, One Health Plaza, East Hanover, NJ 07936-1080, USA.
Declaration of financial/other relationships
BC is an employee of Novartis Pharmaceuticals Corporation. ABB III is an employee of Northwestern University and was paid by Novartis to consult as a subject matter expert. MSB, EC, and TY are employees of Partnership for Health Analytic Research, LLC (PHAR, LLC), a health services research company paid by Novartis to conduct this research. Peer reviewers on this manuscript have received an honorarium from JME for their review work, but have no other relevant financial relationships to disclose.
Previous presentations
Presented as a poster for the 2018 Gastrointestinal Cancers Symposium.
Acknowledgments
No assistance in the preparation of this article is to be declared.
References
- Fraenkel M, Kim M, Faggiano A, et al. Incidence of gastroenteropancreatic neuroendocrine tumours: a systematic review of the literature. Endocr Relat Cancer 2014;21:R153-63
- Modlin IM, Oberg K, Chung DC, et al. Gastroenteropancreatic neuroendocrine tumours. Lancet Oncol 2008;9:61-72
- Dasari A, Shen C, Halperin D, et al. Trends in the incidence, prevalence, and survival outcomes in patients with neuroendocrine tumors in the United States. JAMA Oncol 2017;3:1335
- Broder MS, Cai B, Chang E, et al. Epidemiology of gastrointestinal neuroendocrine tumors in a US commercially insured population. Endocr Pract 2017;23:1210-16
- NCCN Clinical Practice Guidelines in Oncology (NCCN Guidelines®): Neuroendocrine Tumors. National Comprehensive Cancer Network; 2017
- Benson AI, Broder M, Cai B, et al. Real-world treatment patterns of gastrointestinal neuroendocrine tumors: A claims database analysis. World J Gastroenterol 2017;23:6009-196
- Chau I, Casciano R, Willet J, et al. Quality of life, resource utilisation and health economics assessment in advanced neuroendocrine tumours: a systematic review: systematic review of QoL in NET. Eur J Cancer Care 2013;22:714-25
- Strosberg J. United States-based practice patterns and resource utilization in advanced neuroendocrine tumor treatment. World J Gastroenterol 2013;19:2348
- Mariotto AB, Robin Yabroff K, Shao Y, et al. Projections of the cost of cancer care in the United States: 2010–2020. J Natl Cancer Inst 2011;103:117-28
- Laudicella M, Walsh B, Burns E, et al. Cost of care for cancer patients in England: evidence from population-based patient-level data. Br J Cancer 2016;114:1286-92
- Dieguez G, Ferro C, Pyenson BS. A multi-year look at the cost burden of cancer care. New York, NY: Milliman, Inc.; 2017
- Hallet J, Law CHL, Cheung M, et al. Patterns and drivers of costs for neuroendocrine tumor care: a comparative population-based analysis. Ann Surg Oncol 2017;24:3312-23
- Truven Health. Marketscan databases [Internet]. 2018. IBM Watson Health. https://truvenhealth.com/markets/life-sciences/products/data-tools/marketscan-databases
- IQVIA. Real world value and outcomes [Internet]. 2018. https://www.iqvia.com/solutions/real-world-value-and-outcomes