
Abstract
Background: There is a critical need to focus limited resources on sub-groups of patients with obesity where we expect the largest return on investment. This paper identifies patient sub-groups where an investment may result in larger positive economic and health outcomes.
Methods: The baseline population with obesity was derived from a public survey database and divided into sub-populations defined by demographics and disease status. In 2016, a validated model was used to simulate the incidence of diabetes, absenteeism, and direct medical cost in five care settings. Research findings were derived from the difference in population outcomes with and without weight loss over 15 years. Modeled weight loss scenarios included initial 5% or 12% reduction in body mass index followed by a gradual weight regain. Additional simulations were conducted to show alternative outcomes from different time courses and maintenance scenarios.
Results: Univariate analyses showed that age 45–64, pre-diabetes, female, or obesity class III are independently predictive of larger savings. After considering the correlation between these factors, multivariate analyses projected young females with obesity class I as the optimal sub-group to control obesity-related medical expenditures. In contrast, the population aged 20–35 with obesity class III will yield the best health outcomes. Also, the sub-group aged 45–54 with obesity class I will produce the biggest productivity improvement. Each additional year of weight loss maintained showed increased financial benefits.
Conclusions: This paper studied the heterogeneity between many sub-populations affected by obesity and recommended different priorities for decision-makers in economic, productivity, and health realms.
Introduction
An estimated 93.3 million adults (39.8%) in the US are living with obesity, a condition associated with increased risk for heart disease, diabetes, myocardial infarction, certain types of cancer, and other preventable diseasesCitation1. Obesity prevalence is increasing across all age groupsCitation2,Citation3. Relative to having normal body weight (body mass index (BMI) = 18.5–25 kg/m2), obesity (BMI ≥ 30 kg/m2) is associated with ∼ $3,500–$3,900 higher annual medical expenditures, with per capita economic burden estimates varying by age and other risk factorsCitation4,Citation5. The disease process with obesity is a continuum, and a recent study estimates that excess medical expenditures associated with obesity are $2,810/year for obesity class I (BMI = 30–35 kg/m2), $5,000/year for obesity class II (BMI = 35–40 kg/m2), and $8,710/year for obesity class III (BMI ≥ 40 kg/m2)Citation5.
Reducing the prevalence of obesity is a US national goalCitation6. The first line strategy to prevent or treat obesity is lifestyle changes centered on improved nutritional intake and increased physical activity through a combination of public health initiatives and individual lifestyle coachingCitation7,Citation8. Lifestyle coaching alone appears to help overweight and obese patients reduce BMI by ∼5–6% on averageCitation9,Citation10. Acceptance-based behavior intervention can lead to a weight loss of 13.3% (±0.83%) after 1 yearCitation11. Pharmacotherapy can enhance and help maintain weight loss when lifestyle changes alone are unsuccessful—especially among patients with risk factors such as hypertension, glucose intolerance, or family history of diabetesCitation12. Randomized clinical trials indicate that pharmacotherapy and lifestyle counseling combined can lead to a weight loss of 11.5% (±0.6%) in ∼1 yearCitation13. Weight loss can lead to improvements in glycemia, blood pressure, triglycerides, and cholesterol levels, which in turn can prevent, delay onset, or reduce the severity of other chronic diseasesCitation14.
There is considerable heterogeneity among individuals with obesity, both in health risk factors and in weight management outcomesCitation15. For example, recent research suggests the same lifestyle intervention can achieve larger weight loss in older adults compared to younger adultsCitation16,Citation17. The Department of Health and Human Services (HHS) called for future obesity research on how health benefits will differ by age, sex, and BMI, and how to identify the best population who can benefit from weight lossCitation18. Such information can inform program eligibility criteria and policy decisions to help prioritize resources in the effort to reduce obesity. This paper projects the short- and long-term health and economic benefits of obesity management on sub-populations defined by demographics as well as disease status, and identifies patient characteristics predictive of a larger return on investment.
Methods
Overview
We used a published and validated microsimulation model to simulate how weight loss among adults with obesity could prevent or delay disease onset and the associated benefits. Simulated clinical and economic benefits of 5–12% BMI reduction over 15 years were analyzed by univariate and multivariate regression to illustrate how outcomes differ by patient characteristics, time horizon, and weight maintenance scenarios. Model data sources, methods, assumptions, limitations, and validation activities are summarized below and in the Supplementary Appendix. More technical details can be found via online documentation and previous publicationsCitation5,Citation16,Citation17,Citation19,Citation20.
Population
We identified 5,221 adults with obesity (BMI ≥30) in the combined 2005–2012 National Health and Nutrition Examination Surveys (NHANES) with the clinical data required to simulate health outcomes. In addition to demographics (age, sex, race, ethnicity), for each individual we obtained biometric data (BMI, systolic (SBP) and diastolic (DBP) blood pressure, total and high-density (HDL) lipoprotein cholesterol, and hemoglobin A1c levels), current smoking status, presence of chronic conditions linked to obesity, and the use of medications to treat hypertension and hypercholesterolemia. Data on self-reported chronic conditions indicated whether the person had a history of type-2 diabetes, hypertension, congestive heart failure, ischemic heart disease, sleep apnea, depression, myocardial infarction, or stroke. Additional diseases modeled include onset of diabetes-related complications like amputation, retinopathy, and end-stage renal disease, as well as obesity-related conditions like onset of cancers for which obesity is a risk factor ().
Figure 1: Schematic Overview of the Obesity Component of the Microsimulation Model
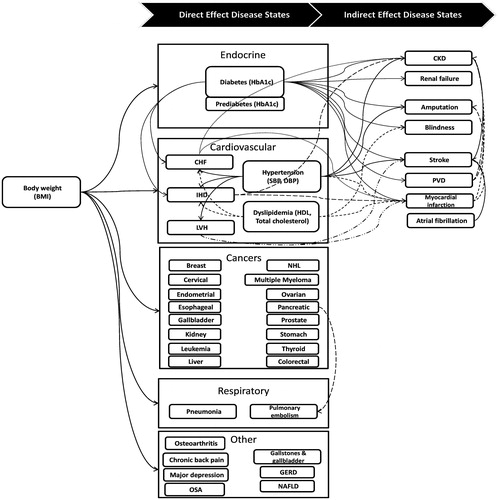
Each of the 5,221 adults from NHANES had a sample weight that indicated his or her probability of selection in the nationwide survey. Using these sample weights, with repeated sampling we constructed an analytic file of 100,000 people nationally representative of non-institutionalized adults with obesity in the US.
Microsimulation
We used a Markov approach to simulate annual probability of disease onset with each person’s current health status as input to predict the upcoming year’s outcomes. Data sources for the prediction equations used in the model originated from clinical trials, published review articles and meta-analyses, as well as in-house analysis of public databases. Each individual is described with more than 40 variables such as demographics (age, gender, race), biometrics (BMI, HbA1c, blood pressure, cholesterol level, and so on), disease presence, disease history, and behavioral risk factors (smoking, drinking), which were used as predictors in the equations to model disease incidence probability, mortality, annual medial expenditures, and other economic outcomes modeled. The change in a person’s biometrics as he or she ages will vary by current age and sex, with race and ethnicity also playing a role for some biometrics.
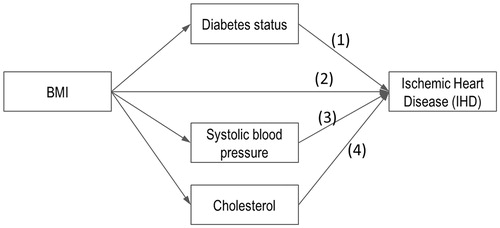
Body weight directly affects disease risk in many of the prediction equations and indirectly affects disease risk via its influence on blood pressure, cholesterol, or glucose levels and other health states like type-2 diabetes. As one of the key input parameters of the microsimulation model, BMI is the most commonly used anthropometric index of a person’s level of body weight, and the majority of the published studies have used BMI as one of the predictor variables for obese-related chronic conditions. For example, BMI can affect the probability of ischemic heart disease via four modeled pathways ().
Figure 2: BMI's four routes of influence on IHD
Annual medical expenditures were estimated using a set of generalized linear models with gamma distribution and log link, which were derived from the 2008–2012 Medical Expenditure Panel Survey (MEPS) with independent variables including patient demographics; presence of type-2 diabetes, hypertension, congestive heart failure, ischemic heart disease, retinopathy, and end-stage renal disease; history of myocardial infarction, stroke, and various cancers; smoking status; and body weight. The additional disease costs from other data sources were reconciled using the Medical Care Consumer Price Index. A negative binomial regression equation with similar predictor variables was constructed to model absenteeism (annual missed work days) due to illness for employed adults. Additional health states modeled include sequelae of diabetes and cardiovascular disease. The microsimulation approach, model diagrams, and data sources are detailed in the Supplementary Appendix and technical documentationCitation20.
Obesity management
For each person we simulated annual clinical and economic outcomes over 15 years under three scenarios, the per capita saving in direct medical cost was calculated by taking the differences between average medical costs from a “status quo” scenario (scenario 1) and two weight loss scenarios (scenarios 2 and 3):
Scenario 1: No initial weight loss, with annual weight change following national trends for a person of similar demographic and body weightCitation5,Citation19.
Scenario 2: 12% weight loss in year 1 reflecting potential benefits of combining lifestyle intervention with pharmacological treatment.
Scenario 3: 5% weight loss in year 1 reflecting that lifestyle intervention often achieves weight reduction in the 4–6% rangeCitation21.
For both scenarios 2 and 3 we simulated a weight regain period after initial weight loss. Since our sample cohort overlaps with a large proportion of patients from the Diabetes Prevention Program Outcomes Study (DPPOS) (BMI ≥30 kg/m2 vs BMI ≥25 kg/m2), the model followed the weight regain patterns observed in the 10-year follow-up outcomes of the DPPOS that each participant recoup 2/3 of initial weight loss during years 2–6Citation10. Then, annual weight change patterns followed natural trajectories similar to scenario 1. In addition, we also simulated alternative weight maintenance scenarios in which weight loss participants sustain initial weight loss for 1–5 years before starting to regain weight.
Statistical analysis
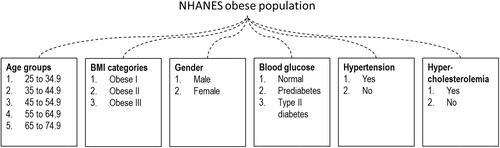
The study goal was to identify patient characteristics associated with higher value (e.g. larger economic savings, bigger health improvement) from weight loss. In particular, we explored whether simulated outcomes differed systematically in sub-populations defined by age group (25–34, 35–44, 45–54, 55–64, and 65–74 years), sex, severity of obesity (class I, II, and III), blood glucose level (normal, pre-diabetes, and type-2 diabetes), and whether the person had hypertension or hypercholesterolemia (). Unlike in a controlled research environment, not all demographic or clinical information will be accessible in a real-world environment. To make our study relevant to policy-makers with different perspectives, we analyzed simulation outcomes using both univariate analyses and multivariate analyses.
Figure 3. Subpopulations Analyzed
Univariate analyses provided insight on how outcomes differed across one particular patient characteristic. This may be the preferred approach when very limited information is available to decision-makers in the real world. Furthermore, we used multivariate regression analyses to control for correlation between patient characteristics. We isolated the relationship between patient characteristics and (1) gross medical savings (excluding costs to achieve weight reduction) using generalized linear regression, (2) type-2 diabetes onset using logistic regression with random effect, and (3) work absenteeism using negative binomial regression.
Analysis of variance and chi-square tests were used to evaluate the significance of variables, where a p-value of 0.05 was considered significant. All economic outcomes were undiscounted.
Results
About half (48.6%) of the analytic file was male, half (50.4%) had pre-diabetes, and 20.7% had type-2 diabetes (Supplementary Appendix Table 1). Starting values include an average age of 48.3 years, BMI of 35.6, HbA1c of 5.8, with elevated blood pressure and cholesterol levels.
Base case outcomes
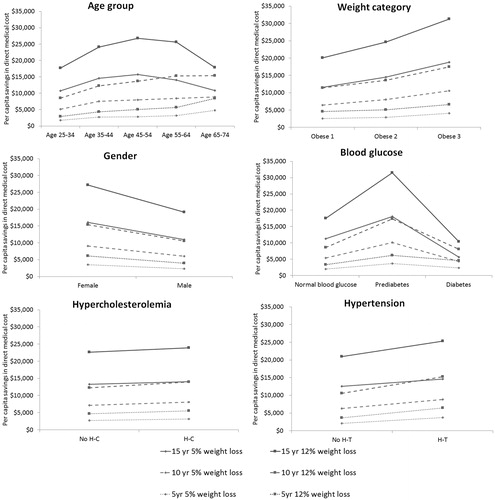
Univariate analyses show a medical savings increase with higher starting obesity class, female, and the presence of pre-diabetes (vs normal glucose levels or diabetes status), hypertension and hypercholesterolemia, with higher levels of savings come from greater weight loss, and a longer time horizon (). As an example, people with category 1, 2, and 3 obese on average save $2,581, $2,912, and $4,069 over 5 years by reducing 5% of extra weight, and $20,117, $24,608, and $31,321 over 15 years by reducing 12%. The accumulated medical saving increase with higher initial age of the studied groups over 5- and 10-year periods, obese individuals aged 65–74, on average, save 1.7–2.9-times more than those aged 25–34 with 5% or 12% weight loss. In comparison, the middle age group (aged 45–64) benefit most over 15 years, with total saving reaching ∼ $15,000 and $26,000 from 5% and 12% weight loss, respectively. Adults with type-2 diabetes had lower savings from weight loss compared to adults with pre-diabetes across all simulated scenarios, e.g. $2,374 vs $3,679 over 5 years from 5% weight loss, $10,413 vs $31,516 over 15 years from 12% weight loss, suggesting the urgency of intervention before progressing to a virtually irreversible state of diabetes.
Figure 4. Per capita savings in direct medical cost from different subpopulations
The multivariate analyses indicate the relationship between patient characteristics and scenario parameters on cumulative average medical savings (). The reference case is female; aged 25–34; obesity class I; normal clinical readings for blood glucose, blood pressure, and cholesterol levels; 5% initial weight loss; and 5-year time horizon. For individuals aged 25–44 medical savings are ∼10 ∼ 20% higher than for people aged 45–74. Savings for obesity class II and III are 5 ∼ 24% less than savings for obesity class I. Savings for a population with pre-diabetes are ∼1.3-times higher than a population with normal glucose levels. Savings are lower for men (relative risk = 0.6), and 1.4-times higher for people with hypertension. Weight loss of 12% is 2.8-times the medical savings of 5% weight loss. Time span of 15 years produces almost 3-times the savings as a 5-year time span.
Table 1. Multivariate analysis on per capita medical savings.
The highest average medical savings can be reached for the female population aged 35–44 with obesity class I, pre-diabetes, hypercholesterolemia, and hypertension that lost 12% of the weight. The univariate and multivariate analyses had similar findings except for initial age group and obesity status—where the multivariate analysis suggested lower medical savings for middle-to-older age with obesity class II or III, than those younger with obesity class I. Hypertension was a more influential factor than hypercholesterolemia in correlation with cost savings.
Multivariate analyses on absenteeism suggest better obesity management may benefit various sub-populations to different extents (Supplementary Appendix Table 2). Higher relative risk means greater reduction in absenteeism due to weight loss. The results are mostly consistent with the regression analysis on direct cost. One exception is that employees aged 45 and above recover 1.4 ∼ 1.6-times more work days due to better obesity management than those younger than 45. Females who are 55–64 years old with obesity class I and pre-diabetes brought in the biggest reduction in missed work days.
We also conducted analysis on how weight loss can reduce type-2 diabetes onset (Supplementary Appendix Table 3). A higher odds ratio (OR) means greater reduction in diabetes onset. Hence an OR >1 means there is a net decrease in diabetes onset, and vice versa. Compared to their peer groups, young adult (aged 25–34) males had a larger reduction in diabetes onset. The benefit will be the largest if they have obesity class III or pre-diabetes.
Direct medical expenditure over 15 years was estimated separately in five care settings (Supplementary Appendix Figures 1–3). On average, 33% of medical spending associated with obesity is on hospital inpatient services, 25% on ambulatory services, 28% on prescription drugs, 5% on emergency care, and 9% on all other costs (e.g. dental, vision, medical equipment, etc.). Among the estimated cumulative saving in medical expenditures under the 12% weight loss scenario, about half is from lower prescription drug expenditures. Inpatient and outpatient/ambulatory services contributed the majority of the remaining cost savings. Similar results were observed for the 5% weight loss scenario.
Alternate scenario outcomes
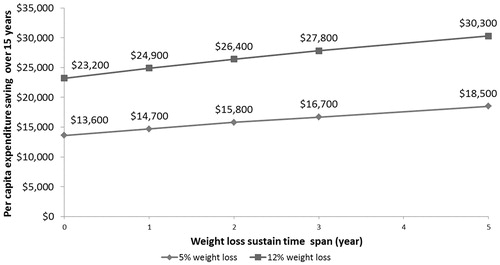
Using a 15-year horizon, cumulative medical savings averaged $23,200 for 12% weight loss and $13,600 for 5% weight loss under the scenarios modeled, where 2/3 of the initial weight loss was regained during years 2–6, followed by natural weight change associated with aging. If the weight regain could be delayed by 5 years, however, then average cumulative benefits rise to $30,300 for 12% weight loss and $18,500 for 5% weight loss. For 5% and 12% weight loss, each additional year of sustained weight loss brought direct medical savings of ∼ $980 and $1,420, respectively ().
Figure 5. Length of sustained weight loss on per capita medical savings over 15 years
Discussion
Obesity and its comorbidities account for a staggering $190.2 billion dollars of direct medical cost in the US every year, or roughly 21% of total annual medical spendingCitation22. The rise in prevalent obesity in the US has outpaced our ability to manage it. Since 1970, the percentage of adult Americans living with obesity has increased from 15% to almost 40% by 2016 [reference 1,23,24].Citation23,Citation24. Its economic burden was predicted to continue rising significantly going forwardCitation25. This indicates that obesity management and prevention measures in the past decades have largely failed to curtail the growth of obesity epidemic, and calls for a more effective approach. Although the burden of obesity and the benefit of weight loss have been studied extensively, few studies have zeroed in on the best target population to maximize the effectiveness of obesity management.
A recent study calculated the incremental medical cost of patients with obesity or overweight compared with those with normal weightCitation26. The researchers categorize all patients into three obesity classes and five chronic health stages with each obesity class. Using an individual Markov model, the study estimated that, for a metabolically healthy 20- and 50-year-old, having obesity added lifetime payer costs averaging $14,059 and $15,925, respectively. These estimations are rather modest compared to this paper. This is likely because patients are loosely categorized into 15 Markov states, which renders the model unable to account for movements between BMI values within an obesity class and how changes in patient risk factors affect healthcare resource use.
The current analysis used a validated microsimulation model to identify the sub-populations most impacted by their weight in economic, productivity, and health realms, as well as to quantify the benefit in each realm under a number of clinically realistic weight loss scenarios. It fully accounted for the heterogeneity within the studied population by taking in individual level health data from a nationally generalizable survey database and describing each individual with more than 40 variables. Major findings from the current study demonstrate the greatest medical cost savings for young women with early metabolic disease (obesity class I, pre-diabetes, and hypertension), whereas the greatest gains in work productivity are seen in metabolically similar slightly older women, and the best prevention of type-2 diabetes is seen when weight loss is achieved in young men with pre-diabetes. Utilization of these data could guide decision-making and resources to those most likely to benefit from better obesity management.
When multiple criteria are factored in at the same time, we suggested young females with early metabolic disease are the best target to control long-term medical spending, probably due to additional health risk link to obesity and diseases in women, e.g. gestational diabetes, thyroid disorders, ovarian disorders, etc. Most cost of obesity studies reported higher burden among a very different population. Moriarty et al.Citation27 estimated the cost of obesity class III to be 3-times higher than that of obesity class I. The population above the age of 45 was found to have the highest lifetime cost of obesity when compared with other age groupsCitation28. Although an older population with obesity class III is associated with a higher short-term economic burden, it is the young population with obesity class I that will bring about the biggest cost savings over the long-term. As with diabetes and hypertension, cumulative exposure of overweight and obesity drive the end organ complications. The current findings extend our previous investigation into the greatest obesity-related healthcare costsCitation5 to identify target populations with the greatest potential for healthcare cost savings.
Obesity carries both economic and human cost. A weight loss of 5% or greater has been found to significantly improve productivity at work and health-related quality-of-life (HRQoL). Based on a longitudinal dataset, absenteeism was reduced by 0.26 days per month and presenteeism decreased 2.9% after weight loss for people who are overweight or obeseCitation29. The current data suggest this productivity improvement will be the highest among a middle aged population with obesity class I, pre-diabetes, and hypertension. Furthermore, both longitudinal and cross-sectional analyses have revealed a statistically significant association between weight and HRQoL, in which the comorbidities of obesity played a significant roleCitation29–32. Using type-2 diabetes onset as a proxy, our study indicated that young males with severe obesity and pre-diabetes are likely to enjoy the biggest improvement in health conditions and HRQoL. These results may be of particular interest to employers invested in the global health of their business.
The prevention of chronic diseases such as type-2 diabetes can lead to significant cost savings. On the national level, chronic diseases were projected to cost US $42 trillion dollars in the next 15 years. Disease prevention through lifestyle intervention alone can reduce the burden by $2 trillionCitation33. One study on lifestyle intervention in the Medicare population found that a 7.3% reduction in weight resulted in $13,390 in medical cost savings over 10 years for those with pre-diabetesCitation17. Another recent publication also showed, over just 3 years, annual expenditures are nearly one third higher for those who develop diabetes in subsequent years relative to those who do not transition from pre-diabetes to diabetesCitation34. This evidence, together with the cost-saving outcomes from our study, suggest weight loss among patients with diabetes does help slow down the severity of the condition; however, there are even greater benefits in both the short- and long-term if we can save patients with pre-diabetes from getting worse.
Moreover, cost savings related to chronic weight management must consider both weight loss and weight loss maintenance. Despite the abundance of published studies on the effectiveness of obesity management programs in reducing weight and the risk of CVD, very few demonstrated the long-term sustainability of weight loss after lifestyle changesCitation35,Citation36. To reflect the real-life effectiveness of obesity management programs, the model base case adopted a conservative assumption that people will regain weight immediately following the initial weight loss. Similar levels of weight regain under different environments were reported in other published literatureCitation37–39. Scenario analysis in our study showed that, on average, each additional year of sustained weight loss will bring about $1,400 and $1,000 in direct medical savings for an initial weight loss of 12% and 5%, respectively. Further research is needed to explore and identify effective ways to sustain weight loss in the sub-populations of interest.
The microsimulation framework has been under continuous improvement, as documented in previous publicationsCitation5,Citation16,Citation19. A first limitation of the study is the lack of a single longitudinal data source with a reasonable long follow-up period and comprehensive health profile information needed for risk prediction. Multiple cross-sectional data sources (e.g. NHANES, UKPDS) were used to inform risk equations. To overcome this limitation model, predictions were validated against longitudinal electronic health records data over a 5 year periodCitation5. Second, long analysis time horizons (i.e. 15 years) means many confounding factors will be more pronounced in later years. For example, if studying the impact of age alone, the age group with the biggest medical savings was 45–54 for 15-year analysis and 65–74 for 10-year analysis. This was likely related to higher mortality for the oldest age group over 15 years. Third, the microsimulation model uses prediction equations based on published studies to simulate a sequence of disease risk from BMI (as shown in ) and other biometric factors, while in reality the effects from different clinical pathways are likely to be integrated and synergistic. Using multiple independent equations could potentially lead to either over-estimation of BMI’s influence through additive pathways or under-estimation on the risk from one pathway at a time. To minimize such influence, an extensive model review by clinical experts and validation through third party data were conducted to ensure the accuracy of simulation outcomesCitation20.
Conclusions
The prevalence of obesity continued to rise in the US, despite the efforts to better manage this chronic condition in the general public. This paper studied the heterogeneity between the many sub-populations affected by obesity, and recommended different priorities for decision-makers. The greatest economic return will be from young females with early metabolic diseases such as pre-diabetes. In contrast, the young population with severe obesity will yield the best health outcomes, and the middle-aged sub-group with mild obesity will produce the biggest productivity improvement. There is no chronic weight management strategy that can address cost, productivity, and health priorities at the same time. This speaks to the importance of involving stakeholders representing health insurers, large employers, small businesses, government, healthcare providers, and patient groups when determining policy directions to better manage America’s obesity epidemic. We encourage policy-makers to consider evidence presented in this study together with other factors such as the equality of healthcare to find where obesity management policy can make the largest impact.
Transparency
Declaration of funding
Funding for this study came from Novo Nordisk, Inc.
Declaration of financial/other relationships
WS, FC, TMD, and TKK provide paid consulting services to the study sponsor for this and other research. TZ is a paid employee of the study sponsor. LP received personal fees for scientific advising and/or speaking from the study sponsor. JME peer reviewers on this manuscript have no relevant financial or other relationships to disclose.
Supplemental Materials - JME Obesity Management Policy Appendix
Download MS Word (138.6 KB)Acknowledgment
The authors wish to thank Joanna Huang for initiating the study and her contributions at the early phase.
References
- Centers for Disease Control and Prevention, Division of Nutrition PAaO. Adult obesity facts. Atlanta, GA, USA: CDCP; 2017. Available at: https://www.cdc.gov/obesity/data/adult.html. [Accessed July 11,2018]
- Flegal K. Epidemiologic aspects of overweight and obesity in the United States. Physiol Behav 2005;86:599-602
- Flegal K, Carroll M, Ogden C, et al. Prevalence and trends in obesity among US adults 1999–2008. JAMA 2010;303:235-41
- Cawley J, Meyerhoefer C, Biener A, et al. Savings in medical expenditures associated with reductions in body mass index among US adults with obesity, by diabetes status. Pharmacoeconomics 2015, July; 33(7):707-22
- Su W, Huang J, Chen F, et al. Modeling the clinical and economic implications of obesity using microsimulation. J Med Econ 2015;18(11):886-97
- Healthy People 2020. Nutrition and weight status; 2015. Office of Disease Prevention and Health Promotion. Washington DC, USA. Available at: http://www.healthypeople.gov/2020/topics-objectives/topic/nutrition-and-weight-status/objectives [Accessed: July 11, 2018]
- Centers for Disease Control and Prevention, Division of Nutrition PAaO. Prevention Strategies & Guidelines. Atlanta, GA, USA: CDCP; 2015. Available at: http://www.cdc.gov/obesity/resources/strategies-guidelines.html [Accessed July 11, 2018]
- National Institutes of Health, National Heart LaBI. Aim for healthy weight: key recommendations. NIH: Bethesda, MD, USA. 2015. Available at: https://www.nhlbi.nih.gov/health/educational/lose_wt/recommen.htm. [Accessed July 11, 2018]
- Knowler WC, Barrett-Connor E, Fowler SE, et al. Reduction in the incidence of type 2 diabetes with lifestyle intervention or metformin. N Engl J Med 2002;346:393-403
- Knowler WC, Fowler SE, Hamman RF, et al. 10-year follow-up of diabetes incidence and weight loss in the Diabetes Prevention Program Outcomes Study. Lancet 2009;374:1677-86
- Forman E, Butryn M, Manasse S, et al. Acceptance-based versus standard behavioral treatment for obesity: results from the mind your health randomized controlled trial. Obesity 2016;24:2050-6
- Apovian CM, Aronne LJ, Bessesen DH, et al. Pharmacological management of obesity: an endocrine Society clinical practice guideline. J Clin Endocrinol Metab 2015;100:342-62
- Wadden T, Foreyt J, Foster G, et al. Weight loss with naltrexone SR/bupropion SR combination therapy as an adjunct to behavior modification: the COR-BMOD trial. Obesity 2011;19:110-20
- Wing RR, Lang W, Wadden TA, et al. Benefits of modest weight loss in improving cardiovascular risk factors in overweight and obese individuals with type 2 diabetes. Diabetes Care 2011;34:1481-6
- Green M, Strong M, Razak F, et al. Who are the obese? A cluster analysis exploring subgroups of the obese. J Public Health 2016;38(2):258-64
- Su W, Chen F, Iacobucci W, et al. Return on investment for digital behavioral counseling in patients with prediabetes and cardiovascular disease. Prev Chronic Dis 2016 Jan 28;13:E13
- Chen F, Su W, Becker S, et al. Clinical and economic impact of a digital, remotely-delivered intensive behavioral counseling program on medicare beneficiaries at risk for diabetes and cardiovascular disease. PLoS ONE 2016;11(10):e0163627
- Ryan D, Jensen M. Managing overweight and obesity in adults: systemic evidence review from the Obesity Expert Panel; 2013; National Heart, Lung, and Blood Institute. Bethesda, MD, USA. Available at https://www.nhlbi.nih.gov/health-topics/managing-overweight-obesity-in-adults. [Accessed July 11, 2018]
- Dall TM, Storm MV, Semilla AP, et al. Value of lifestyle intervention to prevent diabetes and sequelae. Am J Prevent Med 2015;48:271-80
- IHSMarkit Life sciences. Disease prevention microsimulation model technical document. Washington DC, USA: IHSMarkit Life sciences; 2016. Available at: https://ihsmarkit.com/products/healthcare-modeling.html?ocid=g403:globalinsight:social:0004 [Accessed July 11, 2018]
- Centers for Disease Control and Prevention. Recognition program centers for disease control and prevention. Atlanta, GA: CDCP; 2015
- Cawley J, Meyerhoefer C. The medical care costs of obesity: an instrumental variables approach. J Health Econ 2012;31:219-30
- Kranjac A, Wagmiller R. Decomposing trends in adult body mass index, obesity, and morbid obesity, 1971–2012. Soc Sci Med 2016;167:37-44
- Ogden CL, Carroll MD, Fryar CD, et al. Prevalence of obesity among adults and youth: NCHS Data Brief. 2015, November; (219):1-8. Hyattsville, MD, USA
- Wang L, Chyen D, Lee S. The association between body mass index in adolescence and obesity in adulthood. J Adolesc Health 2008;42:512-18
- Fallah-FIni S, Adam A, Cheskin L, et al. The additional costs and health effects of a patient having overweight or obesity: a computational model. Obesity 2017;25:1809-15
- Moriarty J, Branda M, Olsen K. The effects of incremental costs of smoking and obesity on health care costs among adults: a 7-year longitudinal study. J Occup Environ Med 2012;54:286-91
- Kim D, Basu A. Estimating the medical care costs of obesity in the United States: systematic review, meta-analysis, and empirical analysis. Value Health 2016;19:613
- Bilger M, Finkelstein E, Kruger E, et al. The effect of weight loss on health, productivity and medical expenditures among overweight employees. Med Care 2013;51:471-7
- Hassan M, Joshi A, Madhavan S, et al. Obesity and health-related quality of life: a cross-sectional analysis of the US population. Int J Obesity 2003;27:1227-32
- Søltoft F, Hammer M, Kragh N. The association of body mass index and health-related quality of life in the general population: data from the 2003 Health Survey of England. Qual Life Res 2009;18:1299
- Jia H, Lubetkin E. The impact of obesity on health-related quality-of-life in the general adult US population. J Public Health 2005;27:156-64
- Su W. Use predictive modeling to evaluate investment potential and opportunities in chronic diseases. Speech at the 6th US-China Health Summit, Xi'an, China; 2016
- Khan T, Tsipas S, Wozniak G. Medical care expenditures for individuals with prediabetes: the potential cost savings in reducing the risk of developing diabetes. Popul Health Manag 2017;20:389-96
- Piatt G, Seidel M, Powell R, et al. Influence of patient-centered decision making on sustained weight loss and risk reduction following lifestyle intervention efforts in rural Pennsylvania. Diabetes Educ 2016;42:281-90
- Ali M, Echouffo-Tcheugui J, Williamson D. How effective were lifestyle interventions in real-world settings that were modeled on the Diabetes Prevention Program? Health Affairs 2012;31:67-75
- Wing R, Tate D, Gorin A, et al. A self-regulation program for maintenance of weight loss. N Engl J Med 2006;355:1571
- Svetkey L, Stevens V, Brantley P, et al. Comparison of strategies for sustaining weight loss: the weight loss maintenance randomized controlled trial. JAMA 2008;299:1139-48
- Andersen J, Konz E, Frederich R, et al. Long-term weight-loss maintenance: a meta-analysis of US studies. Am J Clin Nutr 2001;74:579-84