
 ?Mathematical formulae have been encoded as MathML and are displayed in this HTML version using MathJax in order to improve their display. Uncheck the box to turn MathJax off. This feature requires Javascript. Click on a formula to zoom.
Abstract
Aims: Multiple sclerosis (MS) is a chronic, autoimmune, and inflammatory disease. If the first-line medicines are not effective enough, specialists will prescribe second-line medicines, such as natalizumab and fingolimod. This study aimed to compare the cost-effectiveness and cost-utility of fingolimod with those of natalizumab in patients with relapsing-remitting multiple sclerosis (RRMS) in Iran, Fars province in 2016.
Materials and methods: This study was a cost-effectiveness and cost-utility study in which a Markov model was used. The study used the census method to evaluate 81 patients with MS in Iran, Fars province who were being treated with fingolimod and natalizumab. In this study, costs were collected from the societal perspective, and the outcomes were the mean of relapse avoided rate and QALY. The cost data collection form, Kurtzke Expanded Disability Status Scale, and EQ-5D-3L questionnaire were used to collect the required data.
Results: The results showed that, compared to natalizumab, patients who used fingolimod had decreased costs (58,087 vs 201,707), increased QALYs (8.09 vs 7.37), and a better relapse avoided rate (6.27 vs 5.83) per patient over the lifetime. The results of the sensitivity analysis showed that the results of the study were robust. Also, the results of the scatter plots showed that fingolimod was more cost-effective based on the QALY and relapse avoided rate in 62% and 56%, respectively, of the simulations for the thresholds below $15,657 for the studied patients.
Conclusions: According to the results of this study, the cost-effectiveness and cost-utility of fingolimod were higher than those of natalizumab. Therefore, it is recommended that treatment with fingolimod be the first priority of second-line treatment for MS patients, and policy-makers and health managers are encouraged to make efforts in order to increase insurance coverage and reduce the out-of-pocket payments of these patients.
Introduction
Multiple Sclerosis (MS) is a chronic, autoimmune, and inflammatory disease that affects and destroys the central nervous system, and the causes of this disease are still unknownCitation1,Citation2. It is also the most common debilitating neurological disease among the people aged 20–40 yearsCitation3. MS can be classified into several categories, including Relapsing Remitting Multiple Sclerosis (RRMS), Primary Progressive Multiple Sclerosis (PPMS), Secondary Progressive Multiple Sclerosis (SPMS), and Progressive Relapsing Multiple Sclerosis (PRMS)Citation4, the most common of which is Relapsing Remitting Multiple Sclerosis (RRMS), and 85% of the patients with MS are in this groupCitation5,Citation6. Also, there is another category of MS entitled Benign MS, in which the patients have very mild relapses and low levels of disability several years after diagnosis, that usually has a low prevalenceCitation7.
The estimates have shown that the prevalence rate of MS in different countries has been between 5–189 per 100,000, with a ratio of three women to one manCitation8,Citation9. In 2013, 2.5 million people worldwide and 350,000 people in the US had been affected by this diseaseCitation10,Citation11. The estimated prevalence rate in the past three decades in Europe was 83 per 100,000 people, and higher rates were observed in northern Europe. Also, the annual incidence of MS in this region was averagely 4.3 per 100,000 peopleCitation12. In Iran, the results of a study showed that the prevalence and incidence rates of MS in 2013 was 54.51 and 5.87 per 100,000, respectivelyCitation13. Also, the prevalence of MS in Fars, a province in southwest Iran, was estimated to be 72.1 per 100,000 people in 2013Citation14.
On the other hand, the results of the studies conducted in Europe and the US showed that the decreased utility scores in MS patients were consistent at between 0.20 and 0.31 out of a range of 0.0–1.0. Studies also have shown that MS affects the patients’ quality-of-life (QoL) and imposed a significant economic burden on the lives of the patients, their families, and the society as a whole, and causes a wide range of costs (including direct, indirect, and other intangible costs)Citation15. The results of a systematic review have shown that the total annual direct and indirect costs per patient for MS treatment in the US have ranged from $8,528–$54,244, as reported by studies published between 2007 and 2012Citation16. The results of another study conducted in 16 European countries showed that the mean annual costs (in €, adjusted for purchasing power parity) per MS patients in 2015 were between 22,800 and 57,500 €PPP according to their disease severity (EDSS score)Citation17. Also, in a study conducted in Iran in 2011, it was estimated that the average total direct and indirect costs per patient with MS were ∼24,475 USD per yearCitation18.
Currently, there are two medicines, namely Fingolimod and Natalizumab, for the second-line treatment. Fingolimod and Natalizumab are stronger than first-line medicines (such as Dimethyl fumarate, Interferon beta 1a, Glatiramer acetate, and Teriflunomide), but have additional risks and complications, and are commonly used for the patients who are resistant to treatment by the first-line medicines. Second-line medicines can effectively reduce the incidence of relapse, but may lead to additional costs due to the monitoring and treatment of their complicationsCitation19,Citation20. Natalizumab (Tysabri) is one of the medicines used in the treatment of MS that was approved by the US Food and Drug Administration (FDA) in 2006Citation21. Fingolimod is also the first oral medicine to treat MS, and was approved by the FDA in 2010Citation22,Citation23.
In general, the results of some studies on the cost-effectiveness of Fingolimod and Natalizumab in the US, the UK, and Spain have shown that the use of Natalizumab is more cost-effective than using FingolimodCitation5,Citation24–27.
Given the different medical costs involved in using these two medicines, and consequently, different financial and economic burdens on the health systems, and also the limited knowledge about the cost-effectiveness and cost-utility of these medicines, and due to the fact that the researchers failed to find a study on the comparison of the cost-effectiveness and cost-utility of these two medicines in Iran, this study was carried out to compare the cost-effectiveness and cost-utility of Fingolimod with those of Natalizumab, both as second-line medicines for patients with Relapsing Remitting Multiple Sclerosis.
Methods
This was a cost-effective and cost-utility study on the patients with multiple sclerosis in Iran, Fars province in 2016, in which the related costs and outcomes data were collected for the studied patients on a cross-sectional basis. It was carried out on the patients referring to the MS Society and the Department of Special Diseases in Iran, Shiraz University of Medical Sciences. According to the statistics provided by the Department of Special Diseases in Shiraz University of Medical Sciences, the numbers of the patients who used Fingolimod and Natalizumab for at least 1 year to treat their disease and were willing to participate in the study were 50 and 31, respectively. Hence, no sampling was performed in this study, and all the patients were entered into the study using the census method.
For all patients participating in this study, the cardiac monitoring and OCT were performed to determine the possible side-effects of taking the studied medicines. Also, some laboratory tests such as CBC, WBC diff/JVC/Bun, Cr/TB test/AST, ALT, and Alk.p Bili (total, direct) were performed for patients who used Natalizumab, and lymphocytes count was performed periodically for patients who used Fingolimod.
This study was approved by the Medical Ethics Committee of Iran, Shiraz University of Medical Sciences. Also, all the patients participating in the study completed the informed consent form. They were free to participate in the study and in the case of unwillingness to continue participation in the project, they could withdraw the study. Moreover, they were assured that their information would remain confidential. It should be noted that, finally, all studied patients completed the study.
Description of the model
In this study, a Markov model was developed to evaluate the cost-effectiveness and cost-utility of Fingolimod compared to those of Natalizumab and to describe the progression of the disease. Like in previous studies, 1-month Markov cycles and the lifetime horizon were considered in this studyCitation28,Citation29. To illustrate the clinical course of RRMS (for example, disease progression and relapse), Kurtzke Expanded Disability Status Scale (EDSS) was usedCitation30. Based on this scale, patients are classified according to the EDSS score.
Different health statuses based on the EDSS score are: EDSS 0–2.5 (no limitation or slight limitation in mobility), EDSS 3–5.5 (moderate mobility limitation), EDSS 6–7.5 (walking with auxiliary equipment or using wheelchairs), EDSS 8–9.5 (limited to bed), death (natural causes or EDSS 10), relapse EDSS 0–2.5 (relapse or a change in disability EDSS 0–2.5), and relapse EDSS 3–5.5 (relapse or a change in disability EDSS 3–5.5)Citation31.
shows the schematic diagram of the Markov model. As can be seen, MS patients can move to a higher EDSS or stay in the same health state based on transition probabilities. They can also be transited to the relapse state (in which they are treated as outpatients or inpatients depending on their disease severity) in EDSS 0–2.5 or EDSS 3–5.5, and remain there for a single cycle. Patients can remain for more than one cycle in any disease state (one EDSS level).
Figure 1. Schematic diagram of the Markov model for MSCitation32.
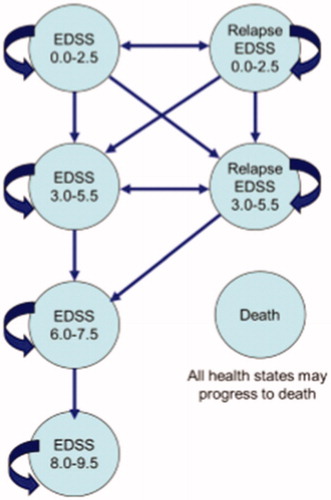
Patients remain in RRMS status as long as they are not transferred to a higher level than EDSS 3–5.5, and, when they are transited to the EDSS 6–7.5 level or higher, they are considered as Secondary Progressive Multiple Sclerosis (SPMS) and their remedial medicines are stoppedCitation28.
The outcomes used in the model included the mean of relapses avoided as effectiveness, and the amount of QALY as utility. The cost data and outcomes (utility and effectiveness) of the model were discounted on the basis of the discount rates of 7.2%Citation33 and 3%Citation34, respectively. In addition, TreeAge Pro 2011 and Excel 2010 software were used to analyze the collected data.
Transition probabilities
All transition probabilities have been reported in according to the previous published studies based on the type of medicines and the EDSSs. It should be noted that, because in the previous published studies some clinical efficacy data had been reported as rates, first, they changed into the transition probabilities using the following formulaCitation35, and then the transition probabilities were entered into the model.
where p = probability; r = instantaneous rate, and t = time.
Table 1. The transition probabilities.
Cost data
In this study, the societal perspective was used to calculate the costs. The related costs from the societal perspective included direct medical costs, direct non-medical costs, and indirect costs. The direct medical costs of each medicine, such as the costs of physicians’ visits, main medicines, laboratory tests, physiotherapy & other services costs, MRIs, hospitalization, and surgeries, were retrospectively determined and collected from January 1, 2016 to January 1, 2017, by using a researcher-made data collection form and referring to the specialists’ offices and the MS Society of Fars province. The direct non-medical costs included the costs of transportation, meals, and accommodation in other cities and the food used by the patients and their families, as well as the costs of taking care of the patients at home, which were determined by asking the studied patients. The indirect costs (the productivity losses) also included the income lost due to outpatient visits, income lost due to hospitalization, and patient’s family costs, which were determined through asking the patients. To calculate the indirect costs, the human capital approach was usedCitation40–42. It should be noted that, although the cost of JCV Ab testing was paid by the company, it is a cost of the health system and, because this study was conducted from the societal perspective, this cost was also included.
Furthermore, for the purpose of international comparison, the costs were converted to US dollars, using the exchange rate of each US dollar equal to 29,500 Rials in 2016Citation43.
Health outcomes
To measure the effectiveness, the mean of relapses avoided rate was used. In order to obtain the mean of relapses avoided rate, the patients were first asked by the researcher about the number of relapses at the time of using each medicine, and the relapse rate for each patient was calculated using the following formula:
Then the relapse rates of all studied patients who used each medicine were summed up and the result was divided into the number of patients who used the same medicines to obtain a mean of relapse rate for each medicineCitation28,Citation44. Next, according to previous studies, the mean of relapse rate before using the medicine was considered as 1.002Citation45, and the mean of relapse rate in the patients participated in this study was subtracted from it to obtain the mean of relapse avoided rate.
The utility scores were calculated using the EQ-5D-3L questionnaire, consisting of five dimensions of mobility, self-care, normal activities, pain/discomfort and anxiety/depression in three levels of no problem, some problems, and extreme problems, and the health outcome was evaluated based on the quality adjusted life years (QALYs)Citation46.
Determining the incremental cost-effectiveness and cost-utility ratio (ICER)
After obtaining the costs, utility scores and effectiveness in the previous stages, the incremental cost-effectiveness and cost-utility ratio were calculated using the following formula:
Sensitivity analysis
Given the fact that any economic evaluation study is associated with the uncertainties, the effects of uncertainties were examined in this study using the one-way sensitivity analysis and probabilistic sensitivity analysis (PSA).
In order to perform the one-way sensitivity analysis, some of the key parameters of the study, such as costs, utility scores, and effectiveness were changed by 20% for each medicine strategyCitation47, based on which Tornado diagrams were drawn.
Also, because all variables of the present study were measurable and probabilistic, they were considered as distributions, so that the beta (β) distributions were used to determine the distributions of transition probabilities and utility values, which were between 0 and 1, and the gamma distribution was used to determine the distribution of costs. Therefore, a second-order Monte Carlo simulation was performed using 5,000 trials for the probabilistic sensitivity analysis.
Results
According to the results of this study, most patients were female (81.47%), housewives (56.79%), and with academic degrees (41.97%), and all the patients were under the coverage of basic insurance. Furthermore, the mean ages of the patients using Fingolimod and Natalizumab were 35.22 ± 7.91 and 35.55 ± 8.11, respectively.
and show the means of costs, utility scores, and relapses avoided in the patients with multiple sclerosis who used Fingolimod and Natalizumab.
Table 2. The means of costs in RRMS patients using Natalizumab and Fingolimod.
Table 3. The means of utility scores and relapses avoided rates in RRMS patients using Natalizumab and Fingolimod.
As shows, the mean direct medical costs of the patients who used Fingolimod and Natalizumab were $918.79 and $3130.53, respectively, and the mean direct non-medical costs for Fingolimod and Natalizumab were, respectively, $227.01 and $460.69. Also, the cost of purchasing the main medicine was the highest direct medical cost in Fingolimod and Natalizumab groups ($457.63 for Fingolimod and $2,359.32 for Natalizumab).
In addition, the cost of transportation and the income lost due to outpatient visits were, respectively, the highest direct non-medical costs and indirect costs in both medicine groups ($183.08 and $84.58 in Fingulimod and $291.42 and $169.02 in Natalizumab).
According to , the highest scores obtained from the EQ-5D-3L questionnaire for MS patients belonged to the patients who used Fingolimod and with EDSS 0–2.5 (0.75 ± 18). Moreover, the highest mean of relapses avoided was observed in the patients using Fingulimod and with EDSS 0–2.5 (0.592 ± 412).
According to and , the results of the cost-utility analysis using the Markov model showed that the mean cost per patient over the lifetime was $58,751 in the Fingolimod arm and the mean QALY was 8.09, but, in the Natalizumab arm, the mean cost and the mean QALY were, respectively, $204,264 and 7.37. Moreover, according to and , the results of the cost-effectiveness analysis using the Markov model showed that the mean cost and the mean relapses avoided were, respectively, $58,087 and 6.27 in the Fingolimod arm, but the mean cost in the Natalizumab arm was $201,707, and the mean relapses avoided was 5.83, as well.
Figure 2. Cost-effectiveness and cost-utility analyses for RRMS patients under treatment with Fingolimod and Natalizumab.
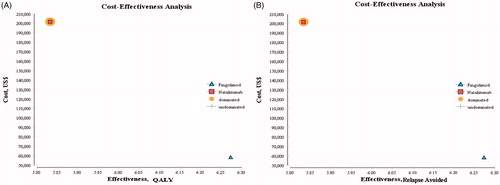
Table 4. The base-case analysis results (the lifetime analysis).
Sensitivity analysis results
One-way sensitivity analysis
According to the Tornado diagram in , the results showed that ICER had the highest sensitivity to the utility of the patients taking Natalizumab, but it had the lowest sensitivity to the costs of the patients taking Fingolimod. Also, in , ICER had the highest sensitivity to the effectiveness of the patients taking Natalizumab, but it had the lowest sensitivity to the costs of the patients taking Fingolimod.
Figure 3. Tornado diagrams of cost-utility and cost-effectiveness of the studied RRMS patients under treatment with Natalizumab and Fingolimod.
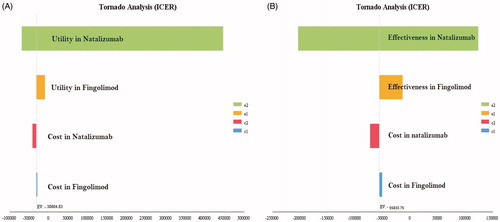
In addition, according to the Tornado diagram in , the changes in many of the input parameters did not have much effect on the results.
Probabilistic sensitivity analysis (PSA)
The results of the uncertainty measurement have been provided using the cost-effectiveness acceptability curves and incremental cost-effectiveness scatter plots, as follows:
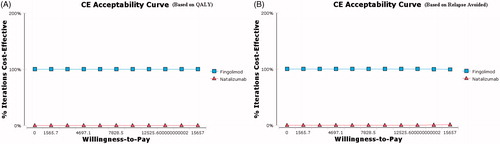
The results of the acceptability curves based on the QALY () and relapse avoided rate () showed that Fingolimod was more cost-effective in 100% of the simulations for the thresholds below $15,657 (3 GDP per capita that this study adopts as its maximum threshold for cost-effectiveness)Citation48.
Figure 4. The cost-effectiveness acceptability curves of Fingolimod vs Natalizumab based on the QALY and relapse avoided rate obtained through the Monte Carlo simulation.
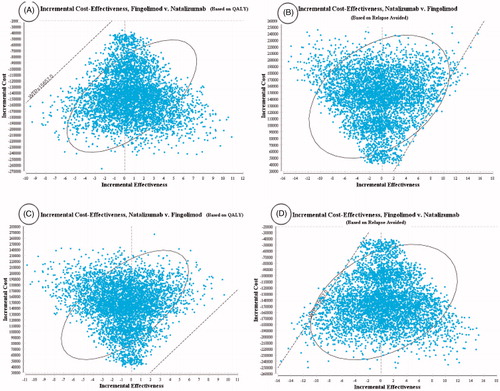
Moreover, the results of the scatter plots based on the QALY () and relapse avoided rate () showed that Fingolimod, respectively, in 62% and 56% of the simulations, was in the accepted area of the cost-effectiveness plane, indicating lower costs and higher effectiveness than Natalizumab and, therefore, was more cost-effective. Also, Natalizumab based on the QALY () and relapse avoided rate (), respectively, in 100% and 99% of the simulations, was above the threshold and, therefore, was inferior and not cost-effective.
Figure 5. The incremental cost-effectiveness scatter plots of Fingolimod vs Natalizumab based on the QALY and relapse avoided rate.
Discussion
In spite of the advances in medical sciences in recent years, most of the existing treatments for MS tend to reduce symptoms or slow down the progression of the disease. Currently, Fingolimod and Natalizumab are used as the second-line treatment of patients with MS in Iran, and if physicians recognize that the first-line medicines are not effective enough, they will prescribe Fingolimod and NatalizumabCitation49. The present study was conducted to determine and compare the cost-effectiveness and cost-utility of these two medicines in patients with relapsing-remitting multiple sclerosis, and it aimed to aid policy-makers and service providers to select the most cost-effective medicine to reduce the rate and severity of the relapses of the disease and to slow down the progression of disability in patients with MS. This study was conducted for the first time in the country for comparing the cost-effectiveness and cost-utility of Fingolimod with those of Natalizumab in patients with multiple sclerosis.
According to the findings of the present study, the treatment with Natalizumab had a mean total cost of $3,873.44 per treatment course, while the mean total cost of treatment with Fingolimod was $1,297.86 per treatment course. Therefore, the mean total cost of treatment per patient treated with Fingolimod was lower than that of Natalizumab. It seems that one of the main reasons for this difference can be the higher cost of purchasing Natalizumab compared to Fingolimod in Iran. The results of this study are consistent with those of the studies conducted by Crespo et al.Citation26, and O’Day et al.Citation5,Citation25.
The direct medical, direct non-medical, and indirect costs of Natalizumab were $3,130.53 (80.82% of total costs), $460.69 (11.89% of total costs), and $282.22 (7.29% of total costs), respectively, while these costs were $918.79 (70.79% of total costs), $227.01% (17.49% of total costs), and $152.06 (11.72% of total costs) in patients under treatment with Fingolimod. Besides, the highest costs in treatment with both medicines were direct costs, and the largest share of these amounts was related to the costs of purchasing the main medicines, which were 75.36% and 49.81%, respectively. In this regard, the results of the present study are in line with those of the studies conducted by Crespo et al.Citation26, and O’Day et al.Citation5,Citation25.
The results of the present study indicated that the highest means of utility scores and relapses avoided rates in treatment with each medicine were observed in patients with EDSS 0–2.5, and, as the disability level increased, the quality-of-life decreased and the relapse rate increased as well. Perhaps the reason is that higher EDSSs usually reduce the effect of medicines and patients shift from the demylinating and inflammation phase into the irreversible degenerative phase. Hence, it is natural for the rate of relapses to increase and for the level of quality-of-life to decreaseCitation50. These results are consistent with those obtained by Gani et al.Citation27, Lee et al.Citation28, Dembek et al.Citation32, and Zhang et al.Citation51.
According to the results of this study, the cost of Natalizumab per patient over the lifetime was $204,264, and its utility score was 7.37, while the cost and utility score of Fingolimod were, respectively, $58,751 and 8.09. Furthermore, the mean relapse avoided rates for Natalizumab and Fingolimod were 5.83 and 6.27, respectively. Therefore, due to the fact that Natalizumab had higher costs, lower utility score, and lower relapse avoided rate, it was considered as the dominated choice in the cost-effectiveness and cost-utility analyses. Thus, Fingolimod was more cost-effective than Natalizumab.
The results of one-way sensitivity analysis showed that, in the cost-effectiveness and cost-utility analyses, the ICER values were negative and most sensitive to the utility score and effectiveness of Natalizumab. However, because the ICER values became positive in the cost-effectiveness and cost-utility analyses, it can be said that, for a short term, Fingolimod was dominant and preferable in terms of both outcomes, but changing the effectiveness, utility, and costs in future may change the dominated option of the study, and it may not be stated with certainty that Fingolimod would be the preferred option. Of course, it depends on the new ICER values and comparing it with the threshold. Furthermore, the results of the probabilistic sensitivity analysis showed that Fingolimod was more cost-effective than Natalizumab and in most cases was in the accepted area (below the threshold). Therefore, the results showed that the sensitivity analysis did not change Fingolimod’s status as the most cost-effective medicine compared to Natalizumab, indicating that the results of the study seemed to be robust.
The studies carried out by Bozkaya et al.Citation24 in the US, O’Day et al.Citation25 in Sweden, and O’Day et al.Citation5 in the US, by using the effectiveness index, indicated the higher cost-effectiveness of Natalizumab than Fingolimod, which was not consistent with the results of this study. One reason for this difference could be the high price of Natalizumab in our country. On the other hand, the results of the study by Montgomery et al.Citation52, by using the utility index (QALY), showed that Fingolimod was more cost-effective, which is in line with those of the present study.
This study had some limitations, one of which was that, considering the limited time available, the patients were only examined during one course of treatment with two medicine strategies. Also, in this study, intangible costs were not taken into account, due to the inability to accurately measure them.
Regarding the generalizability of the results of this study, it can be said that, since Fingolimod and Natalizumab are used in all provinces and medical centers of Iran for treating MS patients, and their prices are the same throughout the country, the results of this study can be generalized to other provinces and the whole country. But, in order to generalize the results of this study to other countries, it is necessary to address some issues, including epidemiology of the disease and demographic structure, the existence of resources, prices, valuation of the outcomes by individuals, thresholds, and the use of various effectiveness indices in different studies, which may affect their results. Therefore, it is necessary to be cautious in generalizing the results of the present study to other countries.
Conclusions
According to the results of this study, Fingolimod was more cost-effective than Natalizumab. Therefore, based on the results of the one-way and probabilistic sensitivity analyses, as long as the study parameters do not change significantly, it is suggested that the Fingolimod strategy be the first priority of the second-line treatment of MS patients, and policymakers and health managers are required to try to increase the insurance coverage and reduce the out-of-pocket payments of these patients.
Transparency
Declaration of funding
There is no funding to declare.
Declaration of financial/other relationships
The authors declare that there are no conflicts of interest. JME peer reviewers on this manuscript have no relevant financial or other relationships to disclose.
Acknowledgments
The present article was extracted from the thesis written by Mehdi Rezaee and was financially supported by Shiraz University of Medical Sciences grant No. 94-01-07-11049. The researchers would like to thank the studied patients for their kind cooperation with the researchers in collecting and analyzing data.
References
- Heisen M, Treur MJ, Hel WS, et al. Fingolimod reduces direct medical costs compared to natalizumab in patients with relapsing–remitting multiple sclerosis in The Netherlands. J Med Econ. 2012;15(6):1149–1158.
- Mao P, Reddy PH. Is multiple sclerosis a mitochondrial disease? Biochim Biophys Acta. 2010;1802(1):66–79.
- Alonso A, Jick SS, Olek MJ, et al. Incidence of multiple sclerosis in the United Kingdom: findings from a population-based cohort. J Neurol. 2007;254(12):1736–1741.
- Bradley W, Daroff R, Fenichel G, et al. Neurology in clinical pratice: Principles of diagnosis and management. 4th ed. New York (NY): Butterworth & Heinemann; 2004.
- O'Day K, Meyer K, Miller RM, et al. Cost-effectiveness of natalizumab versus fingolimod for the treatment of relapsing multiple sclerosis. J Med Econ. 2011;14(5):617–627.
- Milo R, Miller A. Revised diagnostic criteria of multiple sclerosis. Autoimmun Rev. 2014;13(4–5):518–524.
- Pittock SJ, McClelland RL, Mayr WT, et al. Clinical implications of benign multiple sclerosis: a 20-year population-based follow-up study. Ann Neurol. 2004;56(2):303–306.
- Nikfar S, Kebriaeezadeh A, Dinarvand R, et al. Cost-effectiveness of different interferon beta products for relapsing-remitting and secondary progressive multiple sclerosis: decision analysis based on long-term clinical data and switchable treatments. DARU J Pharm Sci. 2013;21(1):50–63.
- Saraste M, Atula S, Hedman K, et al. Humoral response to John Cunningham virus during pregnancy in multiple sclerosis. Mult Scler Relat Disord. 2018;21:11–18.
- Dilokthornsakul P, Valuck RJ, Nair KV, et al. Multiple sclerosis prevalence in the United States commercially insured population. Neurology. 2016;86(11):1014–1021.
- Koch-Henriksen N, Sorensen P. The changing demographic pattern of multiple sclerosis epidemiology. Lancet Neurol. 2010;9(5):520–532.
- Pugliatti M, Rosatia G, Carton H, et al. The epidemiology of multiple sclerosis in Europe. Eur J Neurol. 2006;13(7):700–722.
- Etemadifar M, Izadi S, Nikseresht A, et al. Estimated prevalence and incidence of multiple sclerosis in Iran. Eur Neurol. 2014;72(5–6):370–374.
- Izadi S, Nikseresht AR, Poursadeghfard M, et al. Prevalence and incidence of multiple sclerosis in Fars province, Southern Iran. Iran J Med Sci. 2015;40(5):390–395.
- Trisolini M, Honeycutt M, Wiener J, et al. Global economic impact of multiple sclerosis. London: Multiple Sclerosis International Federation. 2010. Available from: www.msif.org/en/…/global_economic_impact_of_ms/index.html/. Last accessed on 2016.9.12
- Adelman G, Rane SG, Villa KF. The cost burden of multiple sclerosis in the United States: a systematic review of the literature. J Med Econ. 2013;16(5):639–647.
- Kobelt G, Thompson A, Berg J, et al. New insights into the burden and costs of multiple sclerosis in Europe. Mult Scler J. 2017;23(8):1123–1136.
- Imani A, Rasekh HA, Asefzadeh A, et al. Cost analysis of disease-modifying drugs therapy for patients with multiple sclerosis in Iran. Am J Sci Res. 2012(67):95–102. ISSN 2301-2005 Issue 67 (2012), pp. 95–102 . Available from: http://kmu.ac.ir/Images/Archive/cost%20analysis%20in%20MS_1.PDF
- Thompson JP, Abdolahi A, Noyes K. Modelling the cost effectiveness of disease-modifying treatments for multiple sclerosis: issues to consider. Pharmacoeconomics. 2013;31(6):455–469.
- Gajofatto A, Benedetti MD. Treatment strategies for multiple sclerosis: when to start, when to change, when to stop? World J Clin Cases. 2015;3(7):545–555.
- Auerbach P. Natalizumab for multiple sclerosis. Harvard Health Publication. Drugs.com. 2016. Available from: http://www.drugs.com/cdi/natalizumab.html. Last accessed on 2016.4.20.
- Scott LJ. Fingolimod: a review of its use in the management of relapsing-remitting multiple sclerosis. CNS Drugs. 2011;25(8):673–698.
- Warnke C, Stüve O, Hartung HP, et al. Critical appraisal of the role of fingolimod in the treatment of multiple sclerosis. Neuropsychiatr Dis Treat. 2011;7(1):519–527.
- Bozkaya D, Livingston T, Migliaccio-Walle K, et al. The cost-effectiveness of disease-modifying therapies for the treatment of relapsing-remitting multiple sclerosis. J Med Econ. 2016;20(3):297–302.
- O’Day K, Meyer K, Stafkey-Mailey D, et al. Cost-effectiveness of natalizumab vs fingolimod for the treatment of relapsing-remitting multiple sclerosis: analyses in Sweden. J Med Econ. 2015;18(4):295–302.
- Crespo C, Izquierdo G, García-Ruiz A, et al. Cost minimisation analysis of fingolimod vs. natalizumab as a second line of treatment for relapsing-remitting multiple sclerosis. Neurologia. 2014;29(4):210–217.
- Gani R, Giovannoni G, Kemball DB, et al. Cost-effectiveness analyses of natalizumab (Tysabri®) compared with other disease-modifying therapies for people with highly active relapsing-remitting multiple sclerosis in the UK. Pharmacoeconomics. 2008;26(7):617–627.
- Lee S, Baxter DC, Limone B, et al. Cost-effectiveness of fingolimod versus interferon beta-1a for relapsing remitting multiple sclerosis in the United States. J Med Econ. 2012;15(6):1088–1096.
- Noyes K, Bajorska A, Chappel A, et al. Cost-effectiveness of disease-modifying therapy for multiple sclerosis: a population-based study. Neurology. 2011;77(4):355–363.
- Kurtzke JF. Rating neurologic impairment in multiple sclerosis: an extended disability status scale (EDSS). Neurology. 1983;33(11):1444–1452.
- Hohol M, Orav E, Weiner H. Disease steps in multiple sclerosis: a simple approach to evaluate disease progression. Neurology. 1995;45(2):251–255.
- Dembek C, White LA, Quach J, et al. Cost-effectiveness of injectable disease-modifying therapies for the treatment of relapsing forms of multiple sclerosis in Spain. Eur J Health Econ. 2014;15(4):353–362.
- Abdoli G. Estimation social discount rate for Iran. Econ Res Rev. 2009;10(3):135–156.
- Robberstad B. Estimation of private and social time preferences for health in northern Tanzania. Soc Sci Med. 2005;61(7):1597–1607.
- Sun X, Faunce T. Decision-analytical modelling in health-care economic evaluations. Eur J Health Econ. 2008;9(4):313–323.
- Scalfari A, Neuhaus A, Degenhardt A, et al. The natural history of multiple sclerosis: a geographically based study 10: relapses and long-term disability. Brain. 2010;133(Pt 7):1914–1929.
- Runmarker B, Andersen O. Prognostic factors in a multiple sclerosis incidence cohort with twenty-five years of follow-up. Brain. 1993;116(Pt1):117–134.
- Hoyert DL, Xu J. Deaths: preliminary data for 2011. Natl Vital Stat Rep. 2012;61(6):1–51.
- Cohen JA, Barkhof F, Comi G, et al. Oral fingolimod or intramuscular interferon for relapsing multiple sclerosis. N Engl J Med. 2010;362(5):402–415.
- Liljas B. How to calculate indirect costs in economic evaluation. Pharmacoeconomics. 1998;13(1):1–7.
- Hasoumi M, Nasehi M, Khakian M, et al. Cost of illness of tuberculosis in Tehran in the year 2011. Mater Sociomed. 2014;26(5):339–342.
- Lopez-Bastida J, Oliva-Moreno J, Perestelo-Perez L, et al. The economic costs and health-related quality of life of people with HIV/AIDS in the Canary Islands, Spain. BioMed Central Health Serv Res. 2009;9(1):1–8.
- Exchange rate. 2016. Available from: http://www.cbi.ir/default_en.aspx. Last accessed on 2016.9.17
- Roskell NS, Zimovetz EA, Rycroft CE, et al. Annualized relapse rate of first-line treatments for multiple sclerosis: a meta-analysis, including indirect comparisons versus fingolimod. CMRO. 2012;28(5):767–780.
- Inusah S, Sormani MP, Cofield SS, et al. Assessing changes in relapse rates in multiple sclerosis. Mult Scler 2010;16(12):1414–1421.
- Touboul C, Amate P, Ballester M, et al. Quality of life assessment using EuroQOL EQ-5D questionnaire in patients with deep infiltrating endometriosis: the relation with symptoms and locations. Int J Chron Dis. 2013;2013:1–7.
- Briggs A, Sculpher M, Buxton M. Uncertainty in the economic evaluation of healthcare technologies: the role of sensitivity analysis. Health Econ. 1994;3(2):95–104.
- The World Bank. GDP per capita, PPP (current international $). 2016. World Bank Group. Available from: https://data.worldbank.org/indicator/NY.GDP.PCAP.PP. Last accessed on 2016.9.17
- Cohen BA. Identification, causation, alleviation, and prevention of complications (ICAP): an approach to symptom and disability management in multiple sclerosis. Neurology. 2008;71(24):14–20.
- Achiron A, Gabbay U, Gilad R, et al. Intravenous immunoglobulin treatment in multiple sclerosis. Effect on relapses. Neurology. 1998;50(2):398–402.
- Zhang X, Hay JW, Niu X. Cost effectiveness of fingolimod, teriflunomide, dimethyl fumarate and intramuscular interferon-beta1a in relapsing-remitting multiple sclerosis. CNS Drugs. 2015;29(1):71–81.
- Montgomery SM, Maruszczak MJ, Slater D, et al. A discrete event simulation to model the cost-utility of fingolimod and natalizumab in rapidly evolving severe relapsing-remitting multiple sclerosis in the UK. J Med Econ. 2017;20(5):474–482.