
Abstract
Background: Model structure, despite being a key source of uncertainty in economic evaluations, is often not treated as a priority for model development. In oncology, partitioned survival models (PSMs) and Markov models, both types of cohort model, are commonly used, but patient responses to newer immuno-oncology (I-O) agents suggest that more innovative model frameworks should be explored.
Objective: A discussion of the theoretical pros and cons of cohort level vs patient level simulation (PLS) models provides the background for an illustrative comparison of I-O therapies, namely nivolumab/ipilimumab combination and ipilimumab alone using patient level data from the CheckMate 067 trial in metastatic melanoma. PSM, Markov, and PLS models were compared on the basis of coherence with short-term clinical trial endpoints and long-term cost per QALY outcomes reported.
Methods: The PSM was based on Kaplan-Meier curves from CheckMate 067 with 3-year data on progression free survival (PFS) and overall survival (OS). The Markov model used time independent transition probabilities based on the average trajectory of PFS and OS over the trial period. The PLS model was developed based on baseline characteristics hypothesized to be associated with disease as well as significant mortality and disease progression risk factors identified through a proportional hazards model.
Results: The short-term Markov model outputs matched the 1–3 year clinical trial results approximately as well as the PSMs for OS but not PFS. The fixed (average) cohort PLS results corresponded as well as the PSMs for OS in the combination therapy arm and PFS in the monotherapy arm. Over the lifetime horizon, the PLS produced an additional 5.95 quality adjusted life years (QALYs) associated with combination therapy relative to ipilimumab alone, resulting in an incremental cost-effectiveness ratio (ICER) of £6,474 per QALY, compared with £14,194 for the PSMs which gave an incremental benefit of between 2.2 and 2.4 QALYs. The Markov model was an outlier (∼ £49,000 per QALY in the base case).
Conclusions: The 4- and 5-state versions of the PSM cohort model estimated in this study deviate from the standard 3-state approach to better capture I-O response patterns. Markov and PLS approaches, by modeling state transitions explicitly, could be more informative in understanding I-O immune response, the PLS particularly so by reflecting heterogeneity in treatment response. However, both require a number of assumptions to capture the immune response effectively. Better I-O representation with surrogate endpoints in future clinical trials could yield greater model validity across all models.
Introduction
To make well informed decisions on the use of new technologies, health technology assessment (HTA) agencies need to consider the most appropriate evidence regarding effectiveness and cost-effectiveness. As HTAs are increasingly conducted close to the time of product launch, extrapolation of critically important data from pivotal trials is necessary to generate estimates of cost per life year or quality adjusted life year (QALY) gained over extended time horizonsCitation1.
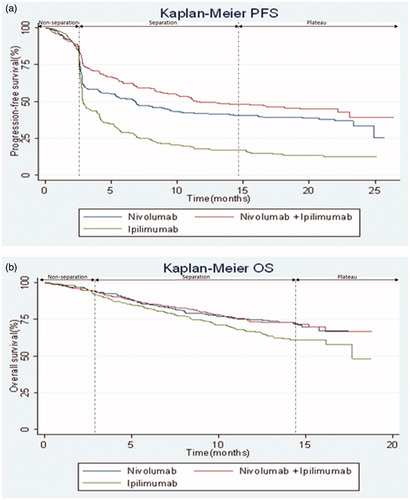
In the field of oncology, a well-established approach to cost-effectiveness analysis applied to a range of cancers is the cohort approach of the 3-state partitioned survival model (PSM)Citation2, based on the direct implementation of clinical trial endpoints of progression-free survival (PFS) and overall survival (OS). Tried and tested approaches to evaluation may, however, need to be re-assessed as treatment modalities evolveCitation3. A case in point is the emergence of immuno-oncology (I-O) therapies characterized by a markedly different mechanism of action compared with conventional anti-cancer agents. The standard 3-state PSM is not well equipped to capture the unconventional response patterns demonstrated in the respective Kaplan-Meier (K-M) curves, PFS being used to illustrate the distinct phases to which I-O has given riseCitation4. It is debatable whether a simple distinction between progressed and progression can adequately reflect the variety of responses seen with I-O therapies. These include a plateau of long-term survival in some patientsCitation5, response after apparent disease progression triggered by delayed treatment effects when the immune response is activated () and maintenance of health-related quality-of-life over prolonged time periodsCitation6.
Figure 1. CheckMate 067 Kaplan-Meier curves for the co-primary endpoints of (a) progression-free survival (b) overall survival. Abbreviations. PFS, progression-free survival; OS, overall survival.
These responses have been observed particularly with single-agent I-O treatment, although less so with combinations of I-O and chemotherapy or small molecule drugs. However, with the continued development of new I-O molecules and I-O based therapies, it is desirable to explore methods that can accurately capture immune system interactions, irrespective of indication or treatment approachCitation7. Novel approaches that are better able to capture immune responses rather than the more immediate but short-lived response associated with conventional chemotherapy or radiotherapy have not yet found a wide audience.
General considerations
Although economic modeling inevitably requires some simplification of reality to make the decision problem tractable, the model structure should still capture the key elements of the problem to be addressed and be able to adequately reflect the trajectory of disease, patients’ response to treatment, and their impact on costs and long-term health outcomes. Model structure can be a key source of uncertainty in the analysisCitation8, but it generally receives less attention than other sources of uncertainty, such as that associated with model inputs (parameter uncertainty)Citation9. Often the rationale for model selection is unclear and dependent on individual judgment rather than methodological guidance.
Representation of disease
Existing guidance on model structure emphasizes the importance of the way in which the clinical decision problem is represented. Sculpher et al.Citation10 recommend that a model structure should be chosen which is consistent with the stated decision problem and a theory of disease, a view echoed by Brennan et al.Citation11, who argue that the states in a model should represent the natural history of disease, available treatments, and treatment effects.
Good practice guidance for decision analytic modeling notes that “the structure of the model should be consistent with a coherent theory of the health condition being modeled”, and “with available evidence regarding causal linkages between variables”Citation12. Similarly, in the specific context of state transition models (STMs), which define the decision problem in terms of a number of health states and movements between those states; “specification of states and transitions should generally reflect the biological/theoretical understanding of the disease or condition being modeled”Citation13. Inclusion of additional subdivisions of health states may be based on their clinical importance or their relation to mortality, quality-of-life/patient preference, and resource use/costsCitation12.
Study question
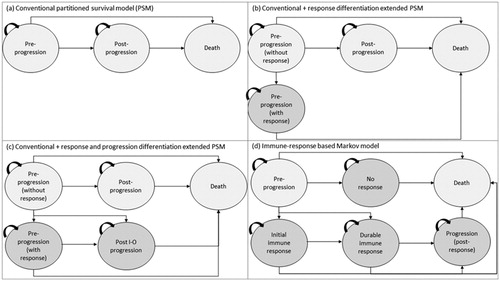
This paper extends a program of research being undertaken on innovative approaches to economic modeling and more accurate survival extrapolationCitation14 in I-O to represent clinical trial and long-term observational data in a more meaningful way. It builds on a previous comparisonCitation15 of the 3-state PSM and extensions thereof vs a Markov modeling approach (a commonly used structure in health care evaluations) to represent I-O therapies ().
Figure 2. PSM-based and Markov model frameworks modeled over a lifetime horizon with monthly cycles: (a) conventional three state partitional survival model (PSM); (b) conventional PSM with the additional health state to differentiate levels of response; (c) conventional PSM with additional states to differentiate levels of response and progression types; and (d) immune-response based Markov model.
The paper considers the role of patient level simulation (PLS) as an alternative and exploratory model framework to evaluate a case study of combination I-O therapy vs I-O monotherapy. The contribution of the paper is, therefore, to apply a novel modeling approach to an illustrative evaluation of cost-effectiveness within the field of oncology. While the clinical trial on which the analysis is based compared nivolumab alone, ipilimumab alone, and nivolumab/ipilimumab combination, this evaluation focuses on a comparison of combination therapy and ipilimumab monotherapy only. As an illustrative evaluation, it is not intended to capture all comparisons of clinical interest, but is consistent with the comparison undertaken for NICE Technology Appraisal 400 (TA400)Citation16.
Each modeling approach has advantages and disadvantages, but all have the same underlying objective of generating estimates of cost-effectiveness. The models reported here are all underpinned by a common patient level data set drawn from an ongoing phase III trial (CheckMate 067) in metastatic melanomaCitation17,Citation18. The analysis is based on clinical trial end-points observed at up to 3 years (4-year data has now been publishedCitation19). Modeled estimates of PFS and OS over the time horizon of the trial (up to 3 years) were compared with the trial results and the different models were compared in terms of the estimates of costs, life years and QALYs generated. Before reporting the methods and results of the empirical research, the paper reviews the theoretical pros and cons of the three modeling approaches explored.
Organization of the paper
The following section on “Model structures” provides an overview of cohort models, which encompass PSM and Markov approaches, as opposed to individual level models, including the advantages and disadvantages of each. The “Methods: empirical analysis” section focuses on the methods used to estimate the PLS. As the methods underpinning the PSM-based and Markov models have been described elsewhereCitation15, they are not reproduced in detail here. Considering that the choice of model is as much an empirical as a theoretical questionCitation20, the “Results” section compares the PLS results with those of the PSM-based and Markov models. A “Discussion” section reflects on the methods and findings of the analysis.
Model structures
Partitioned survival model (PSM)
PSMs or area under the curve models proceed by segmenting the population of interest on the basis of the OS curve. Typically, patients are differentiated according to whether or not their disease has progressed. PFS is plotted as a sub-set of OS, with the difference between OS and PFS comprising those with progressive disease. The PSM has become a standard approach in the evaluation of treatments for advanced and metastatic cancersCitation2. illustrate the basic PSM structure which has been applied to the analysis of I-O therapiesCitation21,Citation22, and the extensions of that model developed in previous researchCitation15. These structures are underpinned by K-M curves from the CheckMate 067 trial on OS () and PFS ().
Pros and cons
Patient level or published K-M data on OS and PFS can be mapped directly on to the 3-state model, making the PSM straightforward to implement from a single trial, with few assumptions required. Time in progression is calculated as the area between OS and PFS (hence the term “area under the curve”). As with other cohort models, “pre-progression” and “progressed” health states follow an average patient population in which homogeneity of risks is assumedCitation11. Although variability in baseline characteristics (e.g. age) can be captured using suitable age-dependent distributions, an average cohort is still used to generate model outcomesCitation20.
Exploratory analysis has illustrated that it is possible to augment the basic model with additional health states to capture the I-O response more appropriately, by defining health states in terms of treatment responseCitation15. Here, further assumptions are required to extend the analysis beyond the time horizon of the trial in the absence of well-established approaches to the extrapolation of response measures. Whereas trial data for OS and PFS (and extrapolated estimates for these variables) can be mapped directly on to the 3-state model, the addition of further health states requires assumptions to allocate patients between states beyond the clinical trial period (as summarized in ). In addition, despite the size of the study on which the current analysis was based, small patient numbers in each response group, particularly at the last observation point, can be problematic for accurate extrapolationCitation23.
Table 1. Overview of the model frameworks for partitioned survival model and its variants, Markov model and patient level simulation explored to capture I-O treatment response.
Departing from the PSM
Transitions over time between OS and PFS are not directly modeled by the standard PSM, the assumption being that patients can either remain in their current health state or move to a worse health state. A closely aligned limitation is that the relationships between “early” and “late” progressed patients and death are not fully captured in PSM approaches, as extrapolations may not explicitly reflect the evolving proportion of patients who have progressedCitation2. Enhancing the descriptive accuracy of the model with the addition of health states introduces the possibility (and increasingly the need as the number of states increases) to model transitions between states explicitly. STMs, of which the two main types are cohort-based and individual patient-based models, provide the flexibility to allow for time-dependent parameters, time to an event or repeated eventsCitation13.
Markov models
Markov models are possibly the most commonly used form of cohort-based model in healthcare, to the extent that the term has come to be used synonymously with cohort modelsCitation24.
These models are structured around a mutually exclusive and exhaustive set of health states with movements between those states governed by a set of transition probabilities. They simulate a single cohort and allow transitions to occur at specified intervals (the cycle length), but do not capture interactions or dependencies between individuals (which are important in, for example, communicable diseases). A modeled individual can be in only one state in any cycleCitation13.
Pros and cons
Markov models explicitly address transitions between different health states, providing a flexible approach to the modeling of disease dynamics. They diverge from the PSM as trial endpoints do not directly populate health states (partitioned models incorporate trial results to inform the model and predict the trial outcomes). The main advantage of these models and other STMs evaluated at the cohort level is that they are transparent and are relatively straightforward to develop, analyze, and communicate, provided the number of health states is not excessiveCitation13.
The main limitation of Markov models is the “memoryless” assumption, whereby the probability of making the transition from one state to another is independent of the path taken to reach that state. Transition probabilities depend neither on past states, nor on the time spent in the current state (and methods to relax this restriction, such as the use of tunnel states, are themselves not without difficulties). The implication is that homogeneity is assumed within health states, since all those within a given health state will have the same probability of making the transition to any other stateCitation20.
While violations of the Markovian assumption can be accommodated, either by the creation of temporary health states (tunnel states)Citation25 or defining the transition matrix as a multi-dimensional arrayCitation24, these approaches themselves have drawbacks. The use of tunnel states can potentially increase the number of model states and respective assumptions, resulting in large relatively unmanageable modelsCitation13, and may be feasible only for an extremely limited number of itemsCitation26. The use of multidimensional arrays, on the other hand, can yield an undesirable increase in the complexity of the modelCitation27. Where significant heterogeneity exists between patients in terms of response to treatment (perhaps driven by variation in baseline characteristics), then an individual level model may be preferred.
Patient level simulation
In contrast with cohort-based models, individual level STMs accrue costs and outcomes in patients progressing through the model one at a time (microsimulation). Transitions are determined by Monte Carlo simulations in which a random number draw in the range 0–1 determines whether an individual satisfies the criterion for making a transition (the random number is greater or less than a pre-determined probability). Model outcomes are reported for each individual patient rather than an aggregated group of similar patients. PLS can be based on health states, analogous to STMs, on events of interest, using discrete event simulation (DES), or a combination of the twoCitation24.
Pros and cons
A key feature of the PLS approach is that it can record the event history for individual patients and use this to update the risk of future events accordingly. It therefore avoids the “memory-less” characteristic of Markov models. Additionally, PLS has an advantage in analyzing the relationship between the variation in patient characteristics (patient heterogeneity) and model outcomes.
Drawbacks of the PLS approach in the form of computational and data requirements have been acknowledged, with a greatly increased number of calculations and, consequently, the use of specialist software required by DES. The data requirements of DES and difficulties of communicating this type of model mean that it may not be as transparent as other model types. At the same time, attempting to replicate the approach using a cohort-based model has been argued to be equally onerous in terms of data requirementsCitation27. To compare PSM, Markov, and PLS models on a like-for-like basis, this study reports a comparison using the same model framework, data set and software, and survival analysis as set out below.
Patient heterogeneity
In a Markov model, the impact of patient heterogeneity is explored to an extent by sensitivity analysis, but primarily by estimating the model for separate sub-groups, which are defined in advance, to estimate results in broad categories of patients (e.g. 5-year age bands) for whom outcomes are expected to be similarCitation24. Where patient characteristics cannot be defined in advance but there is a non-linear relationship with outcomes, model averaging can sometimes be used. However, these approaches have shortcomings when the number of categories needed to define homogeneous groups is large. In addition, partitioning data as done with the PSM is reliant on observed clinical data, while cohort models generally organize the model structure to predict the reported results (over the time horizon of the clinical trial, with methods of extrapolation used to model longer term outcomes)Citation14. To provide an adequate representation of the range of patient profiles, it has been argued that the number of groups would need to be vast, requiring the analyst to focus on a feasible few. In this case, PLS can represent an analytically more tractable solutionCitation27, with baseline heterogeneity between patients found in one review to be the most important reason stated by study authors for conducting a simulation modeling approachCitation28.
Methods: empirical analysis
CheckMate 067
CheckMate 067 (NCT01844505) is an ongoing phase 3 double-blind clinical trial of 945 treatment-naïve patients with metastatic melanoma who were randomly assigned 1:1:1 to the following regimes (as defined by the clinical trial)Citation17:
3 mg/kg of nivolumab (n = 316) every 2 weeks (plus matched ipilimumab placebo);
3 mg/kg of ipilimumab (n = 315) every 3 weeks for 4 doses (plus matched nivolumab placebo); and
1 mg/kg of nivolumab plus 3 mg/kg of ipilimumab (n = 314) every 3 weeks for 4 doses followed by 3 mg/kg of nivolumab every 2 weeks.
The models discussed here are based on these dosing schedules rather than the 480 mg (extended treatment option) every 4 weeks schedule available with nivolumabCitation29. Patients in the combination therapy and ipilimumab monotherapy arms were stratified by tumor programmed death-ligand 1 (PD-L1) status, BRAF mutation status (the gene that encodes the B-Raf protein), and the American Joint Committee on Cancer (AJCC) metastasis stage. Treatment continued until disease progression (defined by the response evaluation criteria in solid tumors [RECIST] 1.1 system)Citation30, except in patients with clinical benefit and without substantial adverse events (AEs), or when patients experienced unacceptable toxicity or withdrew from the studyCitation17. Baseline characteristics were balanced across all treatment groups. Patients had a mean age of 60 years, 58% had stage M1c disease, 36.1% had elevated lactate dehydrogenase level (LDH), 31.5% had a BRAF mutation, and 23.6% had positive PD-L1 status. Further details are documented elsewhereCitation17.
PFS and OS were coprimary clinical endpoints of the CheckMate 067 trial. Secondary endpoints included objective response rate (ORR) and tumour PD-L1 expression as a predictive biomarker for efficacy outcomes and safetyCitation17. The K-M curves for PFS and OS serve to illustrate an initial period of delayed response, a subsequent period when differences between treatments become apparent through a separation of the curves and, finally, the emergence of a plateau of long-term survival.
Recap of the partitioned survival and Markov models
Full details of the methods used in developing the PSM and Markov approaches (lifetime models with monthly cycles) in I-O have been reported elsewhereCitation15 (with an overview provided in and outcomes provided in ).
Table 2. Clinical trial and model outcomes for the combination and ipilimumab treatment arms compared across alternative model frameworks for partitioned survival, Markov, and the patient level simulation.
In summary, the standard 3-state PSM was extended initially by splitting the pre-progression state into two to generate a four-state model and, secondly, by incrementally splitting the post-progression state into two to generate a five-state model. The aim of defining “conventional” and “I-O” responses was to produce a set of health states which allowed a more nuanced representation of the immune response (). Patients observed in the clinical trial were allocated to the new health states using data on complete or partial response to treatment, as summarized by best overall response (BOR). In other respects, the models were estimated in the same manner as the standard three-state PSM.
Extending from the PSM approaches, a Markov model was constructed around six states defined in terms of event rates for PFS/OS, differentiated by BOR, and intended to provide further granularity in capturing the immune responseCitation15. To avoid excess complexity, movements between states were dictated by a single (time independent) state transition matrix based on OS, PFS, and treatment response observed over the full clinical trial period rather than at each individual measurement point. This is a simplification of actual patient transitions between health states and levels of response (which may vary by cycle). Initial testing of the PSM and Markov models was conducted using CheckMate 066, comparing nivolumab with dacarbazineCitation15, whereas the current study applies these models, together with the PLS, to the CheckMate 067 study.
Patient level simulation model overview
A PLS with monthly cycles over a lifetime horizon was developed in Microsoft Excel. The model simulates adult patients with metastatic melanoma (), to assess immune response patterns following the initiation of each of the I-O treatments investigated in the CheckMate 067 trial. Consistent with the Markov model and for comparative purposes, the PLS captured the outcomes of treatment through the following events: pre-progression (PP), no immune response (NIR), initial immune response (IIR), durable immune response (DIR), and post-response progression (PRP)Citation15.
Figure 3. Model schematic for the patient level simulation.
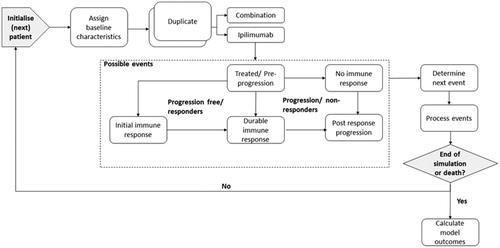
The model schematic illustrates disease progression and the possible transitions between states (). Each transition probability is calculated using time-to-event data for OS and PFS and by applying assumptions based on the best overall response (BOR) to define the immune response states. Each patient pair enters the simulation in the treated/pre-progression state. After initiation of ipilimumab or combination therapy, the patient may remain progression free without a clinical response (stable disease), based on the absence of a clinically defined change in tumor size. If the patient responds to treatment, there are two options. Either the patient can have a partial response (PR) or a complete response (CR). These groups were characterized as experiencing an initial immune response (IIR) or a durable immune response (DIR), respectively. If the patient progresses, tumor growth can take place as post-response progression (PRP) or following initiation of treatment, the latter characterized as “No immune response” (NIR). The occurrence of these events is determined by the Monte Carlo simulation until the end of the model period defined by its time horizon or until death, which can occur from any state.
As the PLS is stochastic in nature and, therefore, yields a distinct set of results with each simulation, stability in the results was achieved by running 100 replications of 10,000 patient pairsCitation31. Mean costs and quality adjusted life years (QALYs) over a lifetime time horizon, together with the confidence intervals (CIs), were obtained across the 100 replications. The UK National Health Service (NHS) perspective on costs was adopted, and a discount rate of 3.5% was applied to both costs and QALYsCitation32. Similarly, the mean clinical outcomes for OS and PFSCitation14 model outputs were based on an average of the same replicated simulations over the lifetime horizon, with respective CIs provided, to allow comparisons with reported trial outcomes.
The simulation is consistent with previous survival analysis applications used to derive appropriate functional forms and define respective survival functions, with model selection based on visual inspection of K-M plots and goodness-of-fit criteria (Akaike Information Criterion (AIC) and Bayesian Information Criterion (BIC))Citation33,Citation34.
Baseline characteristics and regression analyses
The model builds on an earlier analysis of standard (including Weibull, loglogistic, lognormal) and flexible functions with restricted cubic splines (RCS) with 0, 1, and 2 knots to identify the most appropriate way of modeling the unique K-M curves from the CheckMate 067 trialCitation14. Parametric survival models allow predictions at any time point for any set of covariates and more flexible representations of the hazard function such as RCS can be applied, with the ability to capture the plateau observed in K-M curves (unlike traditional parametric methods assessed including Weibull). RCS models are polynomial functions fitted to segmented portions of the data at points known as knots, which define the degree of smoothness of the data fitCitation35. Survival analysis applied to CheckMate 067 data found that RCS models performed better than conventional functions in terms of goodness-of-fit and coherence, with longer term data, as supported by research conducted by Gibson et al.Citation14.
To assess the risk of mortality and disease progression, baseline characteristics consistent with those reported in key CheckMate 067 trial publicationsCitation17,Citation18 were considered. These were (as set out in and ): age (centred to the mean trial age of 60 years, reflective of the individual patient data [IPD]), gender, BRAF mutation, Eastern Cooperative Oncology Group (ECOG) performance status score, metastasis stage, brain metastases, LDH, and PD-L1.
Table 3. Coefficients for significant covariates to estimate adjusted hazard for overall survival for Weibull and restricted cubic spline (1 and 2 knots) functions.
Table 4. Coefficients for significant covariates to estimate adjusted hazard for progression free survival for Weibull and restricted cubic spline (1 and 2 knots) functions.
A backward stepwise selection procedure was implemented using a Cox regression model applied to IPD to derive a model with optimal explanatory power. The least statistically significant variables were eliminated until only those explanatory variables with statistical significance above the pre-defined level (p ≤ 0.1, as few patient characteristics were captured with a p-value of 0.05) remained. The selection procedures were conducted separately for OS and PFS. Significant variables were captured for each endpoint, and collectively across endpoints in the predicted baseline hazard. Hazard ratios were derived from Weibull and proportional hazards RCS (1 and 2 knots) models to estimate the adjusted survival estimates for each patient profile in the PLS ( and Citation4).
Base case and scenarios
The base case PLS model uses the baseline characteristics of the average trial patient to allow comparability of the clinical and economic trial outcomes with those of the cohort models. The model health states for treated/pre-progression and the proportion of patients achieving an initial and/or durable immune response are used to estimate PFS model outcomes. The proportion of fatal events (possible from all health states) is used to estimate the OS model outcomes. Scenario analysis considers a cohort which is heterogeneous in terms of its baseline characteristics and illustrates the impact on the economic outcomes, particularly when using different survival distributions (Supplementary Table S1).
Data sources
Costs
A common methodological approach to costing was adopted in each model. Consistent with the manufacturer’s submission to NICE (TA400), resource use prior to death uses a structure based on time since treatment initiation (first year, second year, third and subsequent years) and proximity to death. One-off costs were associated with treatment initiation and end-of-life care, while costs for treated/PP, NIR, IIR, DIR, and PRP in the first, second, and third and later years were based on monthly costs ().
Table 5. Key model input parameters values used to populate the patient level simulation.
Drug costs and costs associated with AEs were determined by whether patients were on treatment or off treatment. Resource use and unit costs associated with AEs were drawn from the manufacturer’s submission, and appropriately uprated (drug wastage was not considered here). The model assumes a maximum time on treatment of 2 years. Following treatment discontinuation, patients move on to best supportive care (BSC), which has a zero-intervention cost, but still includes routine healthcare costs. This approach is recognized as a simplification, but a reasonable approximation to clinical practice. Unit costs were drawn from standard sources (e.g. NHS Reference Costs, PSSRU Costs of Health and Social Care and the British National Formulary). Costs were uprated from 2014/2015 to 2015/2016 prices using the Hospital and Community Health Services (HCHS) pay and prices indexCitation36. All drug costs are at current list prices, excluding confidential discounts, such as those provided under Patient Access Schemes which are currently in placeCitation16,Citation37,Citation38.
Health state utilities
Health-related quality-of-life (HRQoL) estimates suitable for calculating QALYs were drawn from the literature and assigned to relevant model health states, without differentiation between patients on- or off-treatment or between treatment arms. In the absence of literature for specific health states defined in the models presented, proxy utilities based on closely related health states were included in all modelsCitation39.
To capture the variation in utilities with treatment response, the analysis used estimates from a universal set of utility values relating to the clinical response states for partial response (PR), stable disease (SD) and progressive disease (PD) in advanced melanoma for the general UK population. The utility estimate for SD (0.770; standard error (SE) = 0.02) was allocated to the treated/PP health state. The PR (0.850, SE = 0.02) utility value was assigned to the IIR and DIR states (in the absence of information to differentiate between the level of response). The PD (0.590, SE = 0.02) estimate was assigned to NIR and PRP states (in the absence of information to differentiate between progression in responders and non-responders)Citation39.
Results
Partitioned survival and Markov models
compares the results of the Markov model with those of the PSM and its variants. In line with previously reported resultsCitation15, the PSM-based models provided close alignment between modeled and 1–3 year trial results for OS and PFS in the ipilimumab arm and PFS in the combination therapy arm. In contrast, while the Markov model produced OS estimates similar to those of the PSMs, the model substantially overstated PFS, particularly in the ipilimumab arm (by around 3-fold or greater).
Patient level simulation: base case
Regression analyses
Based on the analyses for OS and PFS, the baseline characteristics included in the model simulation were age, LDH, metastasis stage, ECOG score, PD-L1, and a dummy variable representing treatment group. Based on the AIC/BIC tests, and consistent with previous (PSM and Markov) models, the RCS with 1 knot was assessed as the most appropriate survival model for both OS and PFS and, therefore, adopted in the base case.
Overall survival and progression free survival
Modeled OS for combination treatment was 84%, 70%, and 58% in years 1, 2, and 3, respectively. Modeled OS outcomes were 15% and 9% higher than the published trial outcomesCitation17,Citation18 at years 1 (73.0%; 95% CI = 68–78%) and 2 (64.0%; 95% CI = 59–69%), respectively, but matched the clinical trial results at year 3 (58.0%). Median OS (mOS) was not reached in the CheckMate 067 trial, but the model predicts mOS of 63.0 (95% CI = 3–219) months. This can be interpreted as 5-year survival of ∼ 50%, which is plausible given the 3-year updates showing the K-M curve starting to plateau across all treatment arms, with a slight reduction from months 36 to 45 (from 58% to ∼ 55% OS, based on visual inspection of the K-M curveCitation34), but will need to be validated once further data becomes available (4 year data having recently been published where the mOS still has not been reachedCitation19). Additionally, the CI for mOS implies that the average patient could experience a survival benefit of up to 18 years (although applicable to < 3% of patients in the simulation). When compared with the 10-year pooled analysis in melanoma showing OS with ipilimumab of 20%Citation5, the PLS predicted that only 14.2% will experience survival beyond 10 years. This considerably under-estimated the long-term estimates for the combination treatment arm relative to pooled ipilimumab data (where the combination arm would be expected to perform better than the single I-O therapy), although a comparison with general population background mortality could have provided additional validation.
Modeled PFS for the combination treatment arm was 53%, 48%, and 45% at years 1, 2, and 3, respectively. This was greater than that reported in the trial (50%, 43%, and 39%) by 6–15%. Median PFS (mPFS) of 11.5 (95% CI = 2–47) months obtained from the model was comparable with the trial outcome. Based on the CI, a small number of patients can remain progression-free with combination treatment for up to 4 years, although this is based on < 2% of the simulations, with the remainder experiencing progression within 4 years.
For the ipilimumab arm, modeled OS at years 1 (79%), 2 (61%), and 3 (47%) varied by 18–38% from the trial outcomes (67%, 45%, and 34%), and modeled mOS, at 46.8 (95% CI = 3–163) months, was almost 2.5-times the figure obtained in the trial. However, mOS is comparable with recurrence-free survival for ipilimumab vs placebo reported by Eggermont et al.Citation40 of ∼ 45% at 48 months (based on visual inspection of the K-M curve at 4 years). PFS for the ipilimumab arm at years 1 (19%), 2 (14%), and 3 (12%) compared with the trial outcomes of 18%, 12%, and 10%. Modeled mPFS of 8 (95% CI = 2–25) months was almost 2.5-times the published trial result (2.8 months, observed in 30% of the simulated patients).
Compared with the Markov model, the PLS amplified the OS estimates, although the model generated estimates for PFS at years 1–3 in both treatment arms which more closely reflect the trial results, and an estimate of mPFS in the combination treatment arm, which is closer to the trial result. The closest correspondence between modeled PFS and PFS, and modeled OS and OS, as reported in the trial, was found for the PSM models which are based on direct implementation of the clinical trial endpoints with additional health states introduced to capture I-O responses.
Economic model outcomes
The total lifetime cost of treating a patient with combination therapy in the PLS model was £126,523, compared with £88,009 for ipilimumab, giving an incremental cost of £38,513 ().
Table 6. Discounted economic trial and model outcomes for total costs and total QALYs across the combination and ipilimumab treatment arms.
Over the lifetime horizon, there were an additional 5.95 QALYs associated with the combination therapy relative to ipilimumab alone, resulting in an incremental cost-effectiveness ratio (ICER) of £6,474 per QALY gained. This lies well within NICE’s lower reference point of £20,000 per QALY. The PLS gave an almost 3-fold increase in incremental QALY benefit for the combination regimen compared with the submitted manufacturer’s model which showed incremental gains of 2.19 QALYs and 2.26 QALYs for BRAF-negative and positive patients, respectively, and compared with the cohort models considered (ranging from 2.16 to 2.43 QALYs). These findings were a consequence partly of the utilities allocated to the immune response states and of greater survival benefits given by the PLS, with more flexible data fits used in survival extrapolation. The PLS generated a greater incremental cost associated with combination therapy when compared with all the other models except the Markov model.
Scenario analyses
Scenario analyses are presented in Supplementary Table S1. Under the Weibull distribution, combination therapy was estimated to cost £147,480 and to generate 9.83 QALYs, compared with a total cost of £91,040 and 3.12 QALYs for ipilimumab. The resulting incremental cost of £56,441 and incremental QALYs of 6.71 yielded a cost/QALY of £8,410. The RCS with 2 knots yields lower total costs in each treatment arm, but a similar incremental cost of £35,369 and lower total QALYs for each treatment. The lower incremental QALY gain of 3.74 QALYs yielded a cost per QALY of £9,466. Alternative distributions increase the overall cost/QALY from the baseline, with the Weibull providing the largest incremental cost and a comparable QALY difference.
Under the heterogeneous scenario, which generates unique patient characteristics in each simulation, the total costs in the combination therapy and ipilimumab arms were £94,466 and £69,991, respectively. The incremental cost of £24,476 was lower than both the base case and the scenarios for Weibull (£56,441) and RCS with 2 knots (£35,369). Total QALYs were 5.83 and 2.46 QALYs for the combination and ipilimumab treatment arms, respectively, giving an incremental QALY gain of 3.37 QALYs. This was comparable with the incremental QALY for RCS with 2 knots (3.74) and lower than the base case (5.95) or Weibull (6.71) outcomes.
OS in the heterogenous patient simulation for the combination therapy was lower than or equivalent to that observed in the trial (73%, 64%, and 58%), with comparable modeled OS in year 1 (73%), but greater divergence in years 2 (52%) and 3 (37%). The mOS of 19.7 (95% CI = 2–87.02) months was significantly lower than the base case result (63 months) and lower than the other cohort models (30 months). Similarly, for PFS rates, modeled PFS in the heterogenous population (38%, 32%, and 30%) was lower than the trial results (50%, 43%, 39%) for years 1–3. The modeled mPFS of 7.34 (95% CI = 2– 37) months was also lower than the trial results (11.5 months).
OS for the heterogenous population in the ipilimumab arm was lower for years 1–3 (65%, 40%, and 25%) than the trial results (67%, 45%, and 34%). The model’s reported mOS of 14.5 (95% CI = 2–65) months is lower than the trial result of 20 months, although less divergent than the base case (46.8 months). For the PFS rates, modeled outcomes (8%, 5%, and 4%) were lower than the trial results (18%, 12%, and 10%) for years 1–3, and mPFS was greater for the PLS at 4.8 (95% CI = 2–16) months than reported in the trial, although more closely comparable than the base case (8 months).
Discussion
This paper contributes to ongoing research exploring more innovative model frameworks and survival analysis methods to capture I-O responses in the context of methodological guidance on the structuring of economic models. Although model structure has not been as extensively covered in the literature as other model features, the guidance which is available tends to stress the advantages of retaining simplicity while capturing the essential features of the condition and treatments considered. For example, Philips et al.Citation41 recommend that the model structure should be as simple as possible given the decision problem/disease being considered, while Brennan et al.Citation11 propose that it is desirable to keep the number of states to a minimum. International Society for Pharmacoeconomics and Outcomes Research (ISPOR) guidelinesCitation12 propose that a model should be the simplest form which still captures the underlying essentials of the disease process and interventions. Although simplicity (in terms of model size rather than modeling technique) may be preferred on the grounds of ease of validation (or may be enforced by data limitations), the consequence may be in effect to fix one or more parameters compared with a more complex model. Reducing from a complex to a simpler model needs to be justified either by claiming that the results are robust to changes in the parameter(s) concerned or because the data are of sufficiently high quality to treat the value(s) concerned as fixedCitation20. Where it is not possible to achieve an adequate compromise between granularity in the representation of disease dynamics and model complexity, more flexible modeling techniques, potentially involving increased computational requirements, may be needed.
The 3-state PSM model commonly used in the economic evaluation of oncology drugs has the advantage of simplicity, but may fail to capture unconventional response patterns to I-O, such as a plateau of long-term survival observed in some patients, and patient heterogeneity. While the range of health states can be increased, there are limits to the extent to which the OS curve can be subdivided within the PSM framework. The use of STMs such as Markov models can cope with an almost unlimited number of health states, but the probabilities of moving between them may be restricted to time-independent uniform transition probabilities dictated by data availability. The poorer correspondence with short-term trial results found in this study for the Markov model compared with the PSMs was likely due to the Markov model’s use of average transition probabilities that do not capture time-dependence in treatment response, with time-dependent transitions found to be unachievable from the patient level trial data.
In order to account for patient heterogeneity more fully, a PLS model was aligned to the CheckMate 067 trial to capture immune response patterns and the results compared with those of cohort models by analysing the clinical and economic outcomes. The model captured the most significant baseline characteristics related to OS and PFS (those with a P-value ≤ 10%). The characteristics of age, LDH, metastasis stage, ECOG score, and PD-L1 were identified as significant using a backward stepwise selection procedure by applying a Cox regression model. Baseline hazards and adjusted survival were modeled using the most suitable data fit of RCS with 1 knot. To assign patients to health states, which were not directly reported in the trial, observations on BOR were applied to OS and PFS to give the most appropriate representations of health states, in alignment with previous analyses. Proxies from the literature to best reflect the costs and utilities relevant to the modeled states were also appliedCitation15. Some of the differences in model results could be due to the greater maturity of the PFS data, for which the tail end of the data is more stable than is the case with the less mature OS data. Low patient numbers at the tail could impact survival fits, a feature which affects the PSM based approaches as they are directly implemented from the survival data. For the Markov model, based on transition probabilities mapped from individual patient data, accuracy may have been improved with an increased level of granularity in the data.
The main contribution of this research is to demonstrate the flexibility of the PLS and its scope for modeling complex problems. The ability to allow for baseline heterogeneity has the potential to improve model validity without having to create sub-groups (as required in cohort models), notwithstanding the many assumptions applied to capture the immune response within this model framework. The PLS provides an alternative framework worthy of consideration to further explore potential characteristics which could help identify patients most likely to respond to treatment (e.g. according to the biomarkers being extensively researched), analyse treatment effects for patient profiles seen in clinical practice, and inform discussions around HTA for I-O agents. Improved ways of assessing the value of I-O therapies can help clinicians to optimize care for their patients and healthcare decision-makers to make the best use of their limited budgets.
Recently, the Drug Utilization Sub-Committee (DUSC) of the Australian Department of Health noted that the average age of the patients receiving melanoma treatment under the Pharmaceutical Benefits Scheme (PBS) had increased from 63 years in 2014 to 68 years in 2017, which is generally older than the clinical trial populations (e.g. CheckMate 067 of 60 years) on which economic evaluations are based. The DUSC recognizes inconsistency between clinical trial outcomes and clinical practice, where anticipated therapeutic benefits may differ when used in older patients, or in patients with poorer performance status, although the treatment lines may be a confounding factorCitation42. Additionally, hyperprogressive disease (HPD) is a new emerging pattern observed in cancer patients treated by anti-PD-1/PD-L1 relating to acceleration of disease progression in a sub-set of patients that may result from the deleterious effect of immune checkpoint blockade in I-O. The prevalence, natural history, and predictive factors of HPD remain unknown. Research into the tumor growth rate (TGR) is being undertakenCitation43 and further warrants a better understanding of clinical activity and response in patients.
As the I-O landscape evolves, there is a need to reflect the mechanism of action more accurately in clinical trial endpoints, as the pre-progression and progressive states which form the basis of the common 3-state PSM are not well equipped (due to their high-level aggregation) to capture treatment responses such as pseudo-progressionCitation15,Citation44,Citation45. The addition of surrogate endpoints or further emphasis on clinical endpoints already reported including ORR may prove useful in future evaluations. Recommendations for reporting clinical trials to address unique efficacy, toxicity and combination and sequencing aspects of immuno-oncology have been reported by the Trial Reporting in I-O (TRIO) guidanceCitation46.
A limitation of the current research is that the ability to exploit the advantages of Markov and PLS models to map trial outcomes is constrained by the extent to which clinical data can capture the range of immune responses. Although the quality of data available to populate the model affects the validity of all model frameworks, it particularly limits the PLS and Markov models due to the additional assumptions required. Therefore, as more innovative frameworks are developed to better capture I-O concepts, the data used to populate economic models should also better represent those concepts. To further validate I-O representations, long-term data is needed to benchmark clinical trends implied by economic models and explain model outcomes. Potential future research with PLS, such as the updating of risk factors with each event experienced, is similarly data dependent and can potentially provide more disaggregated results to illustrate the greatest value of I-O treatments.
Across all model frameworks, more research is needed alongside clinical trials to identify differences in costs and utilities across a broader range of health states. If successful in capturing the pattern of I-O responses and patient movement, alternatives to the standard PSM including Markov and PLS could be explored to identify preferred modeling approaches. Future applications which could usefully be explored include the use of I-O agents in combination with small molecules, anti-vascular endothelial growth factors (anti-VEGF), or chemotherapy, and in a range of therapeutic indications. It is intended that the models developed here should have wide application in I-O. Further improvements in the understanding of immune responses with different I-O approaches could help to inform decisions around the choice of model and refine the way in which treatment effects are represented in economic models.
Transparency
Declaration of funding
Bristol-Myers Squibb (BMS) funded the research.
Declaration of financial/other interests
AJG, DT and YY were employed by BMS. NB, EJG, IK and CP were employed by Wickenstones Ltd, which was funded by BMS to undertake the research. GD, DL and PM have received consultancy fees and have been reimbursed for travel expenses to attend advisory board meetings related to this research. A peer reviewer on this manuscript discloses their role as a co-author of two CheckMate 067 clinical manuscripts, but they have not published, or collaborated, with any of this manuscript’s authors. Peer reviewers on this manuscript have received an honorarium from JME for their review work, but have no other relevant financial relationships to disclose.
Author contributions
All authors contributed to study conception and design and drafted the manuscript. NB and IK developed the economic models and performed the respective data analysis. CP provided the writing, editorial assistance, and quality assurance of the manuscript content. EG is the guarantor of the research.
Compliance with Ethical Standards
The protocol and amendments for the CheckMate 067 trial were reviewed by the institutional review board at each trial site. The study’s Independent Data Monitoring Committee (DMC) was established to provide oversight on the safety and efficacy considerations and provide advice to the sponsor regarding actions the DMC deemed necessary for the continuing protection of subjects enrolled in the study. The trial was conducted in accordance with the provisions of the Declaration of Helsinki and with Good Clinical Practice guidelines as defined by the International Conference on Harmonization. All the patients provided written informed consent before enrollment.
Acknowledgements
The authors would like to thank Michael Lees for initiating this research program and providing valuable insight at all stages of the research. The authors are grateful to Charles Percival for conducting the survival analyses.
Data availability statement
Data supporting the research can be found in the respective articles documenting the clinical outcomes of the CheckMate 067 trialCitation17,Citation18. Since this analysis was conducted, 4-year data has been publishedCitation19.
Additional information
Funding
References
- National Institute for Health and Care Excellence (NICE). Proposals for increasing capacity within NICE’s technology appraisal. London: NICE; 2017.
- Woods B, Sideris E, Palmer S, et al. NICE DSU technical support document 19: partitioned survival analysis for decision modelling in health care, a critical review. Sheffield: University of Sheffield; 2017.
- Miller JD, Foley KA, Russell MW. Current challenges in health economic modelling of cancer therapies: a research inquiry. Am Health Drug Benefits. 2014;7:153–162.
- Mcdermott D, Lebbé C, Hodi FS, et al. Durable benefit and the potential for long-term survival with immunotherapy in advanced melanoma. Cancer Treat Rev. 2014;40:1056–1064.
- Schadendorf D, Hodi FS, Robert C, et al. Pooled analysis of long-term survival data from phase II and phase III trials of ipilimumab in unresectable or metastatic melanoma. J Clin Oncol. 2015;33:1889–1894.
- Long GV, Coon C, Gilloteau I, et al. Effect of nivolumab on health-related quality of life in patients with treatment naïve advanced melanoma: results from the phase III CheckMate 066 study. Ann Oncol. 2016;27:1940–1946.
- Harris SJ, Brown J, Lopez J, et al. Immuno-oncology combinations: raising the tail of the survival curve. Cancer Biol Med. 2016;13:171–193.
- Strong M, Oakley JE, Chilcott J. Managing structural uncertainty in health economic decision models: a discrepancy approach. Appl Stat. 2012;61:25–45.
- Claxton K, Sculpher M, McCabe C, et al. Probabilistic sensitivity analysis for NICE technology assessment: not an optional extra. Health Econ. 2005;14:339–347.
- Sculpher K, Fenwick M, Claxton E. Assessing quality in decision analytic cost-effectiveness models. A suggested framework and example of application. Pharmacoeconomics. 2000;17:461–477.
- Brennan R, Chick A, Davies SE. A taxonomy of model structures for economic evaluation of health technologies. Health Econ. 2006;15:1295–1310.
- Weinstein MC, Brien BO, Hornberger J, et al. Principles of good practice for decision analytic modeling in health care evaluation: report of the ISPOR task force on good research practices -modeling studies. Value Heal. 2003;6:9–17.
- Siebert U, Alagoz O, Bayoumi AM, et al. State-transition modeling: a report of the ISPOR-SMDM modeling good research practices task force-3. Value Heal. 2012;15:812–820.
- Gibson E, Koblbauer I, Begum N, et al. Modelling the survival outcomes of immuno-oncology drugs in economic evaluations: a systematic approach to data analysis and extrapolation. Pharmacoeconomics. 2017;35:1257–1270.
- Gibson E, Begum N, Koblbauer I, et al. Modelling the economic outcomes of immuno-oncology drugs: alternative model frameworks to capture clinical outcomes. Clin Outcomes Res. 2018;10:1257–1270.
- National Institute for Health and Care Excellence (NICE). Final appraisal determination Nivolumab in combination with ipilimumab for treating advanced melanoma. London: NICE; 2016.
- Larkin J, Chiarion-Sileni V, Gonzalez R, et al. Combined nivolumab and ipilimumab or monotherapy in untreated melanoma. N Engl J Med. 2015;373(1):23–34.
- Wolchok JD, Chiarion-Sileni V, Gonzalez R, et al. Overall survival with combined nivolumab and ipilimumab in advanced melanoma. N Engl J Med. 2017;377:1345–1356.
- Hodi FS, Chiarion-Sileni V, Gonzalez R, et al. Nivolumab plus ipilimumab or nivolumab alone versus ipilimumab alone in advanced melanoma (CheckMate 067): 4-year outcomes of a multicentre, randomised, phase 3 trial. Lancet Oncol. 2018;19:1480–1491.
- Barton P, Bryan S, Robinson S. Modelling in the economic evaluation of health care: selecting the appropriate approach. J Health Serv Res Policy. 2004;9:110–118.
- National Institute for Health and Care Excellence (NICE). Single Technology Appraisal: Pembrolizumab for treatment PD-L1 positive Non-small cell lung cancer after platinum-based chemotherapy [ID840]. London: NICE; 2016.
- Wang J, Chmielowski B, Pellissier J, et al. Effectiveness of pembrozilumab versus ipilimumab in ipilimumab-naive patients with advanced melanoma in the United States. J Manag Care Spec Pharm. 2017;23:184–194.
- Tremblay G, Haines P, Briggs A. A criterion-based approach for the systematic and transparent extrapolation of clinical trial survival data. JHEOR. 2015;2:147–160.
- Davis S, Stevenson M, Tappenden P, et al. NICE DSU technical support document 15: cost-effectiveness modelling using patient level simulation. Sheffield: University of Sheffield; 2014.
- Sun X. Markov. Modelling in healthcare economic evaluations. Chin J Evid-based Med. 2007;7:750–756.
- Caro JJ, Möller J, Getsios D. Discrete event simulation: the preferred technique for health economic evaluations? Value Heal. 2010;13:1056–1060.
- Davis S, Heard J. A review of the Bristol-Myers Squibb/AstraZeneca economic model on the cost-effectiveness of dapagliflozin. NICE DSU, Sheffield: University of Sheffield; 2012.
- Karnon J, Afzali H. When to use discrete event simulation (DES) for the economic evaluation of health technologies? A review and critique of costs and benefits of DES. Pharmacoeconomics. 2014;32:547–558.
- Bristol-Myers Squibb (BMS) [internet]. First-line therapy for patients with BRAF V600 WT metastatic melanoma: dosing and administration. Location: Princeton. [cited 2018 Sept 3]. Available from: http://www.opdivohcp.com/metastatic-melanoma/dosing/dosing-administration
- Eisenhauer EA, Therasse P, Bogaerts J, et al. New response evaluation criteria in solid tumours: Revised RECIST guideline (version 1.1). Eur J Cancer. 2009;45:228–247.
- Cao Q, Buskens E, Feenstra T, et al. Continuous-time semi-Markov models in health economic decision making: an illustrative example in heart failure disease management. Med Decis Mak. 2016;36:59–71.
- National Institute for Health and Care Excellence (NICE). Guides to the methods of technology appraisal. London: NICE. 2013.
- Rutherford MJ, Crowther J, Lambert PC. Using restricted cubic splines to approximate complex hazard functions in the analysis of time-to-event data: a simulation study. J Stat Comput Sim. 2015;85:777–793.
- Royston P, Lambert PC. Flexible parametric survival analysis using Stata: beyond the Cox model. College Station: Stata Press. 2011.
- Tutkun A, Yeldan M, Ilhan H. Flexible parametric survival models: An application to gastric cancer data. Int J Adv Appl Sci. 2017:4(1):91–95.
- Curtis L, Burns A. Unit costs of health & social care. Canterbury PSSRU. 2016. 195–197.
- BNF, „Opdivo® (Bristol-Myers Squibb)”, 2017. London: BNF Publications. [cited 2017 Apr 3]. Available from: https://www.evidence.nhs.uk/formulary/bnf/current/8-malignant-disease-and-immunosuppression/81-cytotoxic-drugs/815-other-antineoplastic-drugs/nivolumab/nivolumab/opdivo
- BNF, "Yervoy® (Bristol-Myers Squibb)", 2017. London: BNF Publications. [cited 2017 Apr 3]. Available from: https://www.evidence.nhs.uk/formulary/bnf/current/8-malignant-disease-and-immunosuppression/81-cytotoxic-drugs/815-other-antineoplastic-drugs/ipilimumab/ipilimumab/yervoy
- Beusterien KM, Szabo SM, Kotapati S, et al. Societal preference values for advanced melanoma health states in the United Kingdom and Australia. Br J Cancer. 2009;101:387–389.
- Eggermont AMM, Chiarion-Sileni V, Grob JJ, et al. Prolonged survival in stage III melanoma with ipilimumab adjuvant therapy. N Engl J Med. 2016;375:1845–1855.
- Philips Z, Ginnelly L, Sculpher M, et al. Review of guidelines for good practice in decision-analytic modelling in health technology assessment. Health Technol Assess. 2004;8:1–158.
- Drug Utilisation Sub-Committee (DUSC). Drug utilisation sub-committee outcome statement. Canberra: DUSC; 2018.
- Champiat S, Dercle L, Ammari S, et al. Hyperprogressive disease is a new pattern of progression in cancer patients treated by anti-PD-1/PD-L1. Clin Cancer Res. 2017;23:1920–1928.
- Campbell C. Health technology assessment decisions in immuno-oncology therapies: results, rationales, and trends. Value Heal. 2017;20:A401.
- Duchnowska R. Pseudoprogression during immunotherapy of cancers. Oncol Clin Pract. 2017;13:57–60.
- Tsimberidou AM, Levit LA, Schilsky RL, et al. Trial reporting in immuno-oncology (TRIO): an American Society of Clinical Oncology-Society for Immunotherapy of Cancer statement. J Immunother Cancer. 2018;6:1–10.