
Abstract
Objectives: Hepatorenal Syndrome (HRS) is characterized by renal failure in patients with advanced chronic liver disease (CLD) and is the leading cause of hospitalizations in CLD. This study examines the clinical and economic burden, outcomes, and unmet need of HRS treatment in US hospitals.
Method: A retrospective cohort study was conducted based on a large electronic health records database (Cerner HealthFacts) with records for hospitalized HRS patients from January 2009–June 2015. Demographics, clinical characteristics, treatment patterns, and economic outcomes were analyzed. Prognostic indicators of cirrhosis, kidney injury, end-stage liver disease, and acute-on-chronic liver failure were used to determine mortality risk.
Results: A total of 2,542 patients hospitalized with HRS were identified (average age = 57.9 years, 61.8% males, 74.2% Caucasian), with an average total hospital charge of $91,504 per patient and a mean length of stay (LOS) of 30.5 days. The mortality rate was 36.9% with 8.9% of patients discharged to hospice. Of all patients, 1,660 patients had acute kidney injury, 859 with Stage 3 disease, and 26.7% had dialysis. The 30-day readmission rate was 33.1%, 41% of which were unplanned. Nearly one-third of study patients had commercial insurance (30.2%), followed by Medicare (29.9%); hospital charges varied by LOS, receipt of dialysis, and discharge status. Regression analysis demonstrated that HRS costs are associated with LOS, dialysis, and hospital mortality.
Conclusion: HRS is associated with poor outcomes and high hospital costs. Analysis of HRS cost drivers demonstrated an unmet need for additional treatment options to improve outcomes in this patient population.
Introduction
Hepatorenal Syndrome (HRS) is a serious, life-threatening condition characterized by development of acute or sub-acute renal failure in patients with advanced chronic liver disease (CLD). HRS often arises from portal hypertension due to cirrhosis, severe alcoholic hepatitis, hepatitis C, or as a consequence of metastatic tumors, however it may also be due to acute hepatic failure of any originCitation1,Citation2. It is associated with poor prognosis, with most severe patients requiring hospitalization. In fact, HRS is the leading cause of hospitalizations among all patients with CLDCitation3; therefore, management of patients with HRS is time and resource intensive, representing significant costs to hospitals. In 2015, the total incidence of CLD in the US was 1.5% (3.9 million US adults)Citation4, representing severe and consequential morbidity and mortality. Previous studies among patients with advanced cirrhosis, which is the primary cause of the majority of HRS cases, reveal a 1 year HRS incidence rate of 18% and a 5 year incidence of 39%, resulting in more than 700,000 cases annually due to CLDCitation5.
Hepatorenal syndrome is divided into type 1 or 2 based on severity of the conditionCitation6. Type 2 HRS is characterized by less severe renal impairment marked by diuretic-resistant ascites. Patients with Type 2 HRS have initial serum creatinine levels below 2.5 mg/dLCitation7, indicative of 50% kidney function. Type 2 HRS follows a gradual progression, is associated with the advancement of cirrhosis, and the median survival time of patients is ∼6 monthsCitation8,Citation9. Type 2 HRS may progress to Type 1 HRS, which is characterized by the inability to sustain adequate kidney perfusion and the rapid deterioration of acute kidney functionCitation9,Citation10. A rapid increase in serum creatinine (SCr) levels (>2.5 mg/dL in <2 weeks) and a glomerular filtration rate (GFR) below 20 mL/min are frequently observed in Type 1 patientsCitation7. The condition is associated with significant mortality, with a median survival rate of only 8–12 weeksCitation8, and a 25% survival probability after 30 daysCitation3,Citation11,Citation12.
Patients with HRS often demonstrate complex etiologies and typically receive other hepatic- and renal-centric diagnoses. Progression of disease is monitored using multiple biological markers, particularly markers of renal function, including SCr. Circulating SCr levels increase in proportion to levels of kidney impairmentCitation13. Another key assessment is the ratio of renin to aldosterone, two key regulators of the renin-angiotensin-aldosterone system, that are responsible for mediating the volume of extracellular fluid and blood pressureCitation14. Prognostic measures including Model for End-Stage Liver Disease (MELD) and Child-Pugh scoresCitation14 help determine disease severity and assign priority for transplantCitation15.
For some cases, treatment of the underlying cause of HRS may be sufficient for full recovery, but, when these treatments fail, liver transplant is the definitive cure. Pharmacotherapy and artificial hepatic support are used as bridging treatments until recovery, transplant, or death occurs. There are currently no FDA approved medications indicated specifically for HRS, but medications such as terlipressin have shown promising efficacy internationallyCitation12,Citation16,Citation17. In the US, albumin is frequently used to control HRS symptomsCitation18, and in cases where these treatments cannot be used or are ineffective, beta-blockers, rifaximin, and somatostatin are administeredCitation19. Hepatic support for HRS patients is typically expensive and includes dialysis, trans-jugular intrahepatic portosystemic shunt (TIPS), transfusion, and paracentesis. In many cases, critically-ill patients must be admitted to the intensive care unit (ICU), often requiring mechanical ventilation, at significant expenseCitation20.
A recent publication reported the substantial economic burden of HRS in the US using commercial claims and Medicare data, and identified notable differences in the mortality, transplant, and dialysis rates between Medicare populations and commercially-insured patientsCitation21. The current study sought to confirm and extend these analyses by examining the prevalence, outcomes, and costs associated with HRS in a large US hospital electronics health records (EHR) database, including patients from all potential payer types.
Methods
Study design and data source
We performed a retrospective, longitudinal study based on prospectively collected US hospital inpatient data from January 1, 2009–June 30, 2015, obtained from a large, HIPAA-compliant electronic health records database, (Cerner HealthFacts, Cerner Corp., Kansas City, MO). The database includes information from over 90 US healthcare systems representing over 69 million individual patients and 22 million inpatient stays (at the time of data extraction), including visit-specific procedures, laboratory results, and healthcare charges. Institutional Review Board (IRB) exemption for this study was granted by Western IRB (Olympia, WA).
Patients were adults (≥18 years old) with inpatient stays of at least 48 hours and an International Classification of Disease (ICD) code consistent with HRS (ICD-9 code 572.4). Recorded SCr measurements at admission and during the visit were required for inclusion in the study. Exclusion criteria included patients less than 18 years of age, incomplete encounter data, missing SCr values, a length of stay less than 48 hours, or no evidence of an inpatient admission. Patients with ICD-9 codes consistent with HRS were further evaluated to determine the primary reason for admission. Patients with a primary reason or diagnosis other than HRS were excluded. (Supplementary Table S1).
Patient characteristics were captured from electronic health records (EHRs), including basic demographics (age, gender, and race), etiology of liver disease, complications, and precipitants of HRS. Patients were also assessed for type of insurance, admission type, and discharge destination. Prognostic tests indicating severity of disease state (Child-Turcotte-Pugh [CTP]), organ failure (acute-on-chronic liver failure [ACLF]), Model for End-Stage Liver Disease [MELD]), kidney injury (Kidney Disease: Improving Global Outcomes–Acute Kidney Injury [KDIGO-AKI]), and ICU mortality estimates (Acute Physiology and Chronic Health Evaluation II [APACHE II], were also captured and evaluated. Captured hospital characteristics included teaching status and the number of beds.
Study outcomes
The total economic burden of HRS was assessed by examining administrative and clinical outcomes. Total length of stay (LOS) was calculated based on the index admission and subsequent discharge. Administrative outcomes included mortality during the index hospitalization, 30-day readmission rates, transplant-free survival, hospital LOS, ICU LOS, incidence of septic shock, and delivery of high-cost procedures. High-cost procedures were defined as those typically administered to HRS patients, and included transfusion of blood products, mechanical ventilation, dialysis, transjugular intrahepatic portosystemic shunt (TIPS), paracentesis, and combined kidney and liver transplant (CKLT). Clinical outcomes included SCr levels at the beginning and end of treatment to determine the percent change from time of admission to discharge. Data from prognostic tests were reviewed to determine the number of patients, severity of kidney and liver damage, and total ICU mortality index. Additionally, total medication type and usage was examined to gauge resource utilization.
Data analysis
Prior to the analysis, data was prepared by removing identical and duplicate entries, removal of visits with inconsistent admission and discharge time stamps, and removal of patients with missing age, race, and gender. All analyses were conducted utilizing SAS Version 9.4 (SAS Institute Inc. Cary, NC). Categorical variables were described by count and percentage of the total; continuous variables were described by median, mean, and standard deviation.
A generalized linear model (GLM) was employed to characterize the relationship between total visit charges and outcomes segmented by payer type. To be included in the GLM, patient records required complete information for demographics, administrative outcomes, clinical outcomes, institution teaching status, ICU admission, ALD status, dialysis status, discharge disposition, payer type, length of stay, and charges. Relevant characteristics and outcomes of patients with HRS were incorporated as effects, with total hospital charges as the response variable (log-transformed).
Results
This analysis identified 2,542 adult HRS patients meeting the inclusion criteria (). All included patients were used for assessments of incidence, but only the sub-set of patients with cost/charge data (i.e. 634 patients from facilities reporting cost/charge data) was used for calculation of charges. The age range of patients spanned 18–90 years of age. Most patients (45.4%) were between the ages of 51 and 64, with an average age of 57.9 and median age of 57.0. Patients were more likely to be male (61.8%) and 74.2% were Caucasian (). Overall, the mean length of stay was 30.5 days, while the median length of stay was 11.2 days. ICU stays in this population were common and averaged 9.81 days (median = 5.25 days). Most patients (30.2%) were on commercial insurance, followed closely by patients with Medicare (29.9%). With respect to all treatments and conditions, the average total charges were $91,504 US dollars (USD) per patient (median = $60,479).
Figure 1. Flow diagram depicting selection criteria for HRS study. A total of 2,542 patients meeting all inclusion criteria were identified from 6,118 with an ICD-9 code for HRS in the Cerner HealthFacts database.
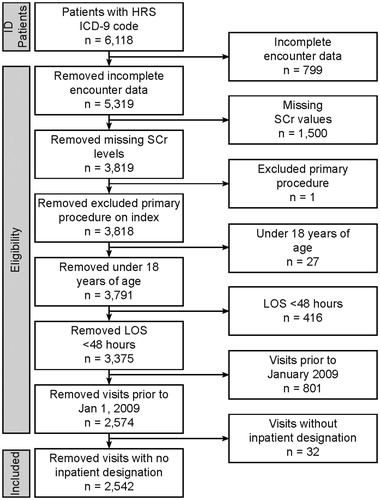
Table 1. Patient demographics.
Patient characteristics
To determine the relationship between patient characteristics and average charges related to HRS, patients were categorized by age, race, and gender. The age range of patients spanned 18–90 years of age. The youngest cohort of patients had the fewest total patients (n = 103, 4.1%), but the highest average charges ($123,555 [166,453]) among all age groups, especially in comparison to the oldest cohort (age > 65), who had the lowest average charges of ($86,547[88,222]). While charges by gender were similar, they skewed slightly higher for female patients ($93,000 [100,398]) compared to male. Average charges ranged from $75,641 [90,398] to $94,332 [61,753] by race, with African American patients having the lowest mean charges ($75,641 [90,398]) ().
Patient visit characteristics
In order to better understand the charges associated with HRS patients, visit characteristics, including admission, discharge disposition, and payer type were analyzed. Patients were primarily admitted with emergency status (44.5%), which had the lowest average charge of any admission type ($75,814 [80,393]) (). In contrast, urgent admissions had the highest average charge ($110,361 [120,759]). Significantly, over one-third of patients were discharged deceased (36.9%), underscoring the substantial mortality associated with HRS, and the mean charges associated with this sub-set of patients was high ($107,529 [121,381]) (, ).
Figure 2. Charges associated with patient mortality discharge status and payer type. (A) Charges for hospitalization by mortality during index visit. About one third (36.9%) of patients with HRS die during the index hospitalization, associated with greater average and median charges. (B) Charges associated with discharge destination. The line bifurcating the gray boxes indicates median charge, while the upper and lower limits of the box indicate 75% and 25% median charges, respectively. Mean charges are indicated by an X, while the upper and lower limits (lines) indicate 75% and 25% of mean charges, respectively. Although only 12% of patients were transferred to a skilled nursing facility, this was associated with the highest average and median charges, followed by death. (C) Charges associated with payer type. Thirty percent of patients with HRS are covered by Medicare, and account for the second least average and median charges after “other”. Patients who self-pay for their insurance had the highest average charges, whereas those covered by Medicaid had the highest median charges.
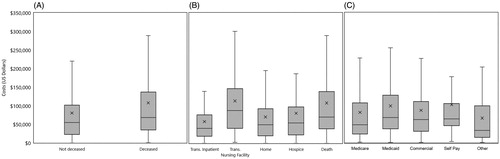
Table 2. Patient visit and hospital characteristics.
Patient etiology, complications, and precipitants were also analyzed to understand the charges incurred by HRS patients based on their prior clinical history (). Using only pre-admission information, the etiology was largely unknown (80%), but using additional post-admission timepoints, this uncertainty drops to 18% (Supplementary Table S2). Overall, the majority of patients did not show signs of other complications and had a mean charge of $91,890 [104,541] (). Paracentesis was the most common precipitant (39%), and the mean charge associated with their treatment was $93,781 [83,048] ().
Table 3. Pre-existing conditions, precipitants, and etiology.
Short-term mortality indicators and cost: APACHE II, KDIGO-AKI, MELD, CTP and CLIF-SOFA
To understand the relationship between patient prognosis and average total charges, previously established prognostic indicators for mortality were assessed. All patients included in the study had APACHE II scores, used to provide an overall mortality prediction. The 88 patients who received an APACHE II score >30 had the highest average charge, of $184,448 [103,201]. Surprisingly, the lowest charges ($71,932 [39,215]) were associated with the second worst prognosis (APACHE II scores of 25–29) (), while patients with the lowest APACHE II scores (a score of 5–9) had the second highest charges overall ($134,835 [148,434]).
Table 4. Short-term mortality indicators.
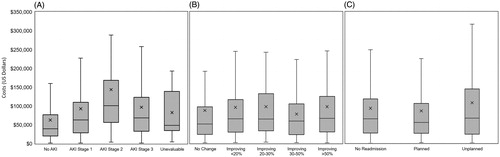
Sixty-seven percent (67.4%) of all patients were assessed for acute kidney injury using KDIGO-AKI staging, (n = 2,488). Of these, 33.8% were assessed as stage 3, indicating a 3-fold increase of serum creatinine from baseline, consistent with acute progression to kidney failure requiring renal replacement therapy (, ). Of these patients, two-thirds (63.5%) received dialysis (223 of 351), and these patients were associated with $96,606 [$68,976] in average charges. Surprisingly, similar to the result observed with the lowest APACHE II scores, patients classified as stage 2 (n = 295) had significantly higher average charges ($143,620 [$147,391]) than any other classification.
Figure 3. Charges associated with KDIGO-AKI stage and improvement of renal function and readmission type. The line bifurcating the gray box indicates median charge, while the upper and lower limits of the gray boxes indicate 75% and 25% median charges, respectively. Mean charges are indicated by an X, while the upper and lower limits (lines) indicate 75% and 25% of mean charges, respectively. (A) Charges associated with various stages of kidney injury with higher average and median charges increasing through Stage 2 followed by a drop in both mean and median charges in Stage 3. No AKI is associated with the lowest average and median charges. (B) Charges associated with improvement of renal function. Subjects with no change in renal function had the lowest median charge, while those with an improving 30–50% showed the lowest average charge. The highest average and median charge is associated with patients improving > 50%. (C) Charges associated with readmission type.
Patients (n = 2,394) were also assessed for chronic liver disease severity using the MELD system (). The majority of patients (51.8%) had a MELD score of 20–35, consistent with a 3-month mortality risk of 76–83%Citation22. Echoing results observed with both APACHE II scores and KDIGO-AKI stage, patients with MELD scores indicating the best prognosis had the highest average charges ($105,274 [125,863]), and the patients with the worst prognostic score had the lowest charges ($78,134 [96,495]). Of all patients included in the study, 78% (n = 1,981) were assessed for cirrhosis severity by CTP classification. The majority of patients (61.4%, n = 1,562) received the most severe CTP designation (class C), which has a 3 month mortality rate of around 40%Citation23. The mean and median charges for these (class C) patients was $103,763 and $70,042, respectively, indicating that the total cost of care for individual patients was quite variable.
Over one-third (36.1%) of patients were also assessed using the CLIF-SOFA scale and received an ACLF grade of 3, indicating poor prognosis/high 3-month mortality ratesCitation24,Citation25. In contrast to patients with the most severe APACHE II, KDIGO-AKI, MELD, and CTP scores, patients with ACLF 3 had the highest average charges ($112,191 [128,118]), while the lowest average charges were associated with patients receiving a Grade 1 assessment ($70,676 [78,206]) ().
Clinical outcomes of HRS treatment
To further understand the pattern of resource utilization among HRS patients, clinical outcomes, high cost procedures, medications, and improvement in renal function were assessed (). Among high cost procedures, the highest charges were associated with the 513 patients who underwent mechanical ventilation ($157,076 [141,513]). Surprisingly, patients receiving combined liver and kidney transplants had only the second highest average charges ($125,966, [185,574]). The most common procedure overall was paracentesis resulting from ascites, which produced the second lowest average charges ($93,781 [83,048]). The mean charges for medications for patients with HRS ranged between $73,577 [74,940] for those receiving rifaximin to $91,086 [94,119] for those receiving beta blockers ().
Table 5. Clinical outcomes of HRS patients.
HRS patients were also assessed for changes in renal function during the index visit by comparing SCr levels from admission throughout the visit. Improvement in renal function was observed in 75.7% of patients (, ). Of these patients, 24.5% (n = 624) had improvements greater than 50%. However, 544 patients (21.4%) had no change in renal function during their visit. Average charges among all patients varied only slightly based on total renal improvement. Patients with greater than 50% improvement in renal function had the highest average charges ($97,345 [112,575]), which may be consistent with better prognosis ().
Table 6. Administrative outcomes.
Administrative outcomes
The burden of illness associated with HRS was further evaluated by examining administrative data, including mortality, morbidity, readmissions, and length of stay. Mortality occurred among 36.9% of all patients during the index visit and was associated with significantly higher average and median charges ($107,529 [121,381]) than patients who survived the index visit (, ).
Of the patients with a known discharge disposition, 1,174 were assessed for readmission categorized by the Medicare planned readmission algorithmCitation26. Of these, 328 patients had either a planned or unplanned readmission related to HRS; 41.2% of readmissions were unplanned, resulting in significant average charges ($92,154 [110,671], , ). Patients admitted to the ICU had average charges of $101,758 [93,017].
The mean length of stay for HRS patients was 30.5 days, likely due to the 84 patients who had LOS over 180 days. The median length of stay was 11.24 days. The highest average charges were reported for LOS of 61–180 days ($218,389 [230,077]), while the lowest average charges were associated with LOS 2–5 days ($30,820 [23,831]) ().
Generalized linear regression modeling
To assess the drivers of the cost of HRS care, we generated a multivariable generalized linear regression model (GLM). The GLM required complete records for tested demographics, administrative outcomes, clinical outcomes, and charge data, reducing the patient pool to 466 patients of the original 2,542 (Supplementary Table S3). This sub-set of patients retained similar demographics and characteristics to the overall population. The majority of patients had Medicaid coverage (n = 267; 57.3%), and, similar to the overall patient population, the mortality rate in this population was 35.3% (n = 164).
Overall, the GLM demonstrated significant increases in cost associated with increased length of stay (13% increase per 1% LOS increase; p = 0.01), death (23% increase; p = 0.09), discharge to skilled nursing (52% vs home discharge; p = 0.002), and hemodialysis (74% vs without hemodialysis; p < 0.0001). Mortality was associated with a 23% increase in cost, but did not achieve statistical significance (p = 0.09).
When the relationship between charges and discharge status was examined by payer type, Medicare/Medicaid patients with in hospital mortality (56%, p = 0.01) and discharge to skilled nursing (78%, p = 0.001) had significantly increased charges vs discharge to home (Supplementary Table S4). Among commercially insured patients, the only statistically different discharge group was those patients transferred to an inpatient setting, with a decrease of −131% (p = 0.0002) (Supplementary Table S5).
Discussion
This analysis further confirms the economic burden of HRS using a US hospital database inclusive of all payer types. The high costs of HRS treatment are not surprising given that it is a diagnosis of exclusion: multiple procedures and medications could be attempted before reaching an HRS diagnosis, driving up the overall cost of treatment. In our analysis, significant cost drivers associated with HRS included mortality, length of stay, and dialysis administration.
In the total population, we observed a mortality rate of 36.9% during the index visit, which is consistent with a previously reported mortality rate of 36.4%Citation21. However, if patients who were discharged to hospice (8.9%) are considered, the observed mortality rate increases to 45.3%. This rate approaches the mortality rate observed in a separate analysis of claims data (52% for commercially insured; 70% for Medicare patients). The range in mortality across studies may also reflect different data sources (i.e. different populations, EHR data vs claims data, etc.), but all these studies reinforce the high mortality associated with HRS.
Our study found substantial healthcare resource utilization in terms of high cost procedures, dialysis administration, medications, length of stay, and ICU length of stay. When broken down by payer type, commercial payers were associated with an average total charge of $87,445 per patient, and Medicare was associated with an average total charge of $82,147 per patient. These numbers are directionally consistent with the recent claims data study of Rice et al., which reported that the mean 90-day healthcare cost for commercial insurance was $157,665 vs $48,322 for Medicare. Notably, these differences may result from differences in the data available in the datasets (i.e. claims vs total charges data) or each study’s analysis methods. Furthermore, it is also essential to acknowledge that the clinical treatment and associated economic burden of HRS varies broadly around the world. For example, an economic evaluation conducted in Brazil reported that the cost of treatment of HRS ranged from $7,500–15,000, whereas a 15-day treatment of HRS in India was reported to cost only $1,200Citation27,Citation28. Both of these studies contrast sharply to US-based studies, and these differences may result from differences in observed outcomes, such as the mortality rate reported by Singh et al., which was much higher than the US-based studies (56% at 15 days of treatment, 67% at 30 days of treatment).
We chose to report charge data in this analysis as we anticipated significant fluctuation in the hospital cost to charge ratio due to variation in the operational costs, location in rural or urban settings, and overhead costs. The datasets also differ in terms of the spectrum of payers captured, with our current study, including all patients, regardless of coverage status. Using these additional patients, we also observe that the Medicaid charges are higher than both Medicare and commercial types. Finally, the two studies differ in patient characteristics that may impact costs, including transplant rates. Whereas Rice et al.Citation21 reported transplant rates of 10.7% for their commercial population and 1.6% for the Medicare population, our study population, from all payer sources, had a 2.1% transplant rate overall. The high cost of transplants and vastly different rates of transplants may be key differences in the observed costs.
Previous studies have reported markers and assessments to estimate HRS resource utilization. However, drivers of total charges remain relatively unclearCitation21. We created a generalized linear model to extend our initial findings to include characteristics that are statistically significant with respect to total visit charges for all patients, including length of stay, teaching hospital status, patients on dialysis, mortality, transfer to skilled nursing facility, or inpatient setting (Supplementary Tables S3–S6). Notable differences between the Medicaid/Medicare and commercial populations included hospital and ICU LOS (driver for commercial) or patient discharge status.
This retrospective cohort study based on a hospital database has certain limitations that should be considered. The data used in this analysis cover an extensive, but inherently limited sample of US hospitals that may not be generalizable to the entire US hospital population or may not cover all HRS patients. For example, although the median age of patients in our analysis was 57 years old, only 2% of these patients are documented as having liver transplants, which may reflect a limited number of transplant centers contributing to the database. Like most retrospective EHR studies, the current study is also dependent on ICD-9 and other coding. There might be coding variability which could result in the potential missed reporting of certain conditions. For example, cases with ICD-9 coding for cirrhosis with acute kidney injury as a complication could be missedCitation29. Furthermore, there is no coding to differentiate Type 1 vs Type 2 HRS patients, but, because Type 2 HRS is less severe and patients are less likely to require hospitalization, it is assumed that the majority of the patients in our analysis are Type 1. In the descriptive analysis, patient records, particularly with respect to charge data, may be incomplete, and costs were determined using the available charge information. Additionally, readmission rates may be under-estimated if patients returned to a hospital that did not contribute to the dataset. Finally, the regression analysis required complete hospitalization data, which restricted the analysis to a sub-set of the initial patient population. However, similarities between the sub-population and the broader population suggest this sub-set is representative.
Conclusions
Our analysis confirms that patients hospitalized due to HRS in the US are resource intensive, costly, and associated with high mortality. Clinically there is significant unmet need, as 44% of HRS patients had SCr improvement <20% during the hospital stay, and hemodialysis was identified as a primary cost driver (in addition to LOS and hospital mortality). This study and similar studies suggest that efficacious, cost-effective treatments for HRS are needed to improve patient outcomes.
Transparency
Declaration of funding
This study was funded by Mallinckrodt Pharmaceuticals, Inc., Bedminster, NJ.
Declaration of financial/other relationships
KJ, XH, BL, AP, and GW have disclosed that they are current employees (KJ, XH, and GW) or former employees (BL and AP) of Mallinckrodt Pharmaceuticals, which provided research funding to Boston Strategic Partners, Inc. (BSP) for initial analysis and manuscript drafts. JME peer reviewers on this manuscript have no relevant financial or other relationships to disclose.
Supplemental Material Tables 1-6
Download MS Word (52.4 KB)Acknowledgements
We thank Drs Jeffrey R. Skaar, Corey D. Snelson, and Hussain Badani at Boston Strategic Partners (supported by Mallinckrodt Pharmaceuticals, Inc.) for providing initial analysis and drafting of this manuscript. This data has been previously presented at ISPOR 2017, AASLD 2017, and ASN 2017.
Data availability statement
The minimal data set underlying the findings in our study data is reported within this manuscript. Data is available from Cerner Corp (www.cerner.com).
Related Research Data
References
- Russ KB, Stevens TM, Singal AK. Acute kidney injury in patients with cirrhosis. J Clin Transl Hepatol. 2015;3:195–204.
- Testino G, Burra P, Bonino F, et al. Acute alcoholic hepatitis, end stage alcoholic liver disease and liver transplantation: an Italian position statement. WJG. 2014;20:14642–51.
- Allegretti AS, Ortiz G, Wenger J, et al. Prognosis of acute kidney injury and hepatorenal syndrome in patients with cirrhosis: a prospective cohort study. Int J Nephrol. 2015;2015: 108139.
- US Department of Health and Human Services CfDCaP, National Center for Health Statistics. Summary Health Statistics: National Health Survey, 2015. National Center for Health Statistics: Centers for Disease Control and Prevention; 2015.
- Gines A, Escorsell A, Gines P, et al. Incidence, predictive factors, and prognosis of the hepatorenal syndrome in cirrhosis with ascites. Gastroenterology. 1993; 105:229–236.
- Arroyo V. New treatments for hepatorenal syndrome. Liver Transpl. 2000;6:287–289.
- Angeli P, Gines P, Wong F, et al. Diagnosis and management of acute kidney injury in patients with cirrhosis: revised consensus recommendations of the International Club of Ascites. J Hepatol. 2015;62:968–974.
- Ng CK, Chan MH, Tai MH, et al. Hepatorenal syndrome. Clin Biochem Rev. 2007;28:11–17.
- Wadei HM, Mai ML, Ahsan N, et al. Hepatorenal syndrome: pathophysiology and management. Clin J Am Soc Nephrol. 2006;1:1066–1079.
- Lenz K. Hepatorenal syndrome-is it central hypovolemia, a cardiac disease, or part of gradually developing multiorgan dysfunction? Hepatology. 2005;42:263–265.
- Arroyo V, Guevara M, Gines P. Hepatorenal syndrome in cirrhosis: pathogenesis and treatment. Gastroenterology. 2002;122:1658–1676.
- Heidemann J, Bartels C, Berssenbrugge C, et al. Hepatorenal syndrome: outcome of response to therapy and predictors of survival. Gastroenterol Res Pract. 2015;2015:457613
- Prowle JR, Kolic I, Purdell-Lewis J, et al. Serum creatinine changes associated with critical illness and detection of persistent renal dysfunction after AKI. Clin J Am Soc Nephrol. 2014;9:1015–1023.
- Arroyo V, Gines P, Gerbes AL, et al. Definition and diagnostic criteria of refractory ascites and hepatorenal syndrome in cirrhosis. International Ascites Club. Hepatology. 1996;23:164–176.
- Cholongitas E, Burroughs AK. The evolution in the prioritization for liver transplantation. Ann Gastroenterol. 2012;25:6–13.
- Cavallin M, Fasolato S, Marenco S, et al. The treatment of hepatorenal syndrome. Dig Dis. 2015;33:548–554.
- Wong F. The evolving concept of acute kidney injury in patients with cirrhosis. Nat Rev Gastroenterol Hepatol. 2015;12:711–719.
- Caraceni P, Tufoni M, Bonavita ME. Clinical use of albumin. Blood Transfus. 2013;11(Suppl 4):s18–s25.
- Runyon BA. Hepatorenal syndrome. UpToDate 2018 Feb 13, 2018 [cited 2018 Jun 11]; Available from: https://www.uptodate.com/contents/hepatorenal-syndrome
- Wadei HM, Gonwa TA. Hepatorenal syndrome in the intensive care unit. J Intensive Care Med. 2013;28:79–92.
- Rice JB, White AG, Galebach P, et al. The burden of hepatorenal syndrome among commercially insured and Medicare patients in the United States. Curr Med Res Opin. 2017;33:1473–1480.
- Al Sibae MR, Cappell MS. Accuracy of MELD scores in predicting mortality in decompensated cirrhosis from variceal bleeding, hepatorenal syndrome, alcoholic hepatitis, or acute liver failure as well as mortality after non-transplant surgery or TIPS. Dig Dis Sci. 2011;56:977–987.
- Wiesner R, Edwards E, Freeman R, et al. Model for end-stage liver disease (MELD) and allocation of donor livers. Gastroenterology. 2003;124:91–96.
- Kumar R, Krishnamoorthy TL, Tan HK, et al. Change in model for end-stage liver disease score at two weeks, as an indicator of mortality or liver transplantation at 60 days in acute-on-chronic liver failure. Gastroenterol Rep (Oxf). 2015;3:122–127.
- Hernaez R, Sola E, Moreau R, et al. Acute-on-chronic liver failure: an update. Gut. 2017;66:541–553.
- Horwitz LI, Grady JN, Cohen DB, et al. Development and validation of an algorithm to identify planned readmissions from claims data. J Hosp Med. 2015;10:670–677.
- Singh V, Ghosh S, Singh B, et al. Noradrenaline vs. terlipressin in the treatment of hepatorenal syndrome: a randomized study. J Hepatol. 2012;56:1293–1298.
- Mattos AZ, Mattos AA, Ribeiro RA. Terlipressin versus noradrenaline in the treatment of hepatorenal syndrome: systematic review with meta-analysis and full economic evaluation. Eur J Gastroenterol Hepatol. 2016;28:345–351.
- Suneja M, Tang F, Cavanaugh JE, et al. Population based trends in the incidence of hospital admission for the diagnosis of hepatorenal syndrome: 1998–2011. Int J Nephrol. 2016;2016:1.