
Abstract
Objectives: To determine how overall cost of anticoagulation therapy for warfarin compares with that of Novel Oral Anticoagulants (NOACs). Also, to demonstrate a scientific, comprehensive, and an analytical approach to estimate direct costs involved in monitoring and management of anticoagulation therapy for outpatients in an academic primary care clinic setting, post-initiation of therapy.
Methods: A population-based cross-sectional study was conducted in conjunction with observations of patient care processes between August 2014 and January 2015. The study was conducted in an academic primary care outpatient setting at Mayo Clinic’s warfarin anticoagulation clinic, Rochester, MN. The anticoagulation clinic serves patients 18 years of age or older in Warfarin therapy management, for any indication, after referral from the patient’s primary care provider. The study included anticoagulation clinic enrollment data on a population of 5,526 patients. Time-Driven Activity-Based Costing (TDABC) technique was applied. Detailed process flow maps which showed process steps for all the anticoagulation program components and care continuum phases were created. Staff roles associated with each of the process steps were identified and displayed on the maps. Process times and costs were captured and analyzed. The main outcome was direct cost of monitoring and management of anticoagulation therapy, post-initiation of therapy.
Results: The cost of warfarin management for patients who display unstable International Normalized Ratio (INR) is more than three times those who display stable INR over time. (Comparator to distinguish stability: Frequency of point-of-care visits needed by patients.) For complex anticoagulation patients, total cost of medication and monitoring for warfarin anticoagulation therapy is similar to that for NOACs.
Conclusion: Despite warfarin being significantly less expensive to purchase than NOACs, overall warfarin management incurs higher costs due to laboratory monitoring and provider time than NOACs. NOAC treatment, therefore, may not be more expensive than warfarin therapy management for complex anticoagulation patients.
Introduction
Importance
Warfarin has been the dominant oral anticoagulant since its development and clinical use began in the early 1950s. Although intravenous or subcutaneous heparin has been available as an alternative, for all practical purposes warfarin has been the only choice for patients requiring long-term oral anticoagulation. Despite its effectiveness as an antithrombotic agent, factors affecting pharmacokinetic and pharmacodynamic properties of warfarin have been well known and have necessitated stringent methods to make its use safe. Although warfarin remains the standard drug therapy for outpatient oral anticoagulation, it requires significant effort on the part of patients and healthcare providers to safely prescribe and monitor. Anticoagulation treatment involves additional costs beyond the cost of medications, such as laboratory studies and healthcare provider work. The introduction of a new set of oral anticoagulants began in 2010. Instead of reducing clotting factor production (like warfarin) or binding to antithrombin III to induce anticoagulation (like heparin and heparin derivatives), these new oral anticoagulants directly bind to clotting factors such as IIa (thrombin) or Xa. This mechanism was novel for an oral anticoagulant and even for most parenteral anticoagulantsCitation1. These novel oral anticoagulants (NOACs) continued to be approved and introduced to the US market over the next 5 years. NOACs offer significant clinical advantages over traditional warfarin therapy, but the higher unit cost of NOACs relative to warfarin has limited their use.
Warfarin anticoagulation therapy
The skill and effort involved in monitoring warfarin has spawned the creation of specialized anticoagulation services in order to apply consistent quality control methods and to maximize safe management. With these specialized services, controlling the anticoagulant effect of warfarin to the desired intensity of therapy (known as the Time in Therapeutic Range or TTR) is typically achieved to a level of ∼60%Citation2. This Herculean effort of managing warfarin therapy comes at a cost to both the patient and the healthcare systemCitation3. Dedicated anticoagulation clinics have been shown to be more cost-effective than routine physician provided careCitation4,Citation5. The Mayo Clinic in Rochester, MN, has operated a dedicated anticoagulation service for monitoring warfarin anticoagulation since September 2010. There was a standardized protocol with decentralized nurses in August 2003, followed by centralized nurses starting in February 2010, and the addition of the pharmacist as a provider via collaborative practice agreement (CPA) with primary care providers in September 2010. This clinic, staffed by full time Pharmacists and Registered Nurses (RNs) manages ∼ 2,000 patients who are prescribed warfarin primarily for atrial fibrillation, venous thromboembolism (VTE), or prosthetic cardiac valves. Employing a nurse protocol with pharmacist clinical support using CPAs for both warfarin dose adjustment and the timing interval of testing, we have achieved a TTR of 86–88% for INR1* goal 2–3 & 80–84% for INR goal 2.5–3.5, well above the accepted standard.
Novel oral anticoagulant (NOAC) therapy
Novel oral anticoagulants (NOACs) offer significant advantages over warfarin therapy because of their rapid onset of action, with a predictable anticoagulant effect, allowing fixed-dose administration with no requirement for routine coagulation monitoringCitation6,Citation7. Estimating the expense of warfarin administration and monitoring thus becomes an important variable in clinical decision-making. Although there have been some attempts to estimate the cost-effectiveness of the newer NOACs compared with warfarinCitation8,Citation9, these comparisons are based on estimates of warfarin monitoring. Also, the observed costs of warfarin monitoring will necessarily depend on the systems utilized in a specific clinical setting. Thus, the actual trade-off of costs with NOACs (primarily drug acquisition) and warfarin (primarily monitoring) remain poorly understood.
Time-driven activity-based costing (TDABC)
This is an accurate costing approach for calculating the total cost of treating patients for specific medical conditionsCitation10,Citation11. The total cost includes costs related to medications, personnel, equipment, and laboratory tests. TDABC starts by documenting the actual clinical and administrative activities performed during an entire cycle of care. The map identifies which personnel and equipment resources are used at each activity and the number of minutes used of each resource for the activity. Hospital finance staff participate by estimating the per-minute costs for each resource. A nurse’s cost-per-minute, for example, is calculated by dividing total annual compensation by the total number of minutes per year (typically between 90,000 and 100,000) the nurse is available for clinical care. Total personnel costs are obtained by multiplying total minutes used of each resource by each of their per-minute costs, and then summing across all resources used during the care cycle. Then the cost of all of the supplies, drugs, and tests are added. The TDABC costs provide an accurate and transparent picture of all the expenses associated with ongoing care of patients over a defined period of time. We applied TDABC to our anticoagulation clinic in an effort to precisely determine costs in a setting known to achieve optimal clinical performance. Although annual anticoagulation costs are connected with healthcare costs of complications such as bleeding and clots resulting from different anticoagulation therapies, the scope of the study focused on direct costs, and it did not take into consideration differences in efficacy and possible complications between warfarin and NOACs.
Objectives
To determine how the overall cost of anticoagulation therapy for warfarin compares with that of novel oral anticoagulants (NOACs).
To demonstrate a scientific, comprehensive, and analytical approach to estimate direct costs involved in monitoring and management of anticoagulation therapy for outpatients in the academic primary care clinic setting, post-initiation of therapy.
Materials and methods
Design
A population-based cross-sectional study was conducted in conjunction with observations of patient care processes. Quantitative data on process parameters such as process times, staff roles, and financial parameters was collected and analyzed between August 2014 and January 2015. In addition, frequency of patient care visits was based on historical patient enrollment data. Final review of the cost model was completed on February 5, 2015.
Setting
The study was conducted in an academic primary care outpatient setting at Mayo Clinic’s warfarin anticoagulation clinic, Rochester, MN.
Participants
The anticoagulation clinic serves patients 18 years of age or older in Warfarin therapy management, for any indication, after referral from the patient’s primary care provider.
Methods
Measurements and data analysis were conducted in order to estimate the annual cost of warfarin management per patient for patients managed:
Via face-to-face clinic visits using point of care testing, and
Via venipuncture followed by telephone consult.
Detailed current state maps showing process steps for all the program components and time-phases were created. Various staff roles associated with each of the process steps were identified and displayed on the maps. The time required for the process steps was captured through a proprietary internal database used by nurses (Workload Management Reporting System). Manual time-study was also conducted to validate the timings. Patients in the different time phases of their care were identified by the enrollment data from the Mayo Scheduling System (MSS). Thereafter, the above data was analyzed. Based upon this data the costs associated with the process steps were identified with the help of a financial analyst.
The current state maps consisted of the following program components:
Within first 30 days of therapy (point of care),
2nd through 3rd month and 4th through 12th month of therapy (point of care),
Registered nurse’s phone consult with patient,
Fax process and Patient Education,
Home INR, and
Pharmacist (point of care).
and Citation2 illustrate process flow maps for warfarin anticoagulation treatment:
Figure 1. A process flow map for a new patient within the first 30 days of enrollment into the warfarin program (point of care visit). Numbers included in circles are minutes that each provider was involved performing that step by various providers; process steps with vacant circles have their process minutes combined with adjacent process steps as noted next to them; see staff key in figure. Amalga, Mayo Clinic’s internal database for aggregation of patients’ clinical data; DOB, Date of Birth; Edu., Education; EOP, Enterprise Order Prescribing (Mayo Clinic’s internal system); Info, information; MC, Mayo Clinic; MC#, Mayo Clinic Number; MD, Doctor of Medicine; NP/PA, Nurse Practitioner/Physician Assistant; NV, Nurse Visit; PCIL, Patient Check-In Locator (Mayo Clinic’s internal system); PDC, Provider Directed Care; Pt., Patient; RN, Registered Nurse; Std. Dev., Standard Deviation; WMRS, Workload Management Reporting System (Mayo Clinic’s internal database used by nurses).
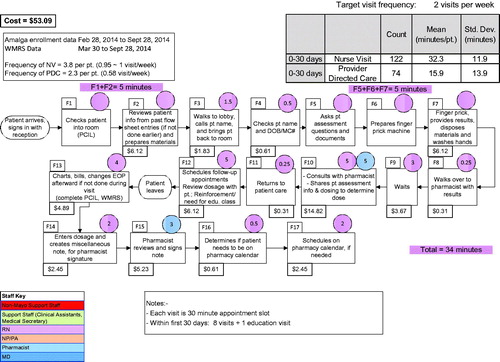
depicts a process flow map for a new patient within the first 30 days of enrollment into the warfarin program (point of care visit); and
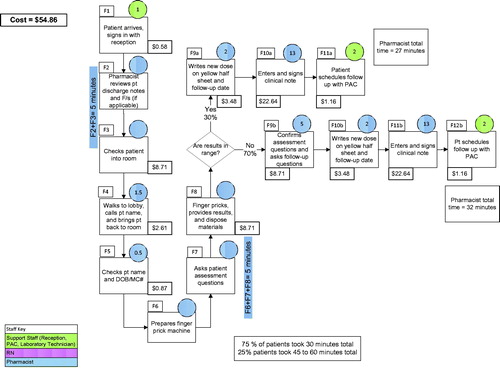
depicts a process flow map for a patient visit with the pharmacist (point of care visit) in the warfarin program.
Figure 2. A process flow map for a patient visit with the pharmacist (point of care visit) in the warfarin program. Numbers included in circles are minutes that each provider was involved performing that step by various providers; process steps with vacant circles have their process minutes combined with adjacent process steps as noted next to them; see staff key in figure; DOB, Date of Birth; F/s, Flowsheets (Mayo Clinic electronic documentation); MC, Mayo Clinic; MC#, Mayo Clinic Number; PAC, Patient Appointment Coordinator; Pt., Patient; RN, Registered Nurse.
In order to estimate annual program cost, the patient care continuum was divided into three time phases. The care provided to the patient was:
Within the first month of his/her enrollment into an anticoagulation program;
During the second and third month of his/her enrollment into the program; and
From the fourth to the twelfth month of his/her enrollment into the program.
The program cost incurred in the above three time phases was summed to arrive at annual program cost.
The frequency of patient care consults (visit/week) for the three time phases in the care continuum for the three categories of patient2* (Stable, Middle of the road or average, and Unstable) are incorporated in the calculation of Annual Warfarin Anticoagulation Process Cost, as depicted in .
Table 1. Matrix for calculation of annual warfarin outpatient anticoagulation process cost.
Patients who required one patient care visit/month were considered “stable patients”,
Patients who required one-to-three patient care visits/month were considered “average patients”, and
Patients who required three or more patient care visits/month were considered “unstable patients”.
In addition to the process cost, medication (warfarin, NOAC, and low molecular weight heparin) costs and also laboratory test costs to the Mayo Clinic were identified and incorporated into the Program Cost Matrix. Medication costs were calculated using Wholesale Acquisition Cost (WAC) per day of therapy as of year 2014. compares the Estimated Annual Anticoagulation Program Cost associated with use of NOACs to that with the traditional warfarin program. The warfarin program cost is distinct for the three patient categories of “Stable”, “Unstable”, and “Average”.
Table 2. Comparison of estimated annual outpatient anticoagulation program cost between NOACs and warfarin.
Results
The analysis revealed the cost of the warfarin management for patients who display unstable INR is more than three times those who display stable INR over time. In the case of unstable patients, the analysis revealed that the cost of warfarin therapy is comparable to that of NOACs, as depicted in .
The estimated annual anticoagulation program cost for patients on warfarin who are managed in a clinic based point of care system:
Stable Patient (∼48% of population) = $960;
Average Patient (∼33% of population) = $1,458; and
Unstable Patient (∼19% of population) = $3,145.
graphically displays the frequency distribution of patient care visits per month for a patient population of 5,526 on warfarin anticoagulation treatment over a time period of October–December 2014.
Figure 3. The frequency distribution of patient care visits per month for a patient population of 5,526 on warfarin anticoagulation treatment over the time period of October–December 2014.
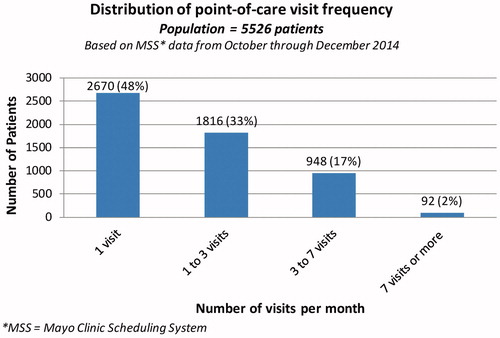
Athough the anticoagulation clinic manages ∼2,000 patients on an average at any given time, the percentages of the categories of patients were based on the data for patient enrollment in the program, and the frequency of patient care visits retrieved from Mayo Scheduling System (MSS). This amounted to a patient population of 5,526. It must be noted that anticoagulation patients go on and off warfarin during the course of their treatments, hence the difference between anticoagulation patient population and the number of patients managed by the anticoagulation clinic at a given point of time.
The estimated annual cost for patients who may be prescribed NOACs = $3,154. Thus, warfarin, the most widely used oral anticoagulant, is relatively less expensive in a certain category of patients, mostly those who exhibit stable INR values over time. However, the total cost of warfarin treatment is significantly higher in those patients whose INR values are unstable, such as patients with poor medication adherence or comorbidities that impact warfarin kinetics.
There is additional cost and burden to both the healthcare system and the patient with warfarin therapy. Warfarin requires regular blood monitoring and dose adjustment which are not needed with NOACs. Also, NOACs have a rapid onset and offset of action and fewer food and drug interactions.
In addition to being able to quantify differences in total costs between warfarin and NOAC treatments, the TDABC study revealed process improvement opportunities. For example, pharmacist involvement is required for phone consultations with complex patients. The RN making the call must either wait for the pharmacist to be available or send an inbox message to the pharmacist. After receiving the pharmacist’s recommendation, the RN has to attempt to reach the patient, a process that often requires multiple phone contacts. The team considered two possible options:
Relocate the pharmacist to the same room as the phone RNs; or
Transfer the phone connection to the pharmacist when the patient has been reached by phone.
For either option to work there will be a need to ensure the availability of the pharmacist at short notice, which will require a study of the current capacity/demand equation for the pharmacist’s role. Implementing either option (a) or (b) would streamline the process by reducing the number of hand-offs between phone RN and pharmacist, and the number of attempts required to contact the patient.
Discussion
Because of the introduction of NOAC agents, which do not require monitoring and whose anticoagulant effect is consistent in patients with stable renal function, simpler (and potentially safer) alternatives to warfarin now existCitation12. As these medications are new to the market, they have high acquisition costs. However, they offer savings of considerable expense involved in monitoring and managing warfarin anticoagulation, especially in the case of patients who display unstable INR, in addition to minimizing burden to patients and caregivers. Thus, they may offer a compelling financial alternative to the healthcare system, in addition to being clinically efficacious. Although annual anticoagulation costs are connected with healthcare costs of complications such as bleeding and clots resulting from different anticoagulation therapies, the scope of the study focused on direct costs, and it did not take into consideration differences in efficacy and possible complications between warfarin and NOACs. Assessment of the costs that arise from complications may form an important subject for future research.
Limitations of the study
Although the study did not include patients on treatment with NOACs, their medication cost was included based on their Wholesale Acquisition Cost (WAC) per day of therapy. The scope of the study did not include indirect costs of control of anticoagulation such as costs arising from possible complications (such as bleeds or clot rates). Also, it is important to note that the study is not a randomized clinical trial, since it is based on a cross-sectional study of a community patient population.
Conclusion
In an anticoagulation clinic in a major academic medical center, we determined that, for complex patients, the true overall cost of NOACs is similar to warfarin. The total overall costs need be taken into account in determining the most appropriate therapy.
Transparency
Declaration of funding
This manuscript received no funding.
Declaration of financial/other interests
The authors and JME peer reviewers on this manuscript have no relevant financial or other relationships to disclose.
Acknowledgements
Susan K. Graff, financial analyst at Mayo Clinic, provided financial costs of the staff resources involved in clinical processes. Linda M. Meyer, Nurse Manager at the outpatient primary care anticoagulation clinic, provided a nursing perspective and contributed information about the nursing process and patient flows. James Dilling was one of the leadership members who provided direction and support as an Associate Administrator for Quality and Value, Mayo Clinic. James was involved in the planning and strategy development for this study.
Notes
1* INR stands for International Normalized Ratio, which is a system established by the World Health Organization (WHO) and the International Committee on Thrombosis and Hemostasis for reporting the results of blood coagulation (clotting) tests.
2* The categories of patients were based on the frequency of care visits that were required in the third time phase, in order to successfully monitor patients’ warfarin therapy and dosage.
References
- Kane S. NOAC, DOAC, or TSOAC: What should we call novel oral anticoagulants? Pharmacy Times 2016 Sept. 19. Retrieved from: https://www.pharmacytimes.com/contributor/sean-kane-pharmd/2016/09/noac-doac-or-tsoac-what-should-we-call-novel-oral-anticoagulants
- Wells G, Coyle D, Cameron C, Steiner S, Coyle K, Kelly S, Tang A, Healey J, Hsieh S, Van Berkom J. Safety, effectiveness, and cost-effectiveness of new oral anticoagulants compared with warfarin in preventing stroke and other cardiovascular events in patients with atrial fibrillation. [Internet]. Ottawa (ON): Canadian Agency for Drugs and Technologies in Health, Apr 9, 2012. Retrieved from: https://www.ncbi.nlm.nih.gov/books/NBK169793
- Jonas DE, Bryant Shilliday B, Laundon WR, et al. Patient time requirements for anticoagulation therapy with warfarin. Med Decis Making. 2010;30:206–216.
- Aziz F, Corder M, Wolffe J, et al. Anticoagulation monitoring by an anticoagulation service is more cost-effective than routine physician care. J Vasc Surg. 2011;54:1404–1407.
- Sullivan PW, Arant TW, Ellis SL, et al. The cost effectiveness of anticoagulation management services for patients with atrial fibrillation and at high risk of stroke in the US. PharmacoEconomics. 2006;24:1021–1033.
- Bauersachs R. Managing venous thromboembolism with novel oral anticoagulants in the elderly and other high-risk patient groups. Eur J Int Med. 2014;25:600–606.
- Scaglione F. New oral anticoagulants: comparative pharmacology with vitamin K antagonists. Clin Pharmacokinet. 2013;52:69–82.
- Singh SM, Wijeysundera HC. Cost-effectiveness of novel oral anticoagulants for stroke prevention in non-valvular atrial fibrillation. Curr Cardiol Rep. 2015; 17:61.
- Amin A, Stokes M, Makenbaeva D, et al. Estimated medical cost reductions associated with use of novel oral anticoagulants vs warfarin in a real-world non-valvular atrial fibrillation patient population. J Med Econ. 2014;17:771–781.
- Kaplan RS, Porter ME. How to solve the cost crisis in health care. Harvard Business Review. Sept. 2011. Retrieved from: https://ie.technion.ac.il/∼serveng/course2004/Lectures/Kaplan_Porter_2011-9_How-to-Solve-the-Cost-Crisis-in-Health-Care_HBR.pdf
- Kaplan RS. Improving value with TDABC. Health Care Financial Manage. 2014;68:76–83.
- Yao X, Abraham NS, Sangaralingham LR, Bellolio MF, McBane RD, Shah ND, Noseworthy PA. Effectiveness and safety of dabigatran, rivaroxaban, and apixaban versus warfarin in nonvalvular atrial fibrillation. J Am Heart Assoc. 2016;5:e003725.