
Abstract
Objective: To estimate the cost-effectiveness of utidelone plus capecitabine therapy compared to capecitabine alone in patients with metastatic breast cancer (MBC) resistant to anthracyclines and taxanes treatment in the Chinese context and provide a reference for the marketing of utidelone in China.
Methods: A Markov model was developed based on the NCT02253459 clinical trial to simulate the clinical course of patients with metastatic breast cancer who had received taxanes and anthracycline therapy. The quality-adjusted life years (QALYs) and Incremental Cost Effectiveness Ratio (ICER) were then analyzed to evaluate the benefits. Two-parametric Weibull distribution was conducted to fit PFS and OS curves by using R. Sensitivity analyses were performed to evaluate the stability of the model designed.
Results: The addition of utidelone increased the cost and QALYs by $13,370.25 and 0.1961, respectively, resulting in an increased ICER of $68,180.78 per QALY. The most sensitive influential parameter on ICER was the price of utidelone. At the threshold of willingness-to-pay (WTP) of $24,380 (3 per capita GDP of China), the cost of utidelone per 30 mg of less than $18.5, $33.7, and greater than $48.8 resulted in a 100%, 50%, and 0% possibility of cost-effectiveness, respectively. The addition of utidelone was not cost-effective when it was $115.4 per 30 mg—the price of its analog paclitaxel. In consideration of varied economics levels across China, cost-effectiveness could be achieved with the price of utidelone ranging from $5.2 to $35.9.
Limitations: The survival curves extended beyond the follow-up time horizon, of which data were generated not from the real analyses but from our established two-parameter Weibull survival model.
Conclusion: It is recommended that the price of utidelone would be less than $18.5 per 30 mg in order to obtain cost-effectiveness for metastatic breast cancer patients resistant to anthracyclines and taxanes treatment in China.
Introduction
Breast cancer is one of the most common cancers, and the leading causes of cancer-related death in females. There are ∼27,000,000 newly-diagnosed breast cancer patients in China every year, and ∼70,000 breast cancer-associated deaths, with a median age of 45 ∼ 55 yearsCitation1,Citation2. Three-to-eight percent of patients are diagnosed with advanced stages at first visit, while the early cases have over a one-third possibility of recurrence after standard treatments. The 5-year survival rate of relapsed and metastatic breast cancer is 20%Citation3,Citation4.
Capecitabine is the normative treatment for patients with metastatic breast cancer (MBC) who fail single anthracycline or taxanes treatment, or combination treatment of these twoCitation5,Citation6. Ixabepilone, a semi-synthetic analog of epothilone, is the only microtubule-stabilizing anti-cancer drug officially approved by the US Food and Drug Administration to treat MBC patients who fail single anthracycline or taxanes treatment, or the combination with or without capecitabine. However, given its severe toxicity, Ixabepilone is not approved in China yetCitation7.
Utidelone, an analog of epothilone, is studied in phase I, II, and III clinical trials led by Professor Xu Binghe, where it is used as a third-line treatment for MBC patients after they failed anthracycline and taxanes treatment. This multi-center study (phase III trial NCT02253459) reveals that utidelone and capecitabine combination therapy, compared to capecitabine alone, significantly prolonged the progression-free survival (PFS) in Chinese patients, which is published in the journal Lancet OncologyCitation7. However, as utidelone is still under clinical trial, there is no report about economic research on this medicine.
Our study aims to investigate the long-term cost-effectiveness of utidelone combination treatment in MBC patients who failed anthracycline and taxanes treatment under the Chinese healthcare system and provide information on the marketing of utidelone in China.
Materials and methods
Patients and regimens
The population analyzed in this study was derived from the randomized double-blind phase III clinical trial, NCT02253459, which compared the therapeutic efficacy and safety of utidelone plus capecitabine to capecitabine alone in MBC patients who failed with paclitaxel and anthracycline drugs. The trial was conducted with approval from the local ethics committee and locally governing institutional review board (IRB) committee in the participating centers, and written consent from the patients. As shown in the clinical trial data, 405 patients were randomly divided into two groups to receive the combination therapy (n = 270, utidelone 30 mg/m2/day IV d1–5 + capecitabine 1000 mg/m2 PO bid d1–14) or monotherapy (n = 135, capecitabine 1250 mg/m2 PO bid d1–14), respectively. The population characteristics and the baseline characteristics of the two groups were identical.
Patients received the treatment every 3 weeks until the disease progressed. Computed tomography (CT) or magnetic resonance imaging (MRI) examinations were applied for curative effect evaluation according to Response Evaluation Criteria in Solid Tumors Guidelines (version 1.1).
Economic model
According to Chinese Guidelines for Pharmacoeconomic Evaluations (Version 11), in cases where a drug is not listed, the price of an analog on the market can be used to estimate the cost of the drugCitation8. As utidelone is unapproved in ChinaCitation7, the price of paclitaxel, $115.4 per 30 mg was used as a substitution in the analysis, for the reason that it is an analog to utidelone and a typical example of the class. A Markov model was built by TreeAge Pro Suite 2011 (TreeAge Software Inc., Williamstown, MA), to simulate the tumor development process of patients. We analyzed costs, life-years (LYs), and quality-adjusted life-years (QALYs) in each group, then calculated the incremental cost-effectiveness ratios (ICERs). The database of China’s public health was integrated from the published literaturesCitation9–15.
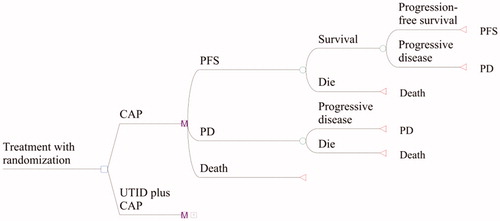
As shown in , the model structure included three states of MBC patients: progression-free survival (PFS), progressive disease (PD), and death. All patients started with progression-free survival with either utidelone and capecitabine treatment or capecitabine alone, and remained at this stage or transitioned to progressive disease or death. Once in the progressive stage, patients could remain in this stage or transition to death. Patients in the PFS state will experience treatment-related adverse events (AEs), or progressive disease treated with post-line therapy or resulting in death. All patients were evaluated for states before each Markov cycle (3 weeks) until all patients died. From the extrapolation analyses performed by the model, all patients were predicted to die within 5 years, thus our time horizon was 5 years.
Figure 1. State transition Markov model for patients with heavily-pretreated metastatic breast cancer refractory to anthracyclines and taxanes.
Based on the published data of Kaplan-Meier curves in the trialCitation7, discrete data of PFS and PD were obtained by using the GetData (version 2.24). For calculating the survival probability beyond the observation period, two-parameter Weibull distribution was performed which fitted PFS and OS curves, respectively, by using R (The R Project for Statistical Computing, version 2.15.2) and discrete data. We used Weibull distribution in our analysis as it is a flexible method used in substantial investigations on survival analysis for patientsCitation16–19. Additionally, on applying Weibull distributions, predicted survival curves from the model agreed well with the KM curves in the trial (), and the coefficients of determination in all groups were quite close to 1 (), which indicated that a suitable model was used. Time-dependent probabilities of transition at three states can be computed based on Weibull distribution of known fitting parametersCitation12. The extracted data was not converted to individual-level data as is was not required in our analysis.
Figure 2. Survival curves both in trial and from the model for utidelone plus capecitabine and capecitabine alone groups for heavily-pretreated metastatic breast cancer refractory to anthracyclines and taxanes. PFS, progression-free survival; PD, progressive disease.
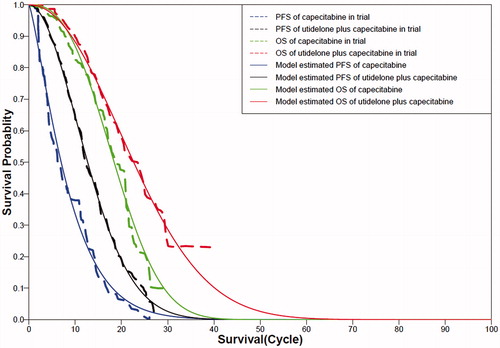
Table 1. Parameters of Weibull distribution estimated for progression-free survival and overall survival curves.
Resource cost data
In this research, we computed the direct medical costs, which mainly included the costs of medicine, administration, adverse events (), and follow-up, according to published papersCitation9–11.
Table 2. Baseline costs, utility values, and risks in two groups for patients with metastatic breast cancer in China.
The costs of follow-up included routine hematology laboratory tests conducted once a week during treatment, and routine biochemical laboratory tests performed once per cycleCitation7. Radiographic assessments of tumor responses were performed every two cycles for the first eight cycles, then every three cycles thereafter until disease progression or deathCitation7. The cost of palliative care was indirectly calculated based on the management of patients who experience disease progression in the clinical trial as well as the costs for the treatment. This was not listed in as the table only includes direct costs.
Three per capita GDP were used as willingness-to-pay (WTP) values, as this is a standard method recommended by World Health Organization’s criteria and China Guidelines for Pharmacoeconomic EvaluationsCitation8,Citation24. Although to use 3 per capita GDP as the cost-effectiveness threshold has been challenged by some recent arguments, this method remains the most well-established, widely-used, and standard one to set threshold in cost-effectiveness analysis to dateCitation25–27. GDP data were obtained from the national accounts in 2016, calculated at current prices of China Statistics PressCitation22. The exchange rate between RMB(¥) and USD($) in 2016, $1 = ¥6.6423, provided by the Chinese National Bureau of Statistics, was used in this studyCitation22. Purchasing Power Parity, which measures the relationship between the inflation rates of two countries, was not used, as we did not aim to assess the cost-effectiveness across countries.
Utility estimates
The TreeAge Pro was applied to obtain the life-years (LYs) in the Markov model. To assess QALYs, the survival time was adjusted by health-related quality-of-life. Utility scores ranged from 0.0–1.0, with 1.0 representing perfect health and 0.0 representing death. As different health states of breast cancer patients should be considered when estimating quality-of-life utility, the mean utility scores of PFS and PD patients in our study were 0.85 and 0.685, respectivelyCitation12,Citation13, listed in . As quality-of-life data was not collected in the trial, the utility scores were cited from published literature. With minor deviations, utility scores reported from multiple research were all around the same rangeCitation20,Citation21,Citation28–30.
Sensitivity analysis
One-way and multivariate probabilistic sensitivity analyses (PSA) were used to simulate the uncertainty of the input parameters during the actual treatment (). In one-way sensitivity analysis, ICER was generated with different values of each parameter. In probabilistic sensitivity analysis, 1,000 Monte Carlo repetitions were run by using a cost-effectiveness acceptable curve and scatter diagram, with random parameters during each repetition.
Results
Baseline model analysis
The PFS and OS curves calculated from the model agreed well with the Kaplan-Meier curves in the trial for both groups. The Weibull distribution's scale and shape parameters, adjusted R2, and correlation coefficients are shown in . The Kaplan-Meier curves and Weibull distribution curves are shown in .
The results of baseline model analyses with different time horizons where the price of taxol was used for utidelone are displayed in . Utidelone plus capecitabine vs capecitabine alone had effectiveness in 1-, 3-, and 5-year time horizons; The incremental QALYs were 0.04164, 0.1922, and 0.1961, and the incremental costs were $11,628, $13,346, and $13,370, respectively. Incremental costs per QALY for the new therapy compared with capecitabine were $279,256, $69,436, and $68,180 at 1, 3, and 5 years.
Table 3. Baseline model analyses of QALYs, costs and incremental cost per QALY of maintenance utidelone plus capecitabine vs capecitabine alone for heavily-pretreated metastatic breast cancer refractory to anthracyclines and taxanes.
One-way sensitivity analysis
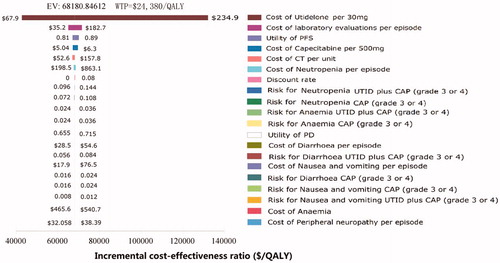
The results of one-way sensitivity analyses of key parameters () were depicted in a tornado diagram () to show the effect of each parameter on the ICER. The cost of utidelone per 30 mg impacted utmost on the ICER. The other sensitive parameters included the cost of laboratory evaluations per episode, the utility of PFS, the cost of capecitabine per 500 mg, the cost of CT per unit, and the cost of neutropenia per episode. All ICER values generated by parameters within their ranges were higher than WTP threshold of $24,380 per QALY (3 per capita GDP of China). None of the other parameters significantly altered the ICER.
Figure 3. Tornado diagram for one-way sensitivity analysis showing the influence of parameters on the incremental cost-effectiveness ratio. PFS, progression-free survival; PD, progressive disease; UTID, utidelone; CAP, capecitabine; QALY, quality-adjusted life-years; CT, computed tomography.
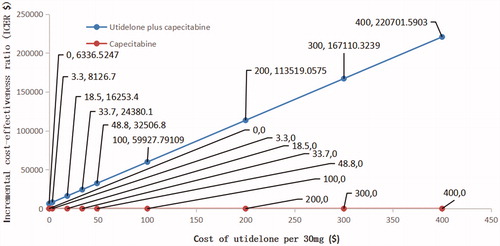
The relation between ICER and the cost of utidelone is shown in . According to the China Guidelines for Pharmacoeconomic Evaluations (Version 11) and the WHO recommendation on evaluation of pharmacoeconomics, the added cost was entirely worthwhile when ICER was less than per capita GDP, and acceptable when ICER was greater than per capita GDP and less than 3 per capita GDP, and not worthwhile when ICER was greater than 3 per capita GDPCitation8,Citation24. The graph in showed that, when ICER were $8,127 (1 per capita GDP of China), $16,253 (2 per capita GDP of China), $24,380 (3 per capita GDP of China) and $32,507 (4 per capita GDP of China), the costs of utidelone per 30 mg were $3.3, $18.5, $33.7, and $48.8, respectively.
Figure 4. The influence of cost of utidelone per 30 mg on the incremental cost-effectiveness ratio.
Probabilistic sensitivity analysis
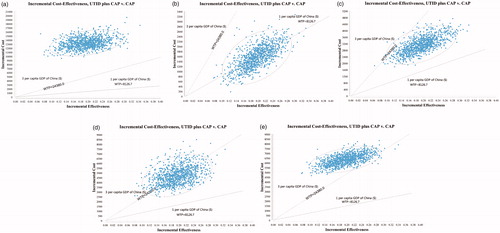
In probabilistic sensitivity analysis, we conducted a multi-angle analysis with the results of one-way sensitivity analyses. When the price of utidelone was $115.4, $3.3, $18.5, $33.7, and $48.8, the probability of ICER being less than $24,380/QALY was 0%, 100%, 99%, 50%, and 1%, and ICER being less than $8,126.7/QALY was 0%, 50%, 0%, 0%, and 0%, respectively (). At the WTP threshold of $24,280, which was 3 per capita GDP in China, suggested by guidelines for the evaluation of Chinese pharmacoeconomicsCitation8, when the costs of utidelone per 30 mg were less than $18.5, $33.7, and greater than $48.8, the probability that utidelone plus capecitabine therapy achieved cost-effectiveness were 100%, 50%, and 0%. Therefore, when the price of paclitaxel, $115.4 per 30 mg, was applied for utidelone, the combination therapy would be considered as not cost-effective. When 100% possibility of cost-effectiveness was desired, the price should be lower than $18.5.
Figure 5. Probabilistic sensitivity analysis of 1,000 cases study comparing maintenance utidelone plus capecitabine and capecitabine strategy under different costs of utidelone. (a) The price of paclitaxel for utidelone = $115.4 per 30 mg, range = $67.9–$234.9, distribution: lognormal. (b) The price of utidelone = $3.3, range = $2.64–$3.96, distribution: lognormal. (c) The price of utidelone = $18.5, range = $14.8–$22.2, distribution: lognormal. (d) The price of utidelone = $33.7, range = $26.96–$40.44, distribution: lognormal. (e) The price of utidelone = $48.8, range = $39.04–$58.56, distribution: lognormal. WTP, willingness-to-pay; UTID, utidelone; CAP, capecitabine.
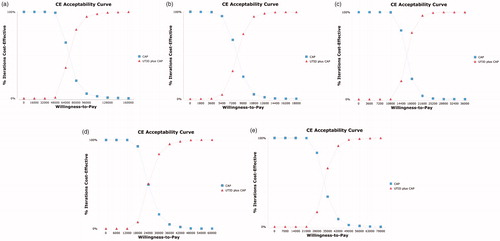
Acceptability curves suggested that the cost-effectiveness likelihood of utidelone plus capecitabine therapy would increase with higher thresholds of WTP. When the costs of utidelone per 30 mg were $115.4 (the price of paclitaxel), $3.3, $18.5, $33.7, and $48.8 (), the sensitivity ranges were $40,000–$136,000, $4,500–$15,300, $12,600–$27,000, $15,000–$51,000, and $24,500–$59,500, respectively. If all the cases achieved cost-effectiveness, the WTP threshold should be $136,000, $15,300, $27,000, $51,000 and $59,500, respectively.
Figure 6. Acceptability curves comparing maintenance utidelone plus capecitabine and capecitabine strategy under different costs of utidelone. (a) The price of paclitaxel for utidelone = $115.4 per 30 mg. (b) The price of utidelone = $3.3 per 30 mg. (c) The price of utidelone = $18.5 per 30 mg. (d) The price of utidelone = $33.7 per 30 mg. (e) The price of utidelone = $48.8 per 30 mg. QALY, quality-adjusted life-years; UTID, utidelone; CAP, capecitabine.
Discussion
Utidelone is a new class of antineoplastic agent which resembles epothilone and has been put into phase I, II, and III studies in China. Phase I and II clinical trials have demonstrated its effective therapeutic potentialCitation31,Citation32. The results of phase III study NCT02253459 suggested that, compared with capecitabine alone, utidelone plus capecitabine meaningfully improved progression-free survival, increased the proportion of patients with objective response, and prolonged overall survival in MBC patients who previously received chemotherapyCitation7. It is evidenced that utidelone is a promising investigational drug for Chinese patients with MBC. Nevertheless, the economic-effectiveness factor needs to be considered before it is widely used in clinical treatmentCitation33.
In this study, we used empirical data collected in the trial of NCT02253459 to estimate the cost and effectiveness of the treatment by Markov model and two-parametric Weibull distribution. Due to the fact that utidelone is yet not listed in China, we referred to the price of its analog, paclitaxel, in our baseline analyses and one-way sensitivity analyses.
In the analysis of 1-, 3-, and 5-year time horizons, utidelone plus capecitabine vs capecitabine gained little incremental QALYs with large incremental cost, which showed an unfavorable ICER for the new treatment regimen. The cost of utidelone per 30 mg impacted utmost on the ICER from the analyses on key populated parameters, with the other two sensitive parameters being the cost of laboratory evaluations per episode and the utility of PFS. To sum up, enhancing the quality-of-life, decreasing the price of utidelone, and decreasing the cost of laboratory evaluations is an ideal combination for the new regimen in terms of economic benefits.
According to the analysis above, only if the price of utidelone per 30 mg ranged from $3.3–$33.7, would the ICER be under 3 per capita GDP in China or at a WTP threshold. The cost of utidelone per 30 mg should be below $18.5 when to achieve cost-effectiveness with the same incremental QALYs is considered. However, as known to all, there are 31 provincial-level administrative units in China, with a huge gap of GDP—from $4,162 in Gansu province to $17,321 in Tianjin city in 2016. Therefore, the impact of regional economic conditions should be taken into account when setting the price for the new drug. We listed the maximum cost of utidelone per 30 mg ensuring 99% cost-effective probability in different provinces in , to supply information for the local governments before its entrance into the directory of national basic medical insurance in China.
Table 4. The maximum cost of utidelone per 30 mg, ensuring 99% cost-effective probability in 1,000 Monte Carlo simulations for different economic level provinces of Chinese mainland.
The consequences of this study were limited by some inaccessible data. The data of extended survival tails were obtained not from the real analysis, but from our established two-parameter Weibull survival model fitting the NCT02253459 data beyond the follow-up time horizonCitation35. However, no significant bias was introduced in our analysis as the calibrated curves of survival matched well with our Weibull model. Additionally, the robustness of our model was measured with wide ranges of possible values for each input parameter in sensitivity analyses, which made up for the limitation of inaccessibility of data beyond follow-up time.
Conclusion
In summary, the cost of utidelone per 30 mg should be lower than $18.5 to obtain the cost-effectiveness in MBC patients resistant to anthracyclines and taxanes, especially in the view of the Chinese healthcare system. Furthermore, due to the unbalanced economic development in China, the price of utidelone needs to be adjusted appropriately according to the economic level of different regions.
Transparency
Declaration of funding
This study was funded by a project of youth foundation from Natural Science Foundation of Hunan Province (No: 2018JJ3852).
Declaration of financial/other relationships
The authors have no conflicts of interest or financial relationships to disclose. Peer reviewers on this manuscript have received an honorarium from JME for their review work, but have no other relevant financial relationships to disclose.
Acknowledgements
None reported.
References
- Anders CK, Carey LA. Biology, metastatic patterns, and treatment of patients with triple-negative breast cancer. Clin Breast Cancer. 2009;9:S73–S81.
- Perou CM, Sorlie T, Eisen MB, et al. Molecular portraits of human breast tumours. Nature. 2000;406:747–752.
- De Abreu FB, Wells WA, Tsongalis GJ. The emerging role of the molecular diagnostics laboratory in breast cancer personalized medicine. Am J Pathol. 2013;183:1075–1083.
- Liu R, Guo CX, Zhou HH. Network-based approach to identify prognostic biomarkers for estrogen receptor-positive breast cancer treatment with tamoxifen. Cancer Biol Ther. 2015;16:317–324.
- Sorlie T, Tibshirani R, Parker J, et al. Repeated observation of breast tumor subtypes in independent gene expression data sets. Proc Natl Acad Sci USA. 2003;100:8418–8423.
- Yuan J, Wang S, Tang L, et al. Relative dose intensity and therapy efficacy in different breast cancer molecular subtypes: a retrospective study of early stage breast cancer patients treated with neoadjuvant chemotherapy. Breast Cancer Res Treat. 2015;151:405–413.
- Zhang P, Sun T, Zhang Q, et al. Utidelone plus capecitabine versus capecitabine alone for heavily pretreated metastatic breast cancer refractory to anthracyclines and taxanes: a multicentre, open-label, superiority, phase 3, randomised controlled trial. Lancet Oncol. 2017;18:371–383.
- Sang G, Liu G, Hu S, et al. China Center for Health Economic Research. China guidelines for pharmacoeconomic evaluations (Version 11). 2011; Chinese.
- Wu B, Ye M, Chen H, et al. Costs of trastuzumab in combination with chemotherapy for HER2-positive advanced gastric or gastroesophageal junction cancer: an economic evaluation in the Chinese context. Clin Ther. 2012;34:468–479.
- Liubao P, Xiaomin W, Chongqing T, et al. Cost-effectiveness analysis of adjuvant therapy for operable breast cancer from a Chinese perspective: doxorubicin plus cyclophosphamide versus docetaxel plus cyclophosphamide. Pharmacoeconomics. 2009;27:873–886.
- Tan C, Peng L, Zeng X, et al. Cost–utility analysis of the newly recommended adjuvant chemotherapy for resectable gastric cancer patients in the 2011 Chinese National Comprehensive Cancer Network (NCCN) clinical practice guidelines in oncology: Gastric Cancer. Pharmacoeconomics. 2014;32:235–243.
- Hayman JA, Hillner BE, Harris JR, et al. Cost-effectiveness of routine radiation therapy following conservative surgery for early-stage breast cancer. J Clin Oncol. 1998;16:1022–1029.
- Yongrui B, Ming Y, Hongbin C, et al. Economic evaluation of radiotherapy for early breast cancer after breast-conserving surgery in a health resource-limited setting. Breast Cancer Res Treat. 2012;136:547–557.
- He M, Guo Q, Hu G. Reversed urban-rural differences in breast cancer mortality (China, 2002–2008). Breast Cancer Res Treat. 2011;126:231–234.
- Lu M, Zhan X. The crucial role of multiomic approach in cancer research and clinically relevant outcomes. EPMA J. 2018;9:77–102.
- Raphael J, Helou J, Pritchard KI, et al. Palbociclib in hormone receptor positive advanced breast cancer: a cost-utility analysis. Eur J Cancer. 2017;85:146–154.
- Mar PL, Chen G, Gandhi G, et al. Cost-effectiveness analysis of magnetic resonance imaging-conditional pacemaker implantation: insights from a multicenter study and implications in the current era. Heart Rhythm. 2018;15:1690–1697.
- Shiroiwa T, Fukuda T, Shimozuma K. Cost-effectiveness analysis of trastuzumab to treat HER2-positive advanced gastric cancer based on the randomised ToGA trial. Br J Cancer. 2011;105:1273–1278.
- Hoyle MW, Henley W. Improved curve fits to summary survival data: application to economic evaluation of health technologies. BMC Med Res Methodol. 2011;10:139.
- Li S, Wang M, Liu L, et al. Which approach is better in eliciting health state utilities from breast cancer patients? Evidence from mainland China. Eur J Cancer Care (Engl). 2018;30:e12965.
- Liu L, Li S, Wang M, et al. Comparison of EQ-5D-5L health state utilities using four country-specific tariffs on a breast cancer patient sample in mainland China. PPA. 2017;23:1049–1056.
- National Bureau of Statistics [Internet]. Statistical bulletin of the People’s Republic of China on 2016 national economic and social development. Beijing: Chinese National Bureau of Statistics. 2017. [cited 2017 Feb 28]. Available from: http://www.stats.gov.cn/tjsj/zxfb/201702/t20170228_1467424.html
- Tan C, Peng L, Zeng X. Economic evaluation of first-line adjuvant chemotherapies for resectable gastric cancer patients in China. PLoS One. 2013;8:e83396.
- World Health Organization. Cost-effectiveness thresholds. 2014. [cited 2014, Jan 21]. Available from: http://www.who.int/choice/costs/CER_thresholds/en/
- Aguiar PN, Jr, Haaland B, Park W, et al. Cost-effectiveness of osimertinib in the first-line treatment of patients with EGFR-mutated advanced Non-Small Cell Lung Cancer. JAMA Oncol. 2018;4:1080–1084.
- Wan XM, Peng LB, Ma JA, et al. Economic evaluation of nivolumab as a second-line treatment for advanced renal cell carcinoma from US and Chinese perspectives. Cancer. 2017;123:2634–2641.
- Moon W, Kim SN, Park S, et al. The cost-effectiveness of deep brain stimulation for patients with treatment-resistant obsessive-compulsive disorder. Medicine (Baltimore). 2017;96:e7397.
- Lidgren M, Wilking N, Jonsson B, et al. Health related quality of life in different states of breast cancer. Qual Life Res. 2007;16:1073–1081.
- Ward S, Simpson E, Davis S, et al. Taxanes for the adjuvant treatment of early breast cancer: systematic review and economic evaluation. Health Technol Assess. 2007;11:1–144.
- Liu J, Hu Z, Feng Y, et al. Problems to affect long-term survival for breast cancer patients: an observational study of subsequent lung/bronchus malignancies. Medicine (Baltimore). 2018;97:e12603.
- Zhang P, Sun MY, Qiu GR, et al. Phase I clinical and pharmacokinetic study of UTD1, a genetically engineered epothilone analog in patients with advanced solid tumors. Cancer Chemother Pharmacol. 2011;68:971–978.
- Zhang P, Tong ZS, Tian FG, et al. Phase II trial of utidelone as monotherapy or in combination with capecitabine in heavily pretreated metastatic breast cancer patients. J Hematol Oncol. 2016;9:68–76.
- Liu Q, Wang B, Kong Y, et al. China's primary health-care reform. Lancet. 2011;377:2064–2066.
- National Data from National Bureau of Statistics of China. Beijing: Chinese National Bureau of Statistics. 2017 [cited 2017, Mar 1]. Available from: http://data.stats.gov.cn/search.htm?s=2016GDP.
- Wilson DL. The analysis of survival (mortality) data: fitting Gompertz, Weibull, and logistic functions. Mech Ageing Dev. 1994;74:15–33.