
Abstract
Objective: To assess long-term healthcare costs related to ischemic stroke and systemic embolism (stroke/SE) and major bleeding (MB) events in patients with non-valvular atrial fibrillation (NVAF) treated with non-vitamin K antagonist oral anticoagulants (NOACs).
Materials and methods: Optum’s Clinformatics Data Mart database from 1/2009–12/2016 was analyzed. Adult patients with ≥1 stroke/SE hospitalization (index date) were matched 1:1 to patients without stroke/SE (random index date), based on propensity scores. Patients with an MB event were matched to patients without MB. All patients had an NOAC dispensing overlapping index date, ≥12 months of eligibility pre-index date, and ≥1 NVAF diagnosis. The observation period spanned from the index date until the earliest date of death, switch to warfarin, end of insurance coverage, or end of data availability. Mean costs were evaluated: (1) per-patient-per-year (PPPY) and (2) at 1, 2, 3, and 4 years using Lin's method.
Results: The cost differences were, respectively, $48,807 and $28,298 PPPY for NOAC users with stroke/SE (n = 1,340) and those with MB (n = 3,774) events compared to controls. Cost differences of patients with vs without stroke/SE were $49,876, $51,627, $57,822, and $60,691 at 1, 2, 3, and 4 years post-index, respectively (p < 0.001). These cost differences were $31,292, $35,658, $44,069, and $47,022 for patients with vs without MB after 1, 2, 3, and 4 years post-index, respectively (p < 0.001).
Limitations: Limitations include unobserved confounders, coding and/or billing inaccuracies, limited sample sizes over longer follow-up, and the under-reporting of mortality for deaths occurring after 2011.
Conclusions: The incremental healthcare costs incurred by patients with vs without stroke/SE was nearly twice as high as those of patients with vs without MB. Moreover, each additional year up to 4 years after the first event was associated with an incremental cost for patients with a stroke/SE or MB event compared to those without an event.
Introduction
Atrial fibrillation (AF) is the most common form of cardiac arrhythmia and affects between 2.7–6.1 million people in the USCitation1. This condition is even more prevalent in the elderly, as illustrated by the fact that ∼10% of the US population aged >80 years is affectedCitation2–4. In addition, the prevalence of AF is expected to further increase in the upcoming years, and may reach about 11 million individuals in the US by 2050Citation5. With a total national incremental cost estimated at $26 billion in the USCitation6, AF imposes a considerable burden on healthcare systems, which is expected to grow as AF prevalence continues to increaseCitation7.
The economic burden of AF is largely driven by cardiovascular complications, such as stroke and systemic embolism (SE) that may ensue from AFCitation8. In fact, patients with AF have a 5-fold increased risk of stroke compared to those without AFCitation9, hence the importance of preventing strokes in this population. To this end, oral anticoagulants (OACs) are routinely used in patients with AFCitation10, with non-vitamin K antagonist oral anticoagulants (NOACs) being increasingly used as an alternative to vitamin K antagonists (VKAs) like warfarin. Using NOACs offers several advantages over VKAs, including a fast onset and offset of action, a simple fixed daily dosing, few clinically relevant interactions with other drugs and food, and need of the limited laboratory monitoringCitation10,Citation11. However, despite their demonstrated efficacy in preventing stroke/SE in patients with non-valvular AF (NVAF), who represent 90% of patients with AFCitation12–16, they also increase the risk of major bleeding (MB)Citation10,Citation12,Citation13,Citation15.
In addition to clinical considerations, a better understanding of the long-term healthcare costs associated with stroke/SE and MB events in patients with NVAF treated with NOACs may provide valuable information in clinical decision-making. Several studies have previously estimated the costs associated with strokes and bleedings in patients with NVAF and reported substantial incremental costs following those eventsCitation17–19. Besides a 2012 study conducted by Mercaldi et al.Citation19, previous studies evaluated the economic outcomes associated with stroke/SE and MB events over follow-up periods that barely extended beyond the first year after the event, thereby precluding an assessment of the long-term costs associated with stroke/SE and MB eventsCitation17,Citation18. Furthermore, Mercaldi et al.’sCitation19 study included data collected between 1999 and 2009, at which time NOACs were not yet approved for use in patients with AF. Given the substantial increase in the use of NOACs since their approval, providing long-term and updated estimates on the economic burden associated with stroke/SE and MB events among patients treated with these agents is warranted. Therefore, the objective of this study was to evaluate the incremental long-term healthcare costs associated with ischemic stroke/SE and MB events in patients with NVAF treated with NOACs.
Methods
Data source
This study used healthcare insurance claims from Optum’s Clinformatics Data Mart database from January 2009 to December 2016. This database includes Commercial and Medicare claims featuring ∼12–14 million annual covered lives. The database covers all 50 states in the US and contains information on patient demographics, health plan enrollment, claims from inpatient, outpatient, and pharmacy settings, as well as mortality data coming from Social Security Administration Public Death Master File. Data were de-identified and comply with the privacy requirements of the Health Insurance Portability and Accountability Act.
Study design and patient selection
A retrospective matched-cohort design was used in this study. Patients with an NOAC dispensing were classified in one of the following four cohorts: (1) patients with stroke/SE, (2) patients without stroke/SE, (3) patients with MB, and (4) patients without MB. Of note, cohorts of patients with vs without an event (e.g. stroke/SE vs without stroke) are mutually exclusive. For each type of event, the date of the first event was defined as the index date while, for patients without an event, a randomly selected index date was imputed.
More specifically, patients were included if they had the following criteria: (1) a NOAC dispensing (rivaroxaban, apixaban, dabigatran, or edoxaban) between October 19, 2010 (date of the first NOAC agent approved by the FDA [i.e. dabigatran]) and December 31, 2016; (2) had ≥1 primary diagnosis of ischemic stroke/SE or ≥1 MB during a hospitalization; (3) were ≥18 years of age as of the index date; (4) had ≥12 months of continuous health plan eligibility before the index date (i.e. baseline period); (5) had ≥1 inpatient or ≥2 outpatient claims associated with a diagnosis of AF during the baseline period or on the index date; and (6) had ≥1 dispensing of a NOAC agent overlapping with the index date. Patients whose records indicated a mechanical heart valve procedure or a diagnosis of mitral stenosis at baseline were excluded. Ischemic stroke events were identified as a primary diagnoses with the International Classification of Diseases, Ninth Revision, Clinical Modification (ICD-9-CM) codes: 433.x1, 434.x1, 436, and ICD-10-CM code: I63.xxx, while systemic embolism events were identify as a primary diagnosis with the ICD-9-CM codes: 444.xx, and ICD-10-CM code: I74.xx. MB events were identified using the validated Cunningham algorithmCitation20.
The observation (follow-up) period spanned from the index date until the earliest date between end of data availability, death, a switch to warfarin, or end of insurance coverage.
Study outcomes
The main outcome of the study was long-term all-cause healthcare costs, which included hospitalization costs, skilled nursing and long-term care facilities costs, emergency room (ER) visits costs, outpatient visit costs, pharmacy costs, and costs for other visits (including patient home and other unlisted facilities costs). For MB costs, descriptive analyses stratified by intracerebral hemorrhage (ICH) and non-ICH MB events were performed to account for the severity of ICHs compared with other types of MBs. Moreover, the corresponding all-cause healthcare resource utilization (HRU) were also evaluated.
Statistical analysis
To adjust for potential confounding between patients with vs without an event, propensity score (PS) matching was performed. More specifically, PSs were calculated using a multivariable logistic regression model in which the probability of having an event was modeled using the following covariates: age, gender, region, insurance type, year of index date, index NOAC agent, time from NOAC initiation to index date, baseline medications, baseline risk factors for stroke/SE and bleeding (i.e. those with a prevalence ≥5%), Quan-Charlson comorbidity index score, CHA2DS2-VASc scoreCitation21, HAS-BLED scoreCitation22, and baseline HRU. Estimated PSs were divided in intervals of 10% (i.e. calipers) based on percentiles of the PS distribution. Per caliper of 10%, all patients with an event (i.e. stroke/SE or MB) were matched 1:1 to patients without an event by random selection without replacement.
For each cohort, baseline characteristics were evaluated during the 12-month baseline period and were reported using mean, median, and standard deviation for continuous variables and relative frequencies for categorical variables. Comparisons of patient baseline characteristics before and after matching were based on standardized differences, and characteristics with standardized differences ≤10% were considered well balanced.
Costs were assessed using two different approaches. First, mean per patient per year (PPPY) costs were estimated and mean cost differences between the event (i.e. stroke/SE or MB) and no-event cohorts were calculated. Second, mean long-term healthcare costs were estimated using Lin et al.’sCitation23 method, which takes into account death and follow-up censoring. More specifically, the follow-up period of each patient was split into smaller time intervals (i.e. days) and, for each time interval, an average interval cost was calculated across all patients still observed (i.e. still covered by insurance and not censored). Then, each average interval cost was weighted by the Kaplan-Meier rate for the conditional probability of surviving at the start of the interval. Every mean long-term cost was estimated as these weighted interval costs summed over time. Long-term healthcare mean cost differences between patients with and without an event were then calculated. Non-parametric bootstrapping was used to calculate confidence intervals (CIs) of the cost differences. Cost data were standardized and reported in 2016 US dollars using the Medical Care Consumer Price Index (CPI).
Results
After applying all inclusion and exclusion criteria and before PS-matching, the study population consisted of 1,340 and 39,038 NOAC users with and without a stroke/SE event, respectively, and 3,774 and 43,518 patients with and without an MB event, respectively (see Supplementary Appendices 1 and 2). All 1,340 patients with a stroke/SE and 3,774 patients with an MB were matched 1:1 with controls (). After PS-matching, both populations had well-balanced baseline characteristics (standardized differences ≤10%). The mean age was 77.3 years in patients with and without a stroke/SE and 77.5 years in patients with and without an MB; female patients represented between 50.5% (without MB cohort) and 54.3% (without stroke/SE cohort) per cohort; ∼80% of patients were Medicare-insured across all cohorts; regardless of the cohort, rivaroxaban was consistently the most frequently used NOAC agent, followed by dabigatran, apixaban, and edoxaban. The mean Quan-CCI scores ranged between 3.4 (with or without stroke/SE cohorts) and 3.8 (with MB cohort); CHA2DS2-VASC scores ranged between 4.8 (with or without stroke/SE cohorts) and 5.1 (with or without MB cohorts); and HAS-BLED scores ranged between 2.4 (with or without stroke/SE cohorts) and 2.7 (with MB cohort; ). Total baseline healthcare costs were similar between patients with vs without stroke/SE ($41,676 vs $41,551) and patients with vs without MB ($48,404 vs $44,514; ). The most frequent risk factors among all cohorts were hypertension (89.0–91.6%), followed by hyperlipidemia (74.0–75.4%), and congestive heart failure (46.3–51.7%; ). The mean duration of follow-up was ∼1 year for all cohorts.
Table 1. Baseline demographics and clinical characteristics of the stroke/no stroke and major bleeding/no major bleeding matched cohorts.
Costs of patients with vs without a stroke/SE event
During follow-up, the mean PPPY total healthcare costs were $81,414 and $32,607 among those with and without a stroke/SE event, respectively, representing a mean cost difference [95% CI] of $48,807 [$42,117–$55,570] (p < 0.001; ). This difference was mostly (78.2%) driven by hospitalization costs (mean cost difference [95% CI] = $38,158 [$33,069–$43,555], p < 0.001; ) and, to a lesser extent, skilled nursing and long-term care facilities costs (mean cost difference [95% CI] = $7,256 [$6,140–$8,382], p < 0.001; ) and ER visit costs (mean cost difference [95% CI] = $1,840 [$925–$2,831], p < 0.001; ). Differences in pharmacy and outpatient visit costs did not reach statistical significance.
Figure 1. All-cause healthcare cost comparison PPPY over the entire follow-up period—patients with non-valvular atrial fibrillation using NOACs.
aStatistical differences between cohorts (95% CI) were obtained using non-parametric bootstrap procedure methods with 999 replications. Abbreviations. NOAC, non-vitamin K antagonist oral anticoagulant; PPPY, per patient per year; SE, systemic embolism; CI, confidence interval.
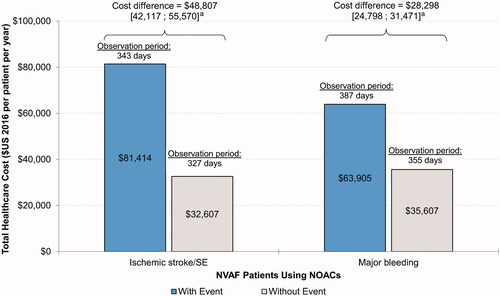
Table 2. All-cause healthcare costs—matched ischemic stroke/systemic embolism cohorts and matched major bleeding cohorts.
When using the Lin’s method, which accounts for differences in follow-up and mortality, similar results were obtained after 1 year of follow-up (mean total cost difference [95% CI] = $49,876 [$43,175–$56,104], p < 0.001) and the same drivers (i.e. hospitalization costs) accounted for highest cost differences among NOAC users with stroke/SE events (). After 2, 3, and 4 years of follow-up, the mean cost difference between patients with and without a stroke/SE event reached $51,627, $57,822, and $60,691, respectively. The increasing difference observed over time might be due to patients with recurrent events who incurred total healthcare costs of $119,826, $159,337, $197,160, and $256,907 over 1, 2, 3, and 4 years of follow-up. However, the number of patients observed after 4 years dropped to 27 and 13 in the cohorts with and without a stroke/SE event, respectively.
Table 3. Long-term all-cause healthcare costs by stroke/systemic embolism events and major bleeding events.
Costs of patients with vs without a major bleeding event
On average, patients with an MB event incurred a mean [95% CI] PPPY higher cost of $28,298 [24,798–31,471], p < 0.001 relative to patients without such an event (i.e. $63,905 vs $35,607; ). The majority of this difference (76.6%) was driven by higher hospitalization costs (mean cost difference [95% CI] = $21,682 [$19,248–$23,765], p < 0.001; ). Skilled nursing and long-term care facilities costs (mean cost difference [95% CI] = $3,296 [$2,662–$3,888]) and outpatient visit costs (mean cost difference [95% CI] = $3,100 [$1,669–$4,681]) were the other two main contributors, albeit to a lesser extent (ps < 0.001; ). In descriptive analyses where MB events were stratified by ICH (n = 428) and non-ICH types (n = 3,346), these trends were largely preserved, although the total costs associated with ICH events were numerically higher than those of non-ICH events (ICH: $86,617, non-ICH: $61,802; Supplementary Appendix 3).
When implementing Lin’s method, mostly similar findings were found after 1 year of follow-up with respect to total costs (mean cost difference [95% CI] = $31,292 [$27,749–$35,447]), hospitalization costs, skilled nursing and long-term facilities costs, and outpatient costs (ps < 0.001; ). After 2, 3, and 4 years of follow-up, the mean difference in total costs [95% CI] increased to $35,658, $44,069, and $47,022, respectively. Similar to patients with recurrent stroke events, patients with recurrent MB events incurred higher total healthcare costs at 1, 2, 3, and 4 years after the index event ($100,394, $147,846, $193,491, and $234,895, respectively). Again, a few patients were still observed after 4 years of follow-up (with MB: 77, without MB: 44; ).
Healthcare resource utilization associated with strokes/SE and major bleeding event
NOAC users with a stroke generally used more healthcare resources compared to those without a stroke (). Similar to what was observed with costs, the number of hospitalizations (mean difference [95% CI] = 1.4 [1.2–1.5]), skilled nursing and long-term care facilities visits (mean difference [95% CI] = 1.2 [0.8–1.7]), and outpatient visits (mean difference [95% CI] = 5.9 [4.1–7.8]) were significantly higher among patients with a stroke relative to those without a stroke (ps < 0.001; ). All other types of HRU were also significantly higher in patients with a stroke, except other/unclassified visits (). Similar results were observed for most HRU results when using Lin’s methods with up to 4 years of follow-up.
Table 4. All-cause healthcare resource utilization—matched ischemic stroke/systemic embolism cohorts and matched major bleeding cohorts.
MB events were also associated with higher HRU. Relative to patients without an MB event, those with an MB event had more hospitalizations (mean difference [95% CI] = 1.6 [1.5–1.7], p < 0.001), skilled nursing and long-term care facilities (mean difference [95% CI] = 0.4 [0.1–0.7], p = 0.008), and outpatient visits (mean difference [95% CI] = 3.9 [2.5–5.2], p < 0.001; ). All other types of HRU were also significantly higher among patients with MBs (). Again, similar results were observed for most HRU results when using Lin’s methods with up to 4 years of follow-up.
Discussion
In this retrospective PS matched cohort study, the long-term healthcare costs of both stroke/SE and MB events were quantified among a population of NOAC-treated patients with NVAF up to 4 years after the first stroke/SE or MB event. Patients with a stroke/SE event incurred $48,807 higher all-cause healthcare costs than control patients without these events. Similar results were observed for patients with MB, although the magnitude of the cost difference appeared less pronounced than that for stroke/SEs (i.e. $28,298 PPPY). Approximately 75% of the incremental costs was attributable to higher hospitalization costs in both comparisons. Moreover, up to 4 years after the first event, each additional year of follow-up was associated with an incremental cost for patients with a stroke/SE or MB event when using Lin’s method, suggesting these patients still incur higher costs, even several years after a first stroke/SE or MB event. These results point towards an economic benefit of preventing stroke/SE with NOACs on the long-term.
To the best of our knowledge, only one prior study evaluated the long-term incremental healthcare costs of stroke/SE and MB in a population of NVAF patients using Medicare claims data and a study design similar to that of the current studyCitation19. The authors reported that, while the large majority of the incremental costs incurred by AF patients after a stroke or MB event occurred within the first year after those events, patients also incurred additional costs within the two following years (i.e. total follow-up of 3 years). Similarly, the current study suggests that these incremental costs may extend to even longer (i.e. up to 4 years) after the initial event; however, these results were estimated on a few patients who were still observed for such a follow-up. Although investigating reasons behind those higher long-term costs was not the focus of the current study, findings that patients with recurrent stroke/SE or MB events incurred higher costs may explain part of this observation. Similarly, Mercaldi et al.Citation19 reported that stroke/SE and MB recurrences could explain part of the incremental costs of stroke/SE and MB events observed beyond the first year. Although stroke severity could not be assessed in the current study, it is known that AF-associated strokes entail a higher risk of death, recurrence, and are associated with more debilitating consequences among survivorsCitation24–26. Given that the present study focused on patients with NVAF, recurrences may be a driver of incremental costs. Further research would be needed to ascertain the drivers of these higher long-term costs.
In the first year following the stroke/SE or MB event, Mercaldi et al.Citation19 found an adjusted incremental cost of $34,772 and $25,442 (2011 USD) for stroke/SE and MB, respectively. These results are slightly lower compared to those reported in the current study at 1 year ($49,876 and $31,292 for stroke/SE and MB events, respectively [2016 USD]). The higher incremental costs in our study might be explained by differences in study populations and study design. More specifically, all patients included in this study were treated with an NOAC agent, while only 30–42% of patients in the Mercaldi et al.Citation19 study were treated with an OAC agent (i.e. warfarin). Moreover, patients in the current study had higher baseline CHA2DS2-VASc and HAS-BLED scores. Finally, MB costs reported in the Mercaldi et al.Citation19 study did not include intracranial hemorrhage (ICH) costs, while costs for these events were included in the MB costs of the current study.
A more recent study conducted by Naccarelli et al.Citation27 evaluated healthcare costs following stroke and MB events in a population of NVAF patients using healthcare claims data from the US. The authors reported that per patient per month costs following a stroke and MB event were $4,669 and $4,160, respectively, compared to patients without an event. Results of this study also corroborate our finding that the incremental healthcare costs of stroke/SE and MB events are elevated. Similar to other previous studies, costs associated with MB appeared less important than those associated with stroke/SE, although these results should be considered hypothesis generating given that no direct statistical tests were performed.
With respect to cost components, our study also supports previous findingsCitation18,Citation19,Citation27 that hospitalization costs and inpatient care costs are the main contributors to the incremental healthcare costs in patients with NVAF, accounting for more than half of total costs in both the stroke/SE and MB cohorts. Moreover, the second most important driver of the incremental cost of stroke/SE were skilled nursing and other long-term facilities costs. Similar conclusions could be drawn for patients with MB, although the cost difference was less pronounced compared to patients with stroke. Thus, these results suggest that skilled nursing facility costs also act as an important cost driver in NVAF patients suffering from stroke/SE and MB events, particularly among those with stroke/SE events.
Limitations
The present study is subject to a number of limitations inherent to using claims data. First, potential coding inaccuracies and information or classification bias could have occurred (identification of false positive or false negative AF diagnosis). Second, although information accuracy and completeness is required by administrative databases for payment purposes, billing inaccuracies and missing data may still occur. Third, despite patient baseline characteristics being well balanced between the different cohorts after PS-matching, residual confounding due to imbalance in non-observed covariates cannot be ruled out. Fourth, sample sizes became low at the later years using the Lin’s method as only a small proportion of patients had follow-up information beyond 2 years. Fifth, mortality data may be under-reported after 2011, since some states stopped contributing data to the Death Master File for privacy concerns. Despite these limitations, well-designed studies based on real-world data provide valuable information about treatment outcomes.
Conclusions
This study assessed the real-world costs of stroke/SE and MB events in patients with NVAF treated with NOACs. Patients with a stroke/SE event incurred $48,807 higher PPPY all-cause healthcare costs than control patients without those events. Similar observations were made for MB, although the cost difference appeared less pronounced than that for stroke/SE (i.e. $28,298 PPPY). Importantly, this cost difference remained substantial—and increased—even several years after the first event, suggesting the health consequences ensuing from stroke/SE and MB extend far beyond the first year after those events. These findings may help facilitate clinical decision-making for physicians when it comes to assessing the risks and benefits of NOACs.
Transparency
Declaration of funding
This research was funded by Janssen Scientific Affairs, LLC, Titusville, NJ, US. The study sponsor was involved in all aspects of the preparation of the present article.
Declaration of financial/other interests
HMS and VA are employees of Janssen Scientific Affairs, LLC. JRS and PO were employees of Janssen Scientific Affairs, LLC at the time of the study. CIC and EDP have received research grants from Janssen Scientific Affairs, LLC. FL, PL, DL, and GG are employees of Groupe d’analyse, Ltée, a consulting company that has received research grants from Janssen Scientific Affairs, LLC. ZY is an employee of Janssen Research & Development, LLC. Peer reviewers on this manuscript have received an honorarium from JME for their review work, but have no other relevant financial relationships to disclose.
Previous presentations
Parts of this manuscript were presented at the Academy of Managed Care Pharmacy (AMCP) Nexus 2017 Meeting; October 17–18, 2017; Dallas, TX, and at the International Stroke Conference (ISC); January 24–26, 2018; Los Angeles, CA, as poster presentations.
Appendix 3
Download MS Word (13.4 KB)Appendix 2
Download MS Word (45.5 KB)Appendix 1
Download MS Word (21 KB)Acknowledgements
No assistance in the preparation of this article is to be declared.
Data availability statement
The data that support the findings of this study are available from Optum (a division of UnitedHealth Group), but restrictions apply to the availability of these data, which were used under license for the current study, and so are not publicly available. Any researchers interested in obtaining the data used in this study can access the database through Optum, under a license agreement, including the payment of an appropriate license fee.
Related Research Data
References
- Center for Disease Control and Prevention. Atrial Fibrillation Fact Sheet [cited 2018 Jan 19]. Available from: https://www.cdc.gov/dhdsp/data_statistics/fact_sheets/fs_atrial_fibrillation.htm
- Acton QA. Chapter 1: atrial fibrillation. In: Acton QA, editor. Cardiac arrythmias – advances in research and treatment. Vol. 2018. Atlanta, Georgia: ScholarlyEditions; 2012. p. 1–204
- Wolf PA, Abbott RD, Kannel WB. Atrial fibrillation as an independent risk factor for stroke: the Framingham Study. Stroke. 1991;22:983–988.
- Kannel WB, Benjamin EJ. Status of the epidemiology of atrial fibrillation. Med Clin North Am. 2008;92:17–40.
- Ball J, Carrington MJ, McMurray JJ, et al. Atrial fibrillation: profile and burden of an evolving epidemic in the 21st century. Int J Cardiol. 2013;167:1807–1824.
- Kim MH, Johnston SS, Chu BC, et al. Estimation of total incremental health care costs in patients with atrial fibrillation in the United States. Circ Cardiovasc Qual Outcomes. 2011;4:313–320.
- Chugh SS, Havmoeller R, Narayanan K, et al. Worldwide epidemiology of atrial fibrillation: a Global Burden of Disease 2010 Study. Circulation. 2014;129:837–847.
- Li X, Tse VC, Au-Doung LW, et al. The impact of ischaemic stroke on atrial fibrillation-related healthcare cost: a systematic review. Europace. 2017;19:937–947.
- Go AS, Mozaffarian D, Roger VL, et al. Heart disease and stroke statistics–2013 update: a report from the American Heart Association. Circulation. 2013;127:e6–e245.
- January CT, Wann LS, Alpert JS, et al. AHA/ACC/HRS guideline for the management of patients with atrial fibrillation: a report of the American College of Cardiology/American Heart Association Task Force on practice guidelines and the Heart Rhythm Society. Circulation. 2014;130:e199–e267.
- Freedman B, Potpara TS, Lip GY. Stroke prevention in atrial fibrillation. Lancet. 2016;388:806–817.
- Abraham NS, Singh S, Alexander GC, et al. Comparative risk of gastrointestinal bleeding with dabigatran, rivaroxaban, and warfarin: population based cohort study. BMJ Clin Res. 2015;350:h1857.
- Holster IL, Valkhoff VE, Kuipers EJ, et al. New oral anticoagulants increase risk for gastrointestinal bleeding: a systematic review and meta-analysis. Gastroenterology. 2013;145:105–112.e15.
- Patel MR, Mahaffey KW, Garg J, et al. Rivaroxaban versus warfarin in nonvalvular atrial fibrillation. N Engl J Med.. 2011;365:883–891.
- Ruff CT, Giugliano RP, Braunwald E, et al. Comparison of the efficacy and safety of new oral anticoagulants with warfarin in patients with atrial fibrillation: a meta-analysis of randomised trials. Lancet. 2014;383:955–962.
- Wang TJ, Massaro JM, Levy D, et al. A risk score for predicting stroke or death in individuals with new-onset atrial fibrillation in the community: the Framingham Heart Study. JAMA. 2003;290:1049–1056.
- Boccuzzi SJ, Martin J, Stephenson J, et al. Retrospective study of total healthcare costs associated with chronic nonvalvular atrial fibrillation and the occurrence of a first transient ischemic attack, stroke or major bleed. Curr Med Res Opin. 2009;25:2853–2864.
- Fitch K, Broulette J, Kwong WJ. The economic burden of ischemic stroke and major hemorrhage in medicare beneficiaries with nonvalvular atrial fibrillation: a retrospective claims analysis. Am Health Drug Benefits. 2014;7:200–209.
- Mercaldi CJ, Siu K, Sander SD, et al. Long-term costs of ischemic stroke and major bleeding events among medicare patients with nonvalvular atrial fibrillation. Cardiol Res Pract. 2012;2012:1.
- Cunningham A, Stein CM, Chung CP, et al. An automated database case definition for serious bleeding related to oral anticoagulant use. Pharmacoepidemiol Drug Saf. 2011;20:560–566.
- Lip GY, Nieuwlaat R, Pisters R, et al. Refining clinical risk stratification for predicting stroke and thromboembolism in atrial fibrillation using a novel risk factor-based approach: the Euro Heart Survey on atrial fibrillation. Chest. 2010;137:263–272.
- Pisters R, Lane DA, Nieuwlaat R, et al. A novel user-friendly score (HAS-BLED) to assess 1-year risk of major bleeding in patients with atrial fibrillation: the Euro Heart Survey. Chest. 2010;138:1093–1100.
- Lin DY, Feuer EJ, Etzioni R, et al. Estimating medical costs from incomplete follow-up data. Biometrics. 1997;53:419–434.
- Lin H-J, Wolf PA, Kelly-Hayes M, et al. Stroke severity in atrial fibrillation. Stroke. 1996;27:1760–1764.
- Hannon N, Sheehan O, Kelly L, et al. Stroke associated with atrial fibrillation–incidence and early outcomes in the north Dublin population stroke study. Cerebrovasc Dis. 2010;29:43–49.
- Kimura K, Minematsu K, Yamaguchi T, et al. Atrial fibrillation as a predictive factor for severe stroke and early death in 15,831 patients with acute ischaemic stroke. J Neurol Neurosurg Psychiatry. 2005;76:679–683.
- Naccarelli G, Stokes M, DeLeon A, et al. Abstract 301: healthcare costs following stroke and major bleeding events in nonvalvular atrial fibrillation patients. Circ Cardiovas Qual Outcomes. 2015;8. Available from: https://doi.org/10.1161/circoutcomes.8.suppl_2.301