
Abstract
Background: IVF is now a wide spread procedure globally, and currently 65 countries report annually all or part of their IVF/ICSI cycles, from which the International Committee Monitoring progress in Assisted Reproduction Technology (ICMART) published its report. There is considerable variation in the utilization (number of cycles per population) globally.
Aims: The objectives of this study were to assess whether utilization is related to national wealth, presented as gross domestic product (GDP), and whether the GDP has any effect on success in IVF treatment, mainly delivery and clinical pregnancy rates.
Results: The results demonstrated a significant positive correlation between utilization and GDP (CC = 0.563, p = 0.00000194), and both utilization and GDP have strong negative correlations to successful outcome of the treatment-clinical pregnancy rate (CC: −0.460, p = 0.00015; CC: −0.399, p = 0.0012, respectively) and delivery rates (cc = −0.396, p = 0.00484; cc = −0.3, p = 0.0179, respectively).
Conclusions: Poor nations have less utilization of IVF, probably due to the limited affordability of the treatment, but reassuringly do not seem to have less success in the treatment. Further research is required to fully understand the implications of these correlations and to better design national and international fertility policies.
Keywords:
Forty years after the birth of Louise Brown, the world’s first test-tube baby, the International Committee Monitoring in Assisted Reproduction Technology (ICMART) reported that the total number of babies born worldwide as a result of in vitro fertilization (IVF) and other advanced fertility treatments is more than eight millionCitation1. ICMART has collected data for 16 years since 1989, with the most recent published annual report summarizing the 2011 dataCitation2. While there were ∼ 196 independent countries in 2011, only those countries which submitted data according to ICMART protocols were included in the report, for a total of 65 countries with a calculated 1,643,912 annual cycles. The utilization rate of IVF (or availability) was calculated as the total number of cycles divided by total country population in 2011. There were huge variations in the utilization rate, from five cycles per million in the Ivory Coast to 5,206 cycles per million in Israel (mean = 1,006 cycles per million, SD = 1048.8). The reasons for such variation in utilization are not addressed in the annual report, but Chambers et al.Citation3 calculated from the 2006–2007 ICMART database that, in 30 higher- and middle-income countries with gross domestic product (GDP) equivalent to at least USD $8,000 per capita, the most significant factor affecting utilization was consumer affordability. Affordability can be defined as the ratio between the cost of IVF treatment relative to annual income, and, therefore, treatment cycles can be increased either by a higher income or reimbursement of treatment cycles. Reimbursement policy in many ways reflects the pro- or anti-natal policy of a country, and is not necessarily related to national wealth, but rather to cultural and social priorities.
However, it is not known if there is any correlation between a country’s wealth and/or utilization and success in ART treatment and to our best knowledge no such study was ever conducted. One can hypothesize that wealthy countries have higher utilization rates because of the availability of national funding to reimburse relatively expensive IVF cycles, and/or that the treatment is relatively more affordable to the general population, and hence there is a higher propensity to pay out of pocket. It can also be assumed that the national average pregnancy rate would be expected to be higher in countries with high utilization, and in wealthier countries compared with poorer countries. This could be due to greater resources increasing the likelihood of the former having established well-run and well-funded IVF units that employ modern technology and well-trained personnel, thus being able to provide more IVF cycles. The objective of this analysis was to evaluate any correlation between national wealth (assessed as GDP per capita) and utilization of IVF and success rate with this treatment.
Success in ART is a complicated outcome that can be defined in many ways (response to treatment, number of oocytes, pregnancy rate, delivery rate), and is influenced by many factors such as women’s age, number of embryos transferred, and others. However, the delivery rate is the most comprehensive single outcome and was recommended by the Harbin Consensus Group to be the primary outcome in all clinical trialsCitation4 and, hence, we chose it as a measure of national success. We used the latest ICMART dataCitation2 and the 2011 GDP for each countryCitation5 () and performed correlations of GDP and utilization (cycles per million) with clinical pregnancy and delivery rates.
Table 1. Reported and estimated cycles of IVF in 2011 and national GDP per country analysed.
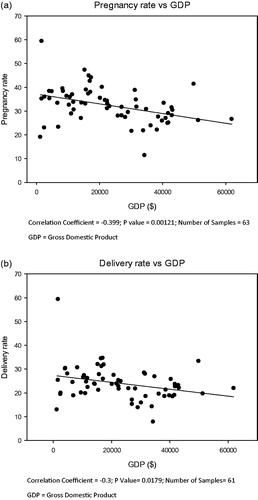
Our analysis demonstrates that there is a strong positive correlation between utilization and GDP (Pearson correlation coefficient (CC) = 0.563, p = 0.00000194) (). There was a strong negative correlation between utilization (aspirated cycles per million population) and either clinical pregnancy and delivery rates (CC = 0.510, p = 0.0000166; cc = −0.351, p = 0.00475, respectively) and between GDP and clinical pregnancy and delivery rates (CC = −0.399, p = 0.0012; cc = −0.3, p = 0.0179, respectively) ( and , respectively).
Figure 1. Correlation between number of IVF cycles per million population and national GDP. Correlation coefficient = 0.563; p-value = 0.00000194; Number of samples = 62. GDP, Gross Domestic Product.
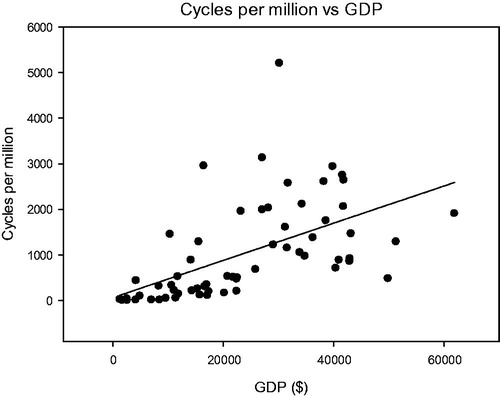
Figure 2. Correlation between utilization and success in IVF. (a) Utilization vs pregnancy rate. Correlation coefficient = −0.51; p-value = 0.0000166; Number of samples = 64. (b) Utilization vs delivery rate. Correlation coefficient = −0.351; p-value = 0.00475; Number of samples = 63
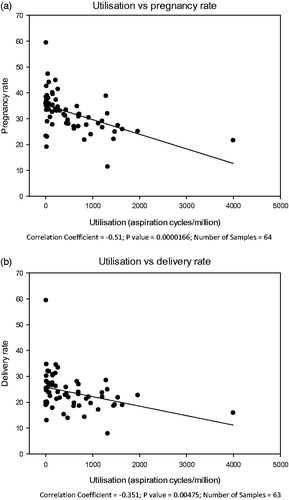
Figure 3. Correlation between GDP and success IVF. (a) GDP vs pregnancy rate. Correlation coefficient = −0.399; p-value = 0.00121; Number of samples = 63. (b) GDP vs delivery rate. Correlation coefficient = −0.3; p-value = 0.0179; Number of samples = 61. GDP, Gross Domestic Product.
These data confirm that wealthier countries have higher utilization rates of IVF treatment. This can be explained by greater affordability, allowing individuals to more often pay for treatment out-of-pocket, and/or more liberal, pro-natalist policies that enable widespread reimbursement of IVF cycles, as occurs in the Nordic countries. This correlation between GDP and availability applies not only to the wealthiest countries, as analysed by Chambers et al.Citation3, but occurs across all analysed countries, including those with very low GDP.
What is surprising, however, is that, contrary to the logical assumption, there is a strong negative correlation between both utilization and GDP, and success of IVF treatment, i.e. the chances of conceiving and giving birth in countries with high utilization rates and/or high GDP is lower than in countries with low GDP. In this study we did not attempt to identify the causes of this negative correlation which remains unclear. There are a few plausible explanations for this phenomenon, including different types of populations (age and causes of infertility), or differences in clinical practice, such as the number of embryos transferred, or level of access to treatment and affordability. We can hypothesize that, in lower-income countries, because of a lack of financial resources, including absence of reimbursement, only those patients with a high predicted chance of successfully conceiving would undergo IVF treatment, either paying out of pocket or put forward by their clinicians. Conversely, in richer countries, many patients choose to undergo this invasive and expansive treatment even if the chances of success are lower, either because of more state support or higher affordability of patients. Empirically, we can consider two extremes: Israel, which is 22nd out of 65 in GDP ranking, has the highest utilization rate, due to a strong pro-natal policy that generously provides reimbursement of unlimited IVF cycles for all women up to the age of 45 years and until they have two childrenCitation6, but one of the lowest pregnancy and delivery rates (21.6%, 62nd/64 countries; 15.6% 58th/63; respectively). This is most probably due to the reality that many women with very low or almost no chance of successful conception are undergoing IVF treatment. On the other hand, some countries with a very low number of IVF cycles (both absolute and per million) show high success rates, notably Mali, with a GDP per capita of USD 1,662 and utilization rate of just 11 cycles per million, but with the highest pregnancy and delivery rates of 59.4%.
Assessing differences in populations can be quite difficult due to a lack of comprehensive data, but we examined the Pregnancy Rate (PR) and the Delivery Rate (DR) in women younger than 34 years, and in this age group there was no correlation to GDP. We also evaluated the correlation of GDP to some elements of differences in practices and found a strong negative correlation to (i) the proportion of fresh IVF and ICSI from total cycles (68.8% globally) (r = −0.627; p < 0.00001), i.e. developing countries did less frozen embryo transfer (FET) than developed countries, but this was not reflected in PR or DR at the FET cycles; (ii) number of average embryos transferred (r = −0.59; p < 0.000001). There was very strong positive correlation between GDP and the proportion of single embryo transfer (SET) (r = 0.512; p < 0.0001) and DR in SET (r = 0.524; p = 0.000134).
The difference in SET practice can be demonstrated in some countries, notably Japan, Australia, and New Zealand, in which SET was performed in more than 50% of cycles, and indeed the delivery rate decreased over the years. In Japan, where 72% of cycles were SET, DR was only 7.9% per aspiration, the lowest ranking of all countries. It, therefore, seems that, in higher-income countries, more SET are performed, fewer average embryos are transferred, and PR and DR are better when SET is done. In less developed countries the proportion of twins was higher (r = −0.35; p = 0.00368), probably due to the higher number of embryos transferred, but there was no increased rate of early pregnancy loss (r = −0.203; p = 0.145).
Important limitations in this study are the quality, extensivity, and completeness of reporting: roughly only a third of the world’s countries report ART outcomes to the ICMART project; the rest, which is the majority, either do not report outcomes, or do not have any ART treatment in their countries. We believe that it will be useful to gain registry data of all countries and not a sample, as is currently available, and welcome the new African registryCitation7, but an Asian registry is still non-existent. The analysis of GDP in relation to ART outcomes may be affected by higher reporting in well off countries: the median GDP in the reporting countries was $21,748, while the world median of the 182 countries with GDP data in 2011 was less than half of that, at $10,315. Moreover, in many countries reporting is not compulsory, and there is partial reporting, with a possible bias for only high performing clinics submitting their information, and follow-up on pregnancies is very limited in many countries with large areas lost to follow-up.
Our study highlighted for the first time the important contributing factor of national wealth in the complexity of outcome measurement. It is quite reassuring and even satisfying that developing countries, although having significantly less utilization of FET and SET cycles, and higher number of embryos transferred, are not inferior in outcome measurements of clinical PR, DR, and embryo loss. The magnitude of a country’s national wealth is not detrimental to successful conception from IVF treatment, i.e. sufficient and appropriate knowledge and skills are available in less wealthy countries, and it is probably mainly lack of resources and affordability that prevents higher utilization and access to costlier, more-advanced ART in these countries. Nevertheless, further detailed research is required to fully understand the impact of national wealth, resources allocations, and outcome measures to better plan and design national fertility policies.
Transparency
Declaration of funding
There is no funding to declare.
Declaration of financial/other relationships
AL is a fertility specialist and managing director of Haipharm Ltd, London, UK, an independent pharmaceutical consultancy. WC is an employee of Theramex Ltd, London UK. GL is a PhD candidate, Department of Women and Children's Health, King's College London, UK. The author and peer reviewers on this manuscript have no other relevant financial relationships to disclose.
Acknowledgements
None reported.
References
- ESHRE press release 3rd July, 2018 [cited 2018 Nov]. Available from: https://www.eshre.eu/ESHRE2018/Media/ESHRE-2018-Press-releases/De-Geyter
- Adamson GD, de Mouzon J, Chambers GM, et al. International Committee for Monitoring Assisted Reproductive Technology: world report on assisted reproductive technology, 2011. Fertil Steril. 2018;110:1067–1080.
- Chambers GM, Hoang VP, Sullivan EA, et al. The impact of consumer affordability on access to assisted reproductive technologies and embryo transfer practices: an international analysis. Fertil Steril. 2014;101:191–198.
- The Harbin Consensus Conference, Workshop Group. Improving the Reporting of Clinical Trials of Infertility Treatments (IMPRINT): modifying the CONSORT Statement. Hum Reprod. 2014;29:1995–2005.
- Human Development Report. 2018 [cited 2018 Nov]. Available from: http://hdr.undp.org/en/content/gdp-per-capita-2011-ppp.
- Haaretz. May 2017 [cited 2018 Nov]. Available from: https://www.haaretz.com/israel-news/.premium-israel-remains-as-ivf-paradise-as-number-of-treatments-rises-1.5470164.
- Dyer S, Archary P, de Mouzon J, et al. Assisted reproductive technologies in Africa: first results from the African network and registry for ART, 2013. RBMO 2019;38:216–224.