
Abstract
Background: Chemotherapy-induced nausea and vomiting (CINV) are among the most common and debilitating side-effects patients experience during chemotherapy, and are associated with considerable acute care use and healthcare cost. It is estimated that 70–80% of CINV could be prevented through appropriate use of CINV prophylaxis; however, suboptimal CINV compliance and control remains an issue in clinical practice. Netupitant/palonosetron (NEPA) is a fixed combination of serotonin-3 (5-HT3) and neurokinin-1 (NK1) receptor antagonists (RAs), respectively, indicated for the prevention of acute and delayed nausea and vomiting associated with highly emetogenic chemotherapy (HEC) and moderately emetogenic chemotherapy (MEC). Phase 3 clinical trials showed a significantly higher complete response rate in both acute and delayed CINV in chemotherapy-naïve patients receiving NEPA compared to patients receiving palonosetron.
Objective: The objective of this study was to estimate the budgetary impact of adding NEPA to a US payer or practice formulary for CINV prophylaxis.
Methods: A model was developed to estimate the impact of adding NEPA to the formulary of a hypothetical US payer with 1.15 million members, including 150,000 (13%) Medicare beneficiaries. The model compared the annual total costs of CINV-related events and CINV prophylaxis in two scenarios: base year (no NEPA) and comparator year (10% and 5% NEPA usage in HEC and MEC patients, respectively). A univariate sensitivity analysis was conducted to explore the effect of variability in model parameters on the budget impact.
Results: A total of 2,021 patients were eligible to receive CINV prophylaxis. With NEPA, CINV prophylaxis costs increased by 0.7% ($3,493,630 vs $3,518,760) while medical costs associated with CINV events decreased by 3.9% ($15,118,639 vs $14,532,442), resulting in a net cost saving of $561,067 (3.0%) for the health plan ($18,612,269 vs $18,051,202), or $0.04 per member per month. This was equivalent to saving $5,011 per patient moved to NEPA. Among all 5-HT3 RA + NK1 RA regimens, NEPA was associated with the lowest CINV-related costs, leading to the lowest total cost of care.
Conclusions: Adding NEPA to a payer or practice formulary results in a net decrease in the total budget due to a substantial reduction in CINV event-related resource utilization and medical costs, and an increase in pharmacy costs <1%, saving over $5,000 per patient.
Introduction
Chemotherapy-induced nausea and vomiting (CINV) are among the most common and debilitating side-effects patients experience during chemotherapyCitation1–3. CINV is associated with poor outcomes and impaired dose intensity of chemotherapyCitation4–7, and CINV-related hospitalization and other healthcare resource use can incur substantial healthcare costs. A recent study of over 300,000 patients receiving chemotherapy found nausea and emesis to be among the 10 chemotherapy toxicities associated with avoidable emergency department (ED) visits and hospitalizationsCitation8, leading to their inclusion in OP-35, the first national oncology outcome measure instituted by the US governmentCitation9.
Antiemetic guidelines from the American Society of Clinical Oncology (ASCO) and the National Comprehensive Cancer Network (NCCN) recommend CINV prophylaxis including a serotonin-3 receptor antagonist (5-HT3 RA), a neurokinin-1 receptor antagonist (NK1 RA), and dexamethasone (dex) for all patients treated with highly emetogenic chemotherapy (HEC)Citation10. For patients undergoing moderately emetogenic chemotherapy (MEC), suggested prophylaxis includes a 5-HT3 RA with or without an NK1 RACitation1,Citation11. It is estimated that 70–80% of CINV could be prevented through appropriate prophylaxisCitation12, but suboptimal physician adherence to antiemetic prophylaxis guidelines remains an issue in clinical practiceCitation13,Citation14.
NEPA (netupitant/palonosetron) is a fixed combination of netupitant (an NK1 RA) and palonosetron (a 5-HT3 RA) that is indicated and included within national guidelines for the prevention of acute and delayed nausea and vomiting associated with both HEC and MEC.
The cost of CINV prophylaxis is often borne by the pharmacy function within a healthcare organization, while the benefits of avoiding CINV-associated medical consequences and costs typically accrue to the medical function. Increasingly, organizations are evolving to evaluate cancer on a “total cost of care” basis, particularly when the potential exists for medical savings that outweigh pharmacy expenditures. However, payers, at-risk oncology practices, and other groups selecting agents for CINV prophylaxis often lack information on the total cost of CINV that incorporates the costs of both the prophylaxis and avoided CINV events. The objective of this study was to estimate the budgetary impact of adding NEPA to a US payer or practice formulary for CINV prophylaxis.
Methods
Overview
A model was developed to estimate the impact of adding NEPA to the formulary of a hypothetical US payer with 1.15 million members, including 150,000 (13%) Medicare beneficiaries. The model compared the annual total costs of CINV-related events and CINV prophylaxis from a payer perspective, by comparing two scenarios: (1) a base year without the use of NEPA and (2) a comparator year with 10% and 5% usage of NEPA in patients undergoing HEC and MEC, respectively. Market shares of competing antiemetic agents in the comparator year were reduced proportionally according to their market share in the base year.
Model parameters
Population
US epidemiological data, guideline recommendations, and guideline compliance rates were used to estimate the model’s target population. In 2014, the prevalence of actively treated cancer was estimated at 0.4% among patients covered by commercial health plans and 2.6% among Medicare beneficiariesCitation15; 39.8% and 64.6% of patients in each respective group received infused chemotherapyCitation15. Nearly half (49%) of patients treated with infused chemotherapy received MEC or HECCitation16. Treatment guidelines recommend all HEC patients receive a three-drug regimen (5-HT3 RA + NK1 RA + dex) for CINV prophylaxis. With 90% guideline compliance, as reported in prior literatureCitation17, it was assumed that the remaining 10% of patients receive a two-drug regimen consisting of 5-HT3 + dex. For patients receiving MEC, it was assumed that guideline recommendations would result in 10% of patients receiving a 5-HT3 RA + NK1 RA + dex regimen and the remainder a 5-HT3 RA + dex regimen. Guideline compliance among patients with MEC was assumed to be 73% and 98% for the three-drug and two-drug regimen, respectivelyCitation17. Non-guideline-recommended therapy was assumed to consist of 5-HT3 RA + dex for patients eligible for the recommended 5-HT3 RA + NK1 RA + dex regimen, and dex monotherapy for patients eligible to receive 5-HT3 RA + dex.
Market share
The base year treatment mix of CINV prophylaxis agents other than NEPA among patients was based on unpublished market research data for patients undergoing HEC and MEC, due to the unavailability of published references (). In the comparator year, we assumed that 10% of patients with HEC and 5% of patients with MEC would receive NEPA; these patients were moved proportionately from each of the agents utilized in the base year. The remaining 90% of patients with HEC and 95% of patients with MEC would receive the same CINV prophylaxis agents in the base year and the comparator year. There were no differences assumed in patient characteristics for those receiving NEPA vs non-NEPA agents.
Table 1. Market share.
CINV prophylaxis medication costs
Dose per cycle was obtained from the US Food and Drug Administration (FDA) prescribing information (PI) for each prophylaxis agent; cost per dose was estimated using the Average Sales Price (ASP) plus 6% for intravenous products and wholesale acquisition cost (WAC) plus 3% for oral products (). Additionally, a dispensing fee and an assumed $50 copayment were included for oral products, and administration costs were included for injectable/infused products. Patients were assumed to have six cycles of chemotherapy and CINV prophylaxis.
Table 2. Prophylaxis cost (2017 USD).
Medical costs of CINV events
The medical cost of CINV-related events per cycle for each regimen was calculated as the product of: (a) the rate of patients having CINV events despite prophylaxis; (b) the percentage of CINV events requiring resource use; and (c) the medical cost per CINV event requiring resource use. CINV rates were assumed to be independent of the cycle in which they occurred; therefore, overall CINV risk rates for multiple-cycle chemotherapy were calculated as having cumulative likelihood. The cost of a CINV resource use event was assumed to be consistent, regardless of whether the patient received HEC or MEC.
(a) CINV event rate: The overall CINV event rate was determined using PIs and clinical trial dataCitation18–26. The hierarchy of data sources used was: (1) PI, (2) clinical trial publication supporting the regimen’s FDA approval, and (3) a weighted average of the published clinical studies on the regimen.
(b) CINV events resulting in resource use: The model assumed that not all CINV events involved resource use; some patients experience CINV symptoms, yet do not receive medical treatment for them. Burke et al.Citation4 reported that, per cycle, 18.2% of patients receiving HEC and 13.0% of patients receiving MEC had CINV-related resource use (CINV-RU), rates well below the known overall CINV per cycle event rates associated with prophylaxis. To calculate the proportion of CINV events involving CINV-RU in this model, the rates from Burke et al.Citation4 were divided by the weighted average CINV event rate for model treatments; this yielded proportions of 76% for HEC and 33.6% for MEC of patients experiencing CINV who also incurred related resource use. We then applied these proportions to the CINV rate per cycle for each prophylaxis regimen, to determine the CINV-RU event rate per cycle for each prophylaxis regimen ().
Table 3. Prophylaxis regimen-specific CINV event-related medical costs.
(c) CINV-related event costs: The average cost per CINV-RU event was sourced from several studies and databases. In a retrospective claims analysis, Burke et al.Citation4 reported that 64.3% of CINV-RU was inpatient, 25.9% ambulatory, and 9.8% ED utilization. The event cost in each setting was obtained from multiple sources, resulting in three scenarios ():
Table 4. Data sources and inputs for CINV-related medical event costs.
Burke et al.Citation4 estimated inpatient, ambulatory, and ED visits to cost $7,448, $1,494, and $918, respectively, in 2005 US dollars (USD).
A chart review study in an integrated healthcare delivery system identified breast cancer patients experiencing adverse events from chemotherapyCitation27, and reported costs for nausea/vomiting of $10,074 (inpatient), $91 (ambulatory), and $250 (ED) in 2013 USD.
The Healthcare Cost and Utilization Project (HCUP) by the Agency for Healthcare Research and Quality reported an average charge of $23,063 for a hospital admission related to nausea and vomiting in the year 2014Citation28. Considering a 49% reimbursement rate and an additional 26.4% physician service fee, we derived a cost of $14,284 for each hospitalizationCitation29,Citation30.
For this scenario, ambulatory cost was estimated to be $240 (2014 USD) per visit based on average revenue per established patient ($1,500) in the National Practice Benchmark for Oncology report, adjusted by 16% (i.e. evaluation and monitoring revenue as a percentage of total revenue)Citation31. ED costs for this scenario were assumed to equal the median charge of $1,233 (2014 USD) for ED visits on 10 conditions from a nationally representative databaseCitation32.
The three cost scenarios, each weighted by Burke’s percentage of setting, were averaged and adjusted to 2017 USD. The average cost ($8,461 per CINV event with resource use) was used in the model.
Model analysis
The model estimated the budget impact to the health plan and incremental per member per month (PMPM) and per patient costs of including NEPA on the health plan’s formulary. The total cost to the health plan was composed of prophylaxis medication costs plus CINV-RU medical costs for each regimen. The prophylaxis medication cost included acquisition costs of CINV prophylaxis plus administration or dispensing fees exclusive of patient copayments. The medical cost of CINV-RU for each regimen was calculated as the product of: (1) the rate of patients with CINV, (2) the proportion of CINV episodes requiring resource use, and (3) the medical cost per CINV-RU event. Total costs to the health plan were further influenced by population size, mix of market share, and the number of chemotherapy cycles.
Sensitivity analysis
A univariate sensitivity analysis was used to explore the effect of variability in the model parameters on the budget impact. Costs were increased or decreased by 10% from the current cost (except palonosetron, which was decreased by 65% to reflect patent expiration), the market share of NEPA in the comparator year was halved or doubled, and the number of cycles of chemotherapy was varied by one; the remaining parameters were increased or decreased by 10 percentage points (within 0–100%). Separate scenario analyses including additional recent NK1 agents were also conducted.
Results
Based on the epidemiological data, in a hypothetical 1.15 million-member health plan with 150,000 Medicare beneficiaries, 8,130 patients were estimated to receive active treatment for cancer, including 4,210 receiving infused chemotherapy. Within the infused chemotherapy population, 716 patients received HEC and 1,305 patients MEC, for a total of 2,021 patients eligible to receive CINV prophylaxis with 5-HT3 RA ± NK1 RA + dex. After adjusting for guideline compliance rates, 738 patients were estimated to receive 5-HT3 RA + NK1 RA + dex (triple prophylaxis) and 1,257 patients 5-HT3 RA + dex, with 26 patients receiving only dex monotherapy.
Comparing the scenarios to evaluate the impact of adding NEPA showed an $25,130 (0.7%) increase in CINV prophylaxis cost of from the base year ($3,493,630 vs $3,518,760). Medical cost associated with CINV events decreased $586,197 (3.9%), from $15,118,639 to $14,532,442. Together these produced a net cost saving of $561,067 (3.0%) for the total CINV cost of care for the health plan ($18,612,269 vs $18,051,202), equivalent to savings of $0.04 PMPM (), $760.25 per patient receiving triple prophylaxis, or $5,011 per patient moved to NEPA.
Table 5. Base case results (2017 USD).
Patients receiving palonosetron had the lowest total CINV cost, including prophylaxis cost and CINV medical cost, among the 5-HT3 RA + dex regimens, while patients receiving NEPA incurred the lowest total cost among the triple prophylaxis regimens. The low cost for NEPA was driven principally by low CINV event rates (; ). The average prophylaxis cost per patient was highest for granisetron + rolapitant + dex ($6,290) and lowest for ondansetron + dex ($301); prophylaxis cost per patient for NEPA + dex was $3,329. CINV medical costs were highest for regimens with rolapitant ($11,531) and lowest for NEPA + dex ($4,011). For the health plan, CINV prophylaxis and medical costs represented 19% and 81% of total CINV cost of care, respectively, in the baseline period.
Figure 1. Per-patient CINV total costs (2017 USD) by CINV prophylaxis regimen, with prophylaxis and CINV medical cost breakout. Abbreviations. APR, aprepitant; CINV, chemotherapy-induced nausea and vomiting; FOS, fosaprepitant; GRAN, granisetron; IV, intravenous; MEC, moderately emetogenic chemotherapy; NEPA, netupitant/palonosetron; OND, ondansetron; PALO, palonosetron; PO, oral; ROL, rolapitant; SubQ, subcutaneous; USD, United States dollars.
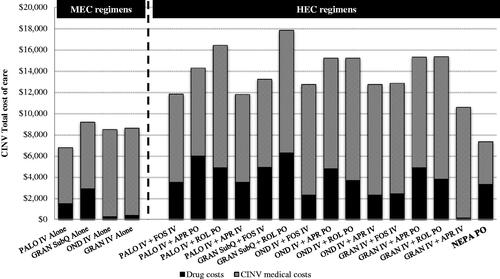
Table 6. Per patient costs (2017 USD) by CINV regimen.
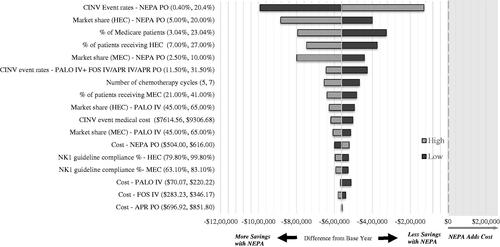
Within the expected ranges of key input parameters, total costs in the univariate sensitivity analysis were consistently lower in the comparator year compared to the base year (), favoring NEPA. Results were most sensitive to CINV event rates, the market share of prophylaxis regimens, the proportion of Medicare beneficiaries in the health plan, and the proportions of patients receiving HEC and MEC. A 10-percentage-point increase (worsening) in CINV event rate with NEPA continued to produce cost savings ($129,000). Adding NEPA would continue to be cost-saving (>$420,000), even with decreased CINV event rates for palonosetron and fosaprepitant, or with reduced palonosetron costs associated with generic availability. Separate scenario analyses, including additional recent NK1 agents, did not materially change the results.
Figure 2. Sensitivity analysis results. Abbreviations. APR, aprepitant; CINV, chemotherapy-induced nausea and vomiting; FOS, fosaprepitant; HEC, highly emetogenic chemotherapy; IV, intravenous; MEC, moderately emetogenic chemotherapy; NEPA, netupitant/palonosetron; NK1, neurokinin-1; PO, oral.
Discussion
The primary objective of this analysis was to evaluate the budget impact of NEPA for the treatment of CINV from a US payer perspective over 1 year, assuming 10% and 5% NEPA use among patients with HEC and MEC, respectively. Despite the higher prophylaxis medication cost of NEPA compared to generically available agents, results from our analysis suggest that adding NEPA to the payer formulary is cost-saving due to its efficacy at preventing CINV and thereby avoiding high CINV-associated medical costs. The expected cost saving to the payer was over $560,000 ($0.04 PMPM), amounting to over $5,000 per patient moved to NEPA.
The sensitivity analysis confirmed the robustness of the results and continued to predict cost savings with varied parameters. Particularly, with patent expirations on several agents (e.g. palonosetron, fosaprepitant) included in the model, lower-cost generic drugs may be available for CINV prophylaxis. However, regardless of cost reductions from generic prophylaxis agents, NEPA would still be cost-saving, as the savings it yields—driven by lower CINV-related medical events and costs—far outweigh its incremental costs of prophylaxis. The opportunity and need for medical cost savings are substantial, representing over 80% of the total costs of care for CINV.
With rising attention on opportunities to improve cancer treatment outcomes while reducing costs, decision-makers are increasingly open to evaluating medical cost offsets to potential pharmacy expenditure increases. Nevertheless, the short-term allure of pharmacy cost reductions and the opaque or undocumented impact of medical costs often necessitate that a sizeable risk/reward ratio be demonstrated to support any pharmacy “investment”. The >10:1 ratio of medical savings to pharmacy incremental spend seen with NEPA may be sufficiently meaningful to provoke consideration from decision-makers, particularly when aligned with recent Centers for Medicare and Medicaid Services (CMS) clinical initiatives highlighting the benefits of reducing avoidable chemotherapy toxicities including nausea and emesisCitation8,Citation33.
Previous studies have also suggested cost savings with NEPA. Restelli et al.Citation34 developed a Markov model from the Italian National Health Service perspective to evaluate the budget impact of NEPA on a 5-year time horizon. The authors did not separate CINV events from resource use, but estimated CINV episode costs and added costs for injection site reactions and anorexia. Using this costing method, the authors found NEPA was likely to lead to save €63.7 million over 5 years for the estimated chemotherapy cycles in Italy. Another study developed a three-state (complete response, complete protection, and incomplete response) Markov model from the UK National Health Service perspective based on the NEPA clinical trial resultsCitation35. Other agents considered in the model were aprepitant + palonosetron or palonosetron alone. Over 5 years, the model showed a cumulative cost saving of nearly £14 million. While the actual monetary values should not be compared head-to-head across different countries, both the Italian and English studies were consistent with our finding that the lower rates of CINV-associated events with NEPA led to overall cost savings, regardless of additions to prophylaxis costs.
Limitations
This study has several limitations. First, the epidemiological data used for calculating the target population were not available from a single source. Therefore, multiple data sources were used to calculate the target population in a step-wise fashion using a number of assumptions. Additionally, the market shares used in the model may not be generalizable to a particular payer, and the budget impact may change if market shares change or additional drugs are approved and used. To mitigate this limitation, we reported per patient costs by treatment regimen.
Next, medical costs were sourced from claims-based evidence, which may under- or over-estimate CINV-associated resource use and costs due to potential coding errors or missing data. Nevertheless, the inclusion of multiple sources, all of which present substantially similar depictions of cost despite the use of various sources and methods, is believed to mitigate this limitation. Additionally, assigning costs to CINV events is difficult since CINV could be one of multiple factors driving resource utilization, and not all CINV events result in resource utilization. To address these limitations, conservative estimates were used as default values, which may result in under-statement of the costs associated with CINV events.
Another limitation was that the rates of CINV events per cycle were often determined in separate trials, a common practice in budget impact models, yet one involving indirect comparisons that may not account for differences in study populations. The calculation of the proportion of CINV events requiring resource use was based on a weighted average of CINV rates for model treatments, and thus varied based on the market shares used in the model. A sensitivity analysis showed that, while the rates impact the numeric values of the cost savings, the topline results remain consistently in favor of NEPA.
This analysis does not consider the potential benefit of avoided impairment of chemotherapy dose or duration due to fewer CINV events. Patient copayments, which vary based on individuals’ plan coverage, were assumed to be $50; the univariate sensitivity analysis, showing varying copayments from $0 to $100, had a minimal impact on the overall budget (result not reported). Finally, the costs of rescue medication and side-effects associated with the use of prophylaxis were not included in the model. However, the costs of rescue medication are modest, and the resource use associated with side-effects are typically low; therefore, the economic impact of not including these costs is expected to be insignificantCitation11.
Conclusion
In conclusion, the model shows that adding NEPA to a payer or practice formulary results in a net decrease in the total budget due to a substantial reduction in CINV event-related resource utilization and medical costs, and increase in pharmacy costs <1%, saving over $5,000 per patient moved to NEPA. With mounting cost pressure in oncology, and the creation of US government mandates measuring avoidable hospitalization for toxicities including nausea and emesis, payers and practices may find enhancement of CINV prophylaxis to be a worthwhile clinical and economic investment.
Transparency
Declaration of financial/other relationships
GB is an employee of Helsinn Therapeutics (US), Inc. SP, SC, and MB are employees of Pharmerit International, which has received consultancy fees from Helsinn Therapeutics (US), Inc. for this study. JME peer reviewers on this manuscript have no relevant financial or other relationships to disclose.
Previous presentations
This study was presented at the AMCP Managed Care & Specialty Pharmacy Annual Meeting, Boston, MA, April 23–26, 2018, as a poster abstract.
Acknowledgements
None reported.
Additional information
Funding
Related Research Data
References
- Hesketh PJ, Bohlke K, Lyman GH, et al. Antiemetics: American Society of Clinical Oncology focused guideline update. JCO. 2016;34:381–386.
- Jordan K, Gralla R, Jahn F, et al. International antiemetic guidelines on chemotherapy induced nausea and vomiting (CINV): content and implementation in daily routine practice. Eur J Pharmacol. 2014;722:197–202.
- Kris MG, Hesketh PJ, Somerfield MR, et al. American Society of Clinical Oncology guideline for antiemetics in oncology: update 2006. JCO. 2006;24:2932–2947.
- Burke TA, Wisniewski T, Ernst FR. Resource utilization and costs associated with chemotherapy-induced nausea and vomiting (CINV) following highly or moderately emetogenic chemotherapy administered in the US outpatient hospital setting. Support Care Cancer. 2011;19:131–140.
- Ballatori E, Roila F, Ruggeri B, et al. The cost of chemotherapy-induced nausea and vomiting in Italy. Support Care Cancer. 2007;15:31–38.
- Turini M, Piovesana V, Ruffo P, et al. An assessment of chemotherapy-induced nausea and vomiting direct costs in three EU countries. DIC. 2015;4:1.
- Craver C, Gayle J, Balu S, et al. Clinical and economic burden of chemotherapy-induced nausea and vomiting among patients with cancer in a hospital outpatient setting in the United States. J Med Econ. 2011;14:87–98.
- The Centers for Medicare & Medicaid Services (CMS). CMS proposes hospital outpatient prospective payment changes for 2017. [cited 2018, May 11]. Available from: https://www.cms.gov/Newsroom/MediaReleaseDatabase/Fact-sheets/2016-Fact-sheets-items/2016-07-06.html.
- Federal Register, Volume 81, Issue 135 (July 14, 2016), 81 FR 45603.
- National Comprehensive Cancer Network. NCCN Clinical Practice Guidelines in Oncology: Antiemesis version 1.2018. 2018 [cited 2018, March 28]. Available from: https://www.nccn.org/professionals/physician_gls/pdf/antiemesis.pdf.
- Rapoport BL. Differential pharmacology and clinical utility of rolapitant in chemotherapy-induced nausea and vomiting. CMAR. 2017;9:41–50.
- Jordan K, Sippel C, Schmoll HJ. Guidelines for antiemetic treatment of chemotherapy-induced nausea and vomiting: past, present, and future recommendations. Oncologist. 2007;12:1143–1150.
- O’Sullivan CC, Van Houten HK, Sangaralingham LR, et al. Ten-year trends in antiemetic prescribing in patients receiving highly emetogenic chemotherapy. J Natl Compr Canc Netw. 2018;16:294–299.
- Roeland E, Ruddy K, LeBlanc T, et al. Gaps in compliance with current antiemetic guidelines for highly emetogenic chemotherapy. Presented at the National Comprehensive Cancer Network; 2018; Orlando, FL.
- Fitch K, Pelizzari P, Pyenson B. Cost drivers of cancer care: a retrospective analysis of medicare and commercially insured population claim data 2004–2014. Milliman; 2016. Available from: http://www.milliman.com/uploadedFiles/insight/2016/trends-in-cancer-care.pdf.
- Market research data on file. Helsinn Therapeutics, US., April 2017.
- Gilmore JW, Peacock NW, Gu A, et al. Antiemetic guideline consistency and incidence of chemotherapy-induced nausea and vomiting in US community oncology practice: INSPIRE study. JOP. 2014;10:68–74.
- Aykenzo (netupitant and palonestron) [package insert]. Iselin, NJ: Helsinn Therapeutics, US; 2014.
- Emend (aprepitant) [package insert]. Kenilworth, NJ: Merck & Co.; 2003.
- Aloxi (palonosetron HCL) [package insert]. Woodcliff Lake, N.J. and Lugano, Switzerland: Eisai & Helsinn Therapeutics; 2014.
- Longo F, Mansueto G, Lapadula V, et al. Palonosetron plus 3-day aprepitant and dexamethasone to prevent nausea and vomiting in patients receiving highly emetogenic chemotherapy. Support Care Cancer. 2011;19:1159–1164.
- Hingmire S, Raut N. Open-label observational study to assess the efficacy and safety of aprepitant for chemotherapy-induced nausea and vomiting prophylaxis in Indian patients receiving chemotherapy with highly emetogenic chemotherapy/moderately emetogenic chemotherapy regimens. South Asian J Cancer. 2015;4:7–10.
- Raftopoulos H, Cooper W, O’Boyle E, et al. Comparison of an extended-release formulation of granisetron (APF530) versus palonosetron for the prevention of chemotherapy-induced nausea and vomiting associated with moderately or highly emetogenic chemotherapy: results of a prospective, randomized, double-blind, noninferiority phase 3 trial. Support Care Cancer. 2015;23:723–732.
- Rapoport BL, Chasen MR, Gridelli C, et al. Safety and efficacy of rolapitant for prevention of chemotherapy-induced nausea and vomiting after administration of cisplatin-based highly emetogenic chemotherapy in patients with cancer: two randomised, active-controlled, double-blind, phase 3 trials. Lancet Oncol. 2015;16:1079–1089.
- Gralla RJ, Bosnjak SM, Hontsa A, et al. A phase III study evaluating the safety and efficacy of NEPA, a fixed-dose combination of netupitant and palonosetron, for prevention of chemotherapy-induced nausea and vomiting over repeated cycles of chemotherapy. Ann Oncol. 2014;25:1333–1339.
- Hesketh PJ, Rossi G, Rizzi G, et al. Efficacy and safety of NEPA, an oral combination of netupitant and palonosetron, for prevention of chemotherapy-induced nausea and vomiting following highly emetogenic chemotherapy: a randomized dose-ranging pivotal study. Ann Oncol. 2014;25:1340–1346.
- Rashid N, Koh HA, Baca HC, et al. Economic burden related to chemotherapy-related adverse events in patients with metastatic breast cancer in an integrated health care system. BCTT. 2016;8:173–181.
- Agency for Healthcare Research and Quality. Healthcare Resource Utilization Project. [cited 2017, June 1]. Available from: https://hcupnet.ahrq.gov/#setup.
- Smith MW, Friedman B, Karaca Z, et al. Predicting inpatient hospital payments in the United States: a retrospective analysis. BMC Health Serv Res. 2015;15:372.
- Peterson C, Xu L, Florence C, et al. Professional fee ratios for US hospital discharge data. Med Care. 2015;53:840–849.
- Towle EL, Barr TR, Senese JL. The National Practice Benchmark for oncology, 2014 report on 2013 data. J Oncol Pract. 2014;10:385–406.
- Caldwell N, Srebotnjak T, Wang T, et al. “How much will I get charged for this?” Patient charges for top ten diagnoses in the emergency department. PLoS One. 2013;8:e55491.
- Basch E, Deal AM, Dueck AC, et al. Overall survival results of a trial assessing patient-reported outcomes for symptom monitoring during routine cancer treatment. JAMA. 2017;318:197–198.
- Restelli U, Saibene G, Nardulli P, et al. Cost-utility and budget impact analyses of the use of NEPA for chemotherapy-induced nausea and vomiting prophylaxis in Italy. BMJ Open. 2017;7:e015645.
- D’Agostino P, Cawston H, Bourhis F, et al. Fixed combination netupitant and palonosetron is a cost-effective intervention for the prevention of chemotherapy-induced nausea and vomiting in the Uk. Value Health. 2015;18:A461.